| Param | Original file | Final file |
|---|---|---|
| Filename | modeM0/AS1A10_094T16_9000004304_29980cztM0_level2.evt | modeM0/AS1A10_094T16_9000004304_29980cztM0_level2_quad_clean.evt |
| Size (bytes) | 200,730,240 | 50,472,000 |
| Size | 191.4 MB | 48.1 MB |
| Events in quadrant A | 1,275,548 | 346,941 |
| Events in quadrant B | 2,001,490 | 344,372 |
| Events in quadrant C | 1,287,062 | 332,871 |
| Events in quadrant D | 1,349,058 | 330,269 |
| Mode SS | |||
|---|---|---|---|
| Quadrant | BADHDUFLAG | Total packets | Discarded packets |
| A | 0 | 50 | 0 |
| B | 0 | 50 | 0 |
| C | 0 | 50 | 0 |
| D | 0 | 50 | 0 |
| Mode M9 | |||
|---|---|---|---|
| Quadrant | BADHDUFLAG | Total packets | Discarded packets |
| A | 0 | 10 | 0 |
| B | 0 | 10 | 0 |
| C | 0 | 10 | 0 |
| D | 0 | 10 | 0 |
| Mode M0 | |||
|---|---|---|---|
| Quadrant | BADHDUFLAG | Total packets | Discarded packets |
| A | 0 | 5203 | 1 |
| B | 0 | 7517 | 1 |
| C | 0 | 5333 | 1 |
| D | 0 | 5438 | 1 |
| Quadrant | Total seconds | Saturated seconds | Saturation percentage |
|---|---|---|---|
| A | 2417 | 62 | 2.565163% |
| B | 2417 | 108 | 4.468349% |
| C | 2417 | 65 | 2.689284% |
| D | 2417 | 34 | 1.406703% |
Noise dominated data is calculated using 1-second bins in cleaned event files. If a bin has >2000 counts, and if more than 50% of those come from <1% of pixels, then it is considered to be noise-dominated and hence unusable.
| Quadrant | # 1 sec bins | Bins with >0 counts | Bins with >2000 counts | High rate bins dominated by noise | Noise dominated (total time) | Noise dominated (detector-on time) | Marked lightcurve |
|---|---|---|---|---|---|---|---|
| A | 3397 | 2418 | 0 | 0 | 0.00% | 0.00% | 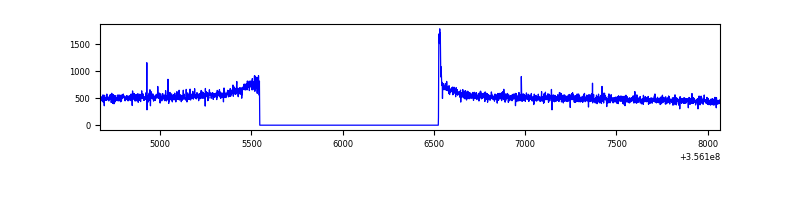 |
| B | 3397 | 2418 | 0 | 0 | 0.00% | 0.00% | 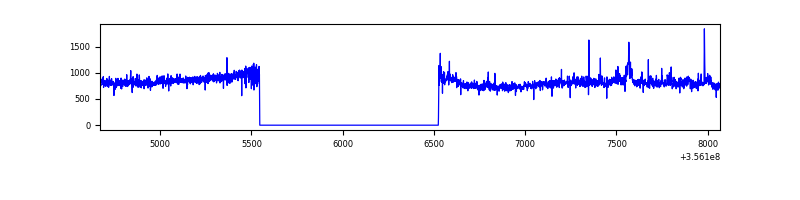 |
| C | 3397 | 2418 | 0 | 0 | 0.00% | 0.00% |  |
| D | 3397 | 2418 | 8 | 8 | 0.24% | 0.33% | 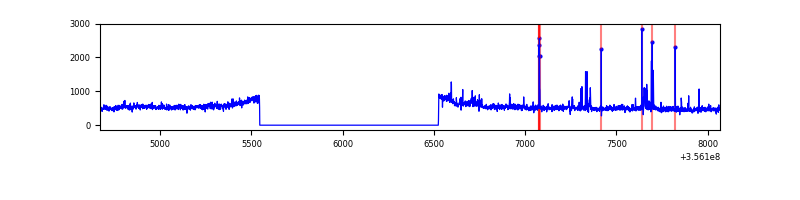 |
Top three noisy pixels from each quadrant. If the there are fewer than three noisy pixels in the level2.evt file, extra rows are filled as -1
| Pixel properties | Quadrant properties | ||||||
|---|---|---|---|---|---|---|---|
| Quadrant | DetID | PixID | Counts | Sigma | Mean | Median | Sigma |
| A | 8 | 192 | 13823 | 202.17 | 326 | 319 | 66.8 |
| A | 13 | 254 | 4956 | 69.42 | 326 | 319 | 66.8 |
| A | 3 | 137 | 3149 | 42.37 | 326 | 319 | 66.8 |
| B | 6 | 159 | 680304 | 10998.63 | 317 | 309 | 61.8 |
| B | 0 | 190 | 51914 | 834.69 | 317 | 309 | 61.8 |
| B | 6 | 36 | 17765 | 282.34 | 317 | 309 | 61.8 |
| C | 14 | 238 | 50350 | 683.7 | 308 | 308 | 73.2 |
| C | 3 | 233 | 28973 | 391.64 | 308 | 308 | 73.2 |
| C | 2 | 114 | 5885 | 76.2 | 308 | 308 | 73.2 |
| D | 8 | 195 | 76511 | 997.47 | 317 | 308 | 76.4 |
| D | 7 | 80 | 47365 | 615.96 | 317 | 308 | 76.4 |
| D | 1 | 52 | 9820 | 124.51 | 317 | 308 | 76.4 |
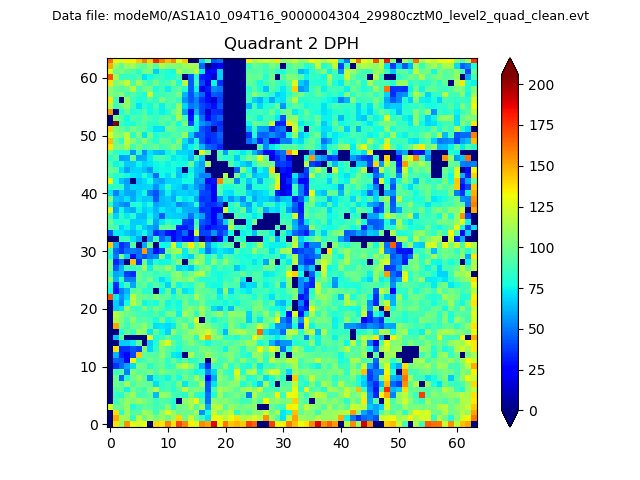
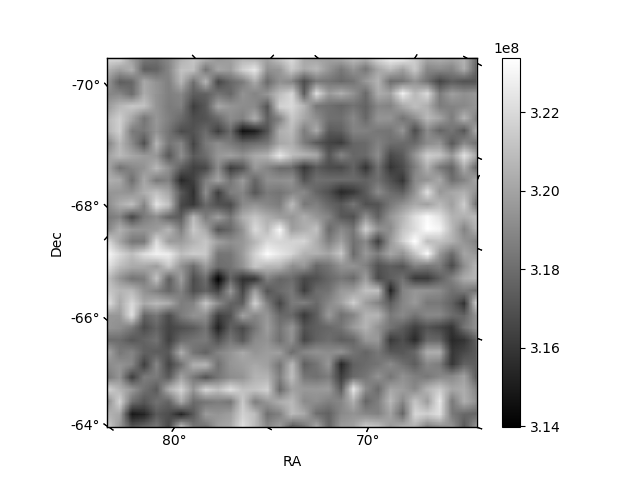
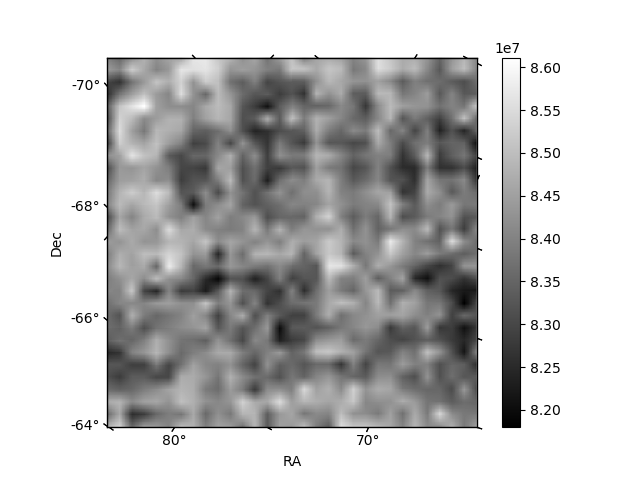
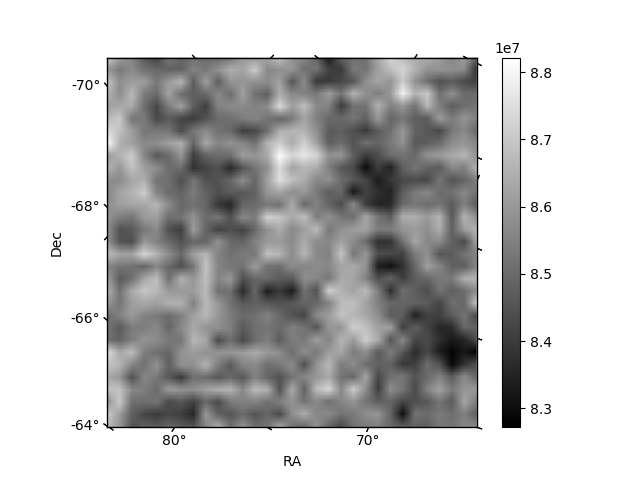
Histogram calculated using DETX and DETY for each event in the final _common_clean file
| Quadrant A | 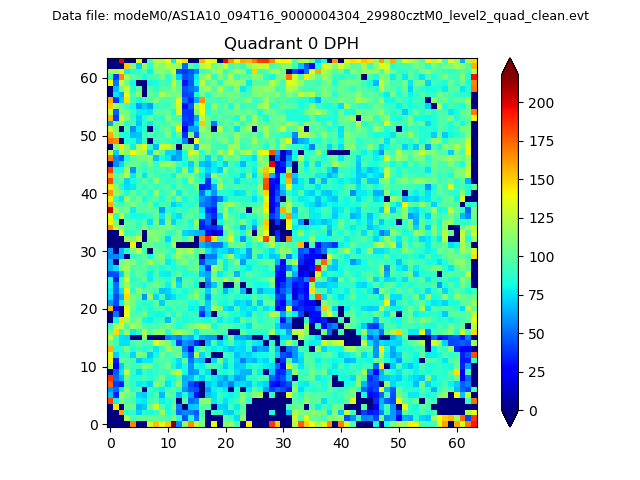 |
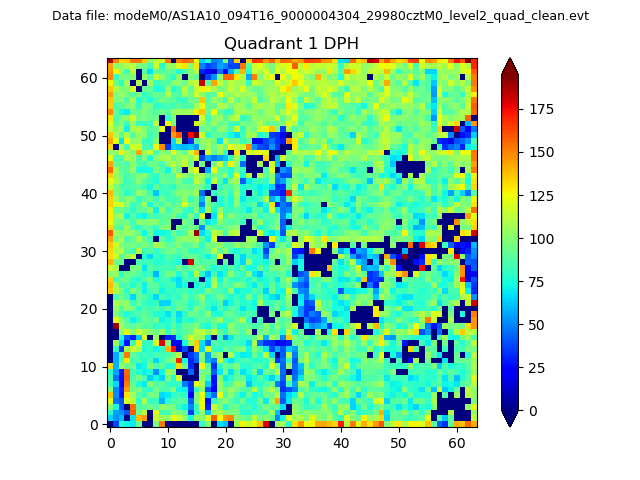 |
Quadrant B |
|---|---|---|---|
| Quadrant D | 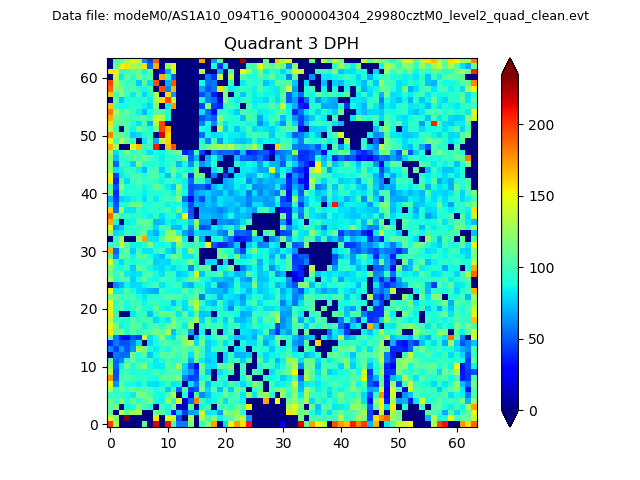 |
 |
Quadrant C |
| Plot type | Count rate plots | Images |
|---|---|---|
| Comparison with Poisson distribution Blue bars denote a histogram of data divided into 1 sec bins. Red curve is a Poisson curve with rate = median count rate of data. |
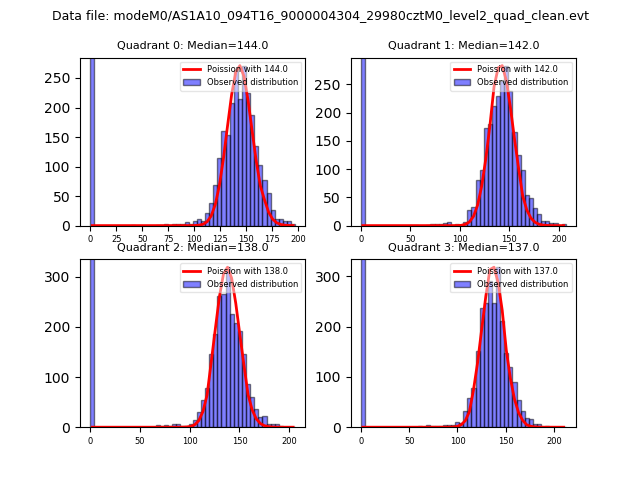 |
 |
| Quadrant-wise count rates Data is divided into 100 sec bins |
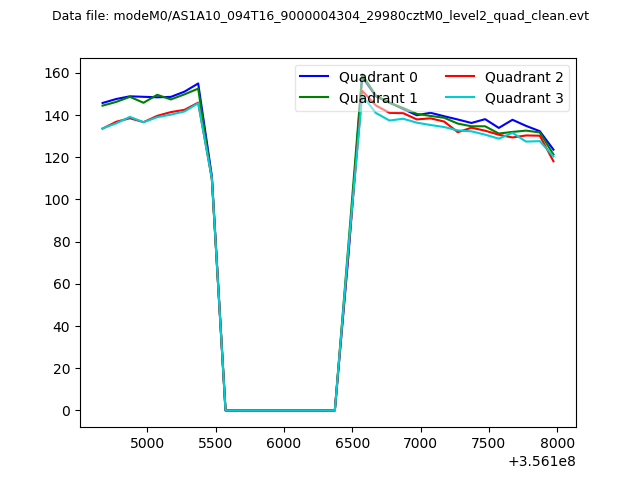 |
|
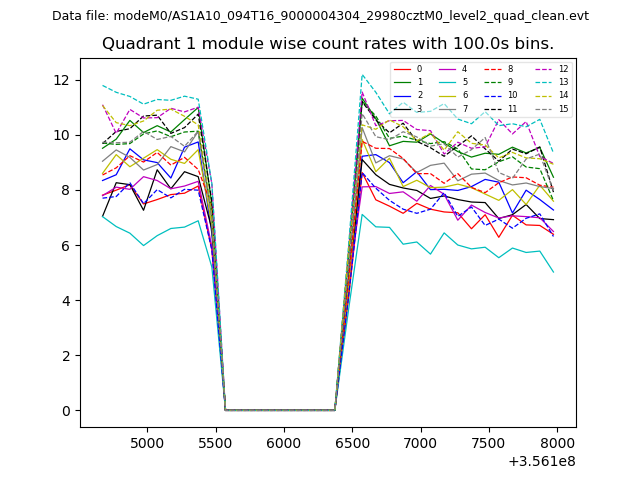
| Module-wise count rates for Quadrant A Data is divided into 100 sec bins |
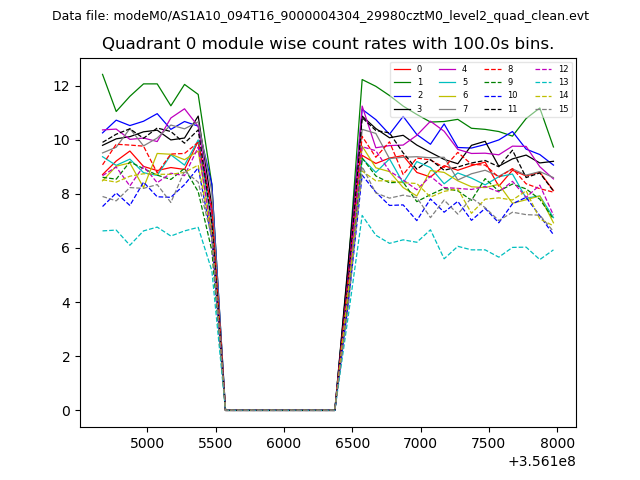 |
 |
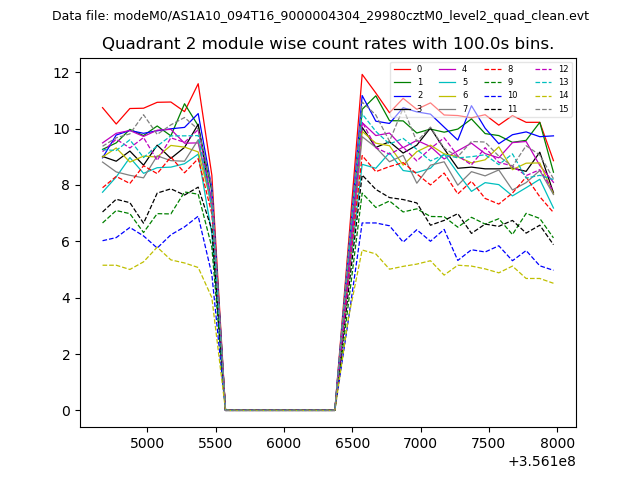
| Module-wise count rates for Quadrant B Data is divided into 100 sec bins |
 |
 |
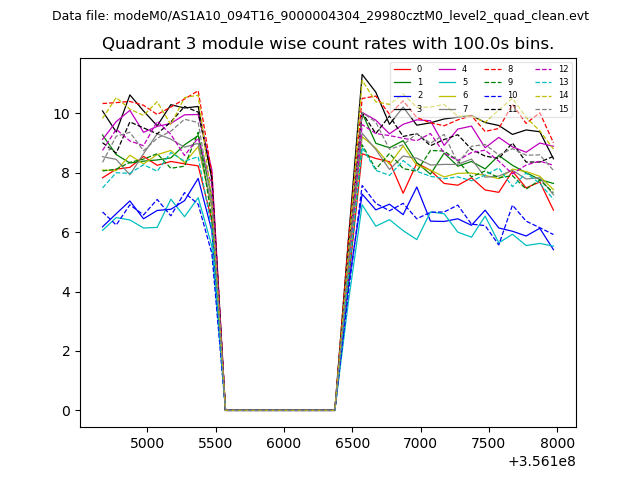
| Module-wise count rates for Quadrant C Data is divided into 100 sec bins |
 |
 |
| Module-wise count rates for Quadrant D Data is divided into 100 sec bins |
 |
 |
| Parameter | Plot |
|---|---|
| CZT HV Monitor | 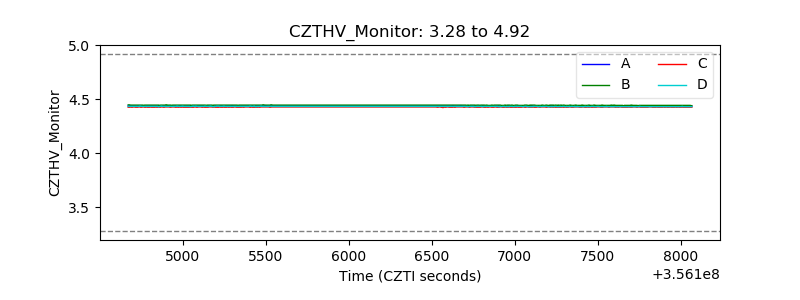 |
| D_VDD | 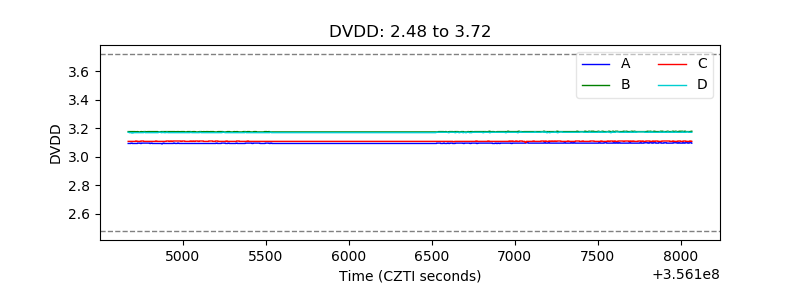 |
| Temperature 1 | 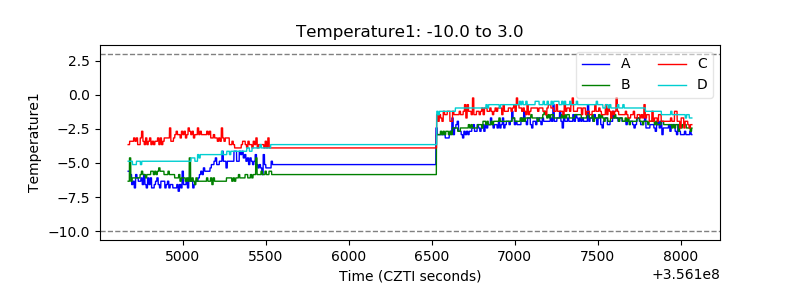 |
| Veto HV Monitor | 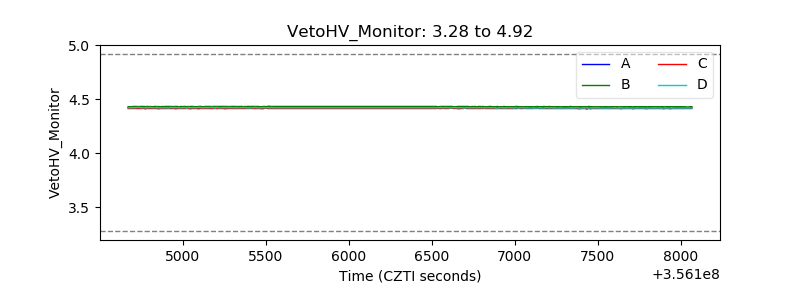 |
| Veto LLD | 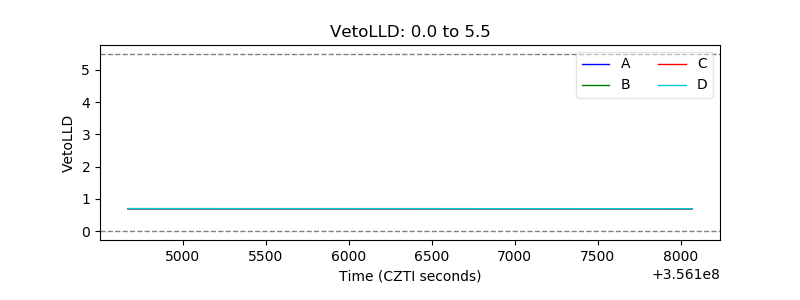 |
| Alpha Counter | 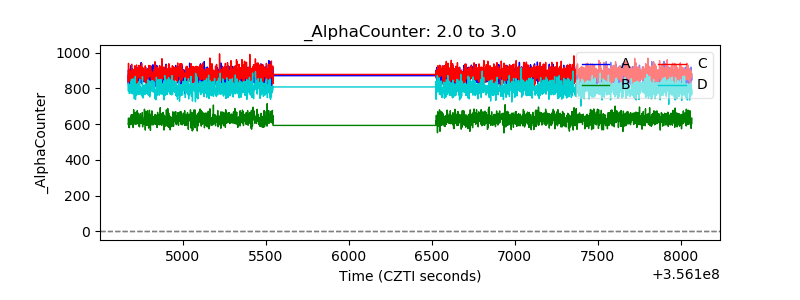 |
| _CPM_Rate | 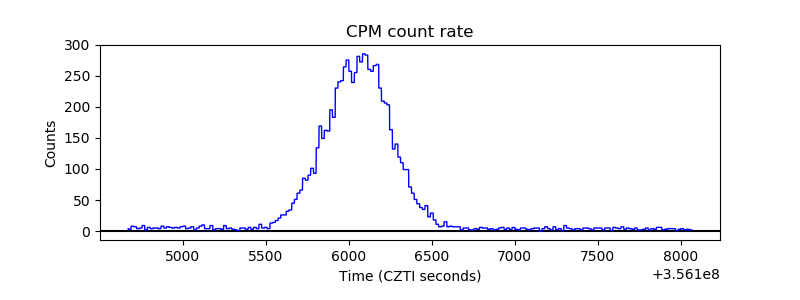 |
| CZT Counter | 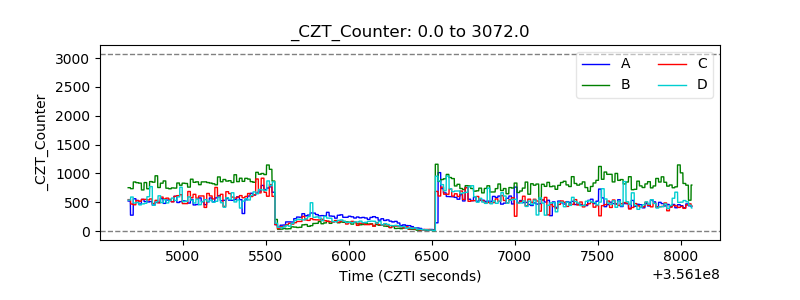 |
| +2.5 Volts monitor |  |
| +5 Volts monitor | 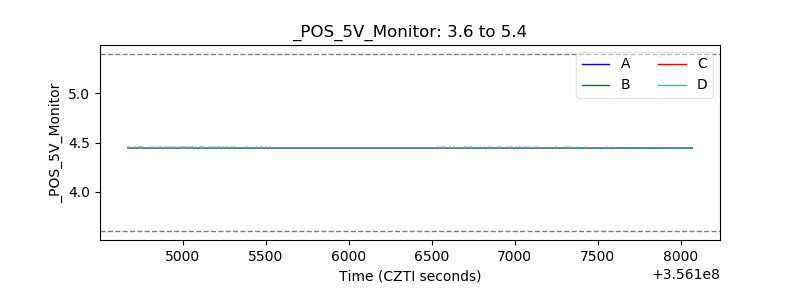 |
| _ROLL_ROT | 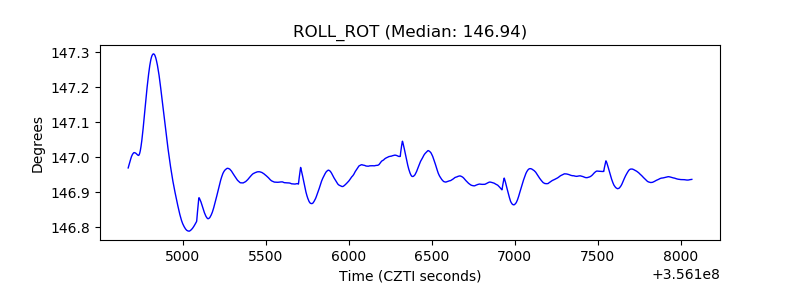 |
| _Roll_DEC | 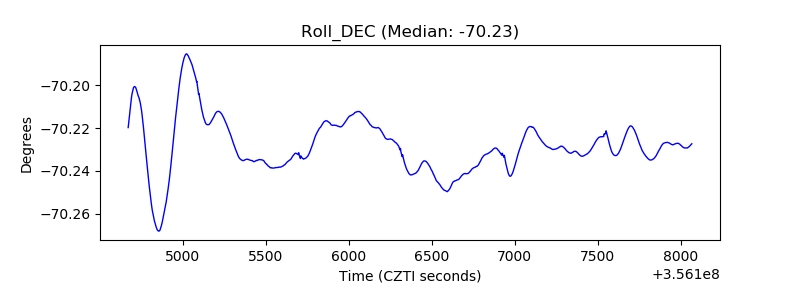 |
| _Roll_RA | 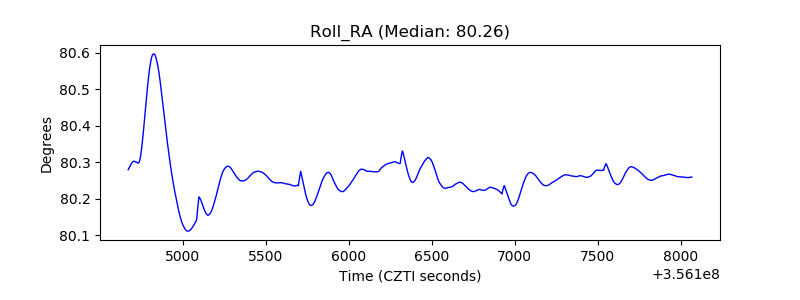 |
| Veto Counter | 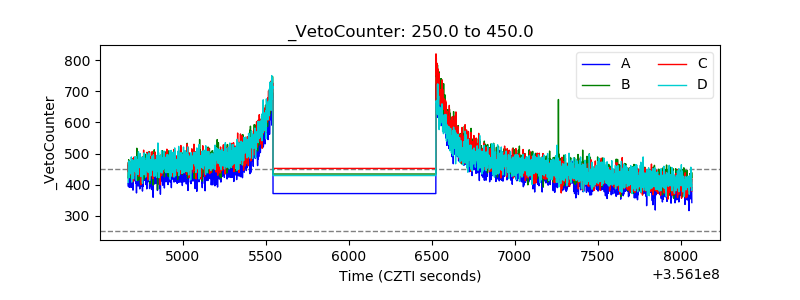 |