| Param | Original file | Final file |
|---|---|---|
| Filename | modeM0/AS1A10_094T16_9000004304_29981cztM0_level2.evt | modeM0/AS1A10_094T16_9000004304_29981cztM0_level2_quad_clean.evt |
| Size (bytes) | 557,763,840 | 137,217,600 |
| Size | 531.9 MB | 130.9 MB |
| Events in quadrant A | 3,297,007 | 946,432 |
| Events in quadrant B | 5,792,779 | 929,767 |
| Events in quadrant C | 3,594,712 | 899,964 |
| Events in quadrant D | 3,734,903 | 894,101 |
| Mode SS | |||
|---|---|---|---|
| Quadrant | BADHDUFLAG | Total packets | Discarded packets |
| A | 0 | 142 | 0 |
| B | 0 | 142 | 0 |
| C | 0 | 142 | 0 |
| D | 0 | 142 | 0 |
| Mode M9 | |||
|---|---|---|---|
| Quadrant | BADHDUFLAG | Total packets | Discarded packets |
| A | 0 | 6 | 0 |
| B | 0 | 6 | 0 |
| C | 0 | 6 | 0 |
| D | 0 | 6 | 0 |
| Mode M0 | |||
|---|---|---|---|
| Quadrant | BADHDUFLAG | Total packets | Discarded packets |
| A | 0 | 14258 | 1 |
| B | 0 | 21891 | 1 |
| C | 0 | 15306 | 1 |
| D | 0 | 15528 | 1 |
| Quadrant | Total seconds | Saturated seconds | Saturation percentage |
|---|---|---|---|
| A | 6974 | 53 | 0.759966% |
| B | 6975 | 123 | 1.763441% |
| C | 6975 | 78 | 1.118280% |
| D | 6974 | 52 | 0.745627% |
Noise dominated data is calculated using 1-second bins in cleaned event files. If a bin has >2000 counts, and if more than 50% of those come from <1% of pixels, then it is considered to be noise-dominated and hence unusable.
| Quadrant | # 1 sec bins | Bins with >0 counts | Bins with >2000 counts | High rate bins dominated by noise | Noise dominated (total time) | Noise dominated (detector-on time) | Marked lightcurve |
|---|---|---|---|---|---|---|---|
| A | 7569 | 6975 | 0 | 0 | 0.00% | 0.00% | 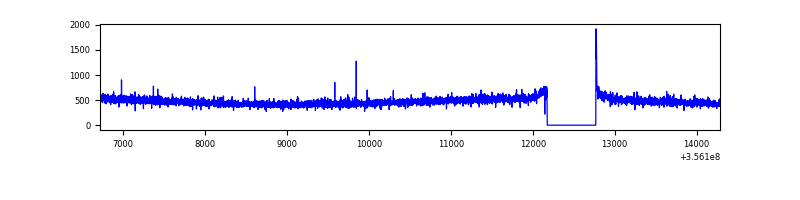 |
| B | 7570 | 6976 | 8 | 8 | 0.11% | 0.11% | 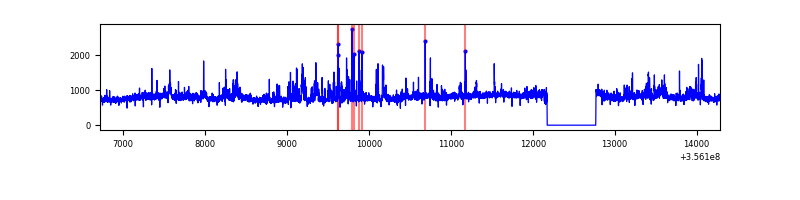 |
| C | 7570 | 6976 | 0 | 0 | 0.00% | 0.00% | 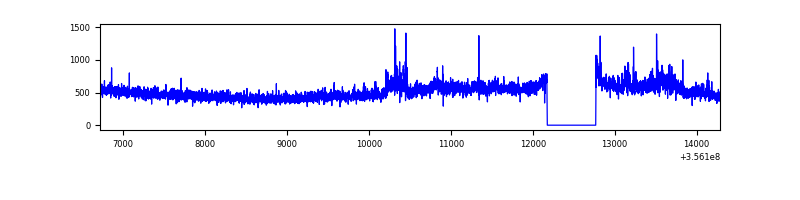 |
| D | 7569 | 6975 | 36 | 36 | 0.48% | 0.52% | 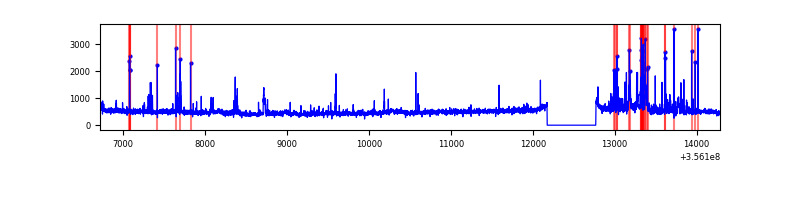 |
Top three noisy pixels from each quadrant. If the there are fewer than three noisy pixels in the level2.evt file, extra rows are filled as -1
| Pixel properties | Quadrant properties | ||||||
|---|---|---|---|---|---|---|---|
| Quadrant | DetID | PixID | Counts | Sigma | Mean | Median | Sigma |
| A | 13 | 254 | 13579 | 75.88 | 850 | 836 | 167.9 |
| A | 8 | 192 | 12858 | 71.59 | 850 | 836 | 167.9 |
| A | 3 | 137 | 8176 | 43.71 | 850 | 836 | 167.9 |
| B | 6 | 159 | 2068091 | 13021.76 | 833 | 813 | 158.8 |
| B | 6 | 36 | 264803 | 1662.87 | 833 | 813 | 158.8 |
| B | 0 | 190 | 175297 | 1099.07 | 833 | 813 | 158.8 |
| C | 3 | 233 | 325967 | 1747.03 | 802 | 805 | 186.1 |
| C | 14 | 238 | 130365 | 696.1 | 802 | 805 | 186.1 |
| C | 2 | 114 | 16673 | 85.26 | 802 | 805 | 186.1 |
| D | 8 | 195 | 265056 | 1375.9 | 816 | 794 | 192.1 |
| D | 12 | 233 | 145368 | 752.74 | 816 | 794 | 192.1 |
| D | 7 | 80 | 136290 | 705.47 | 816 | 794 | 192.1 |
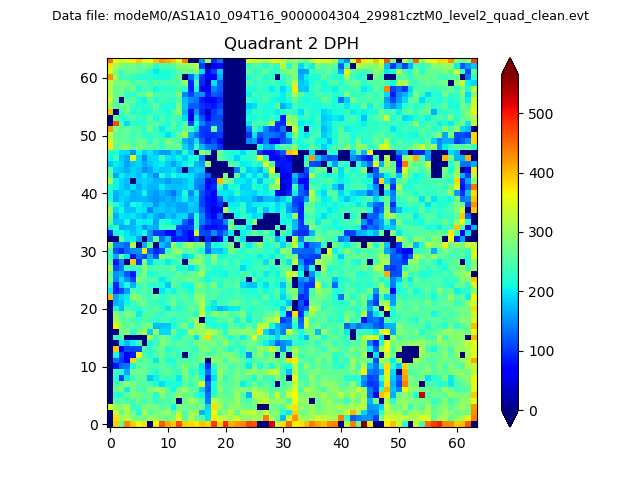
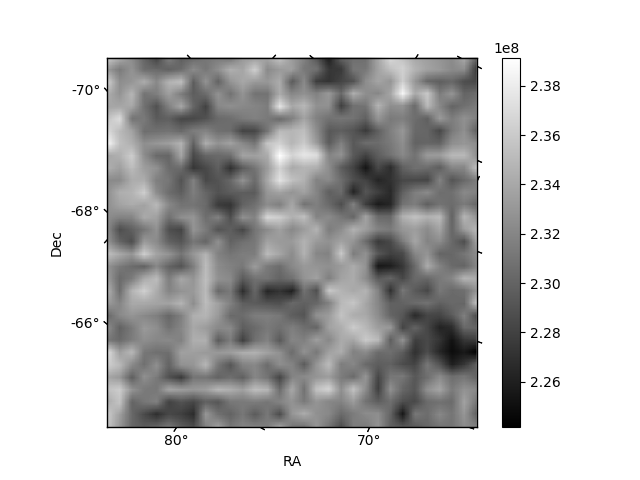
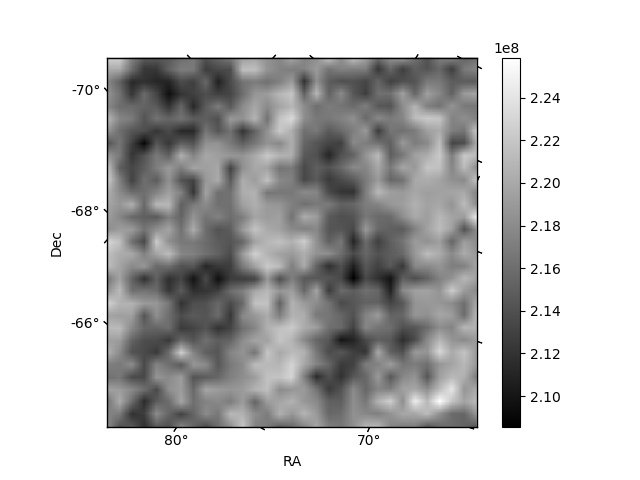
Histogram calculated using DETX and DETY for each event in the final _common_clean file
| Quadrant A | 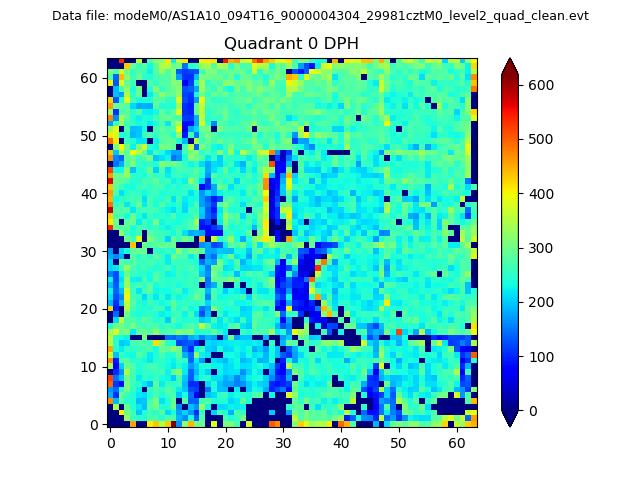 |
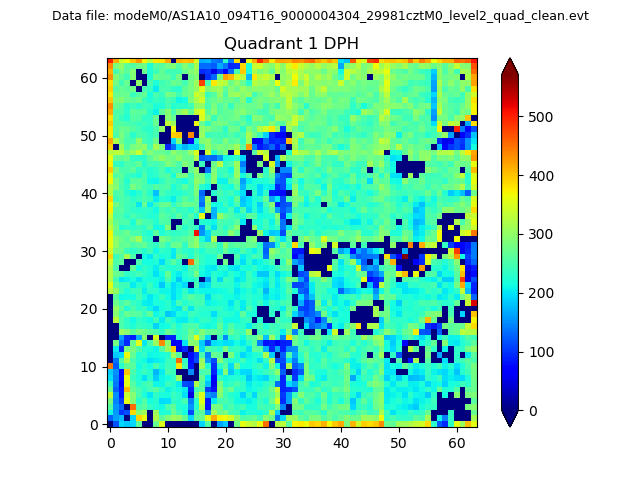 |
Quadrant B |
|---|---|---|---|
| Quadrant D | 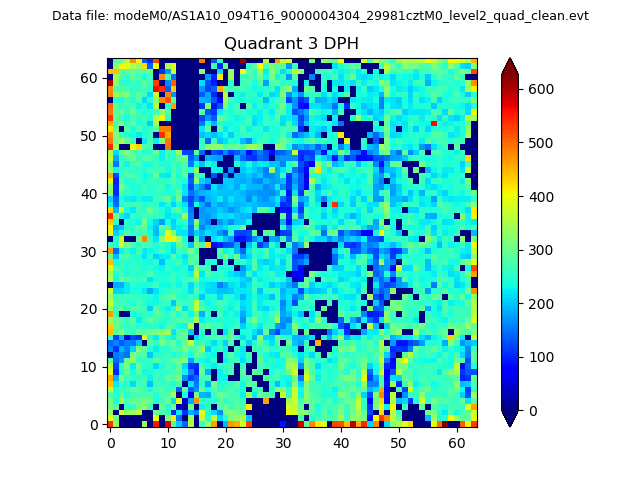 |
 |
Quadrant C |
| Plot type | Count rate plots | Images |
|---|---|---|
| Comparison with Poisson distribution Blue bars denote a histogram of data divided into 1 sec bins. Red curve is a Poisson curve with rate = median count rate of data. |
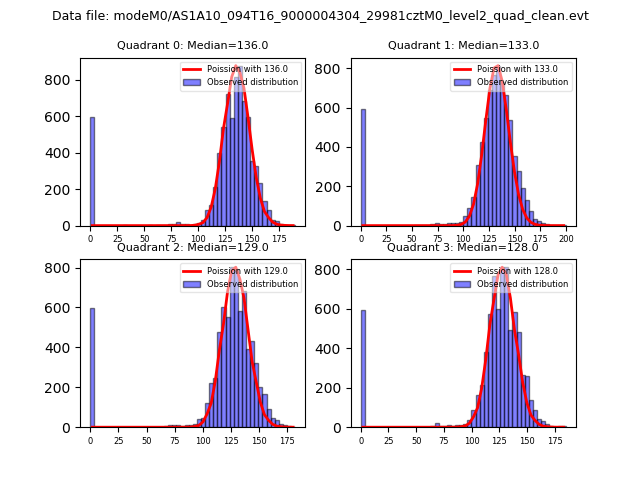 |
 |
| Quadrant-wise count rates Data is divided into 100 sec bins |
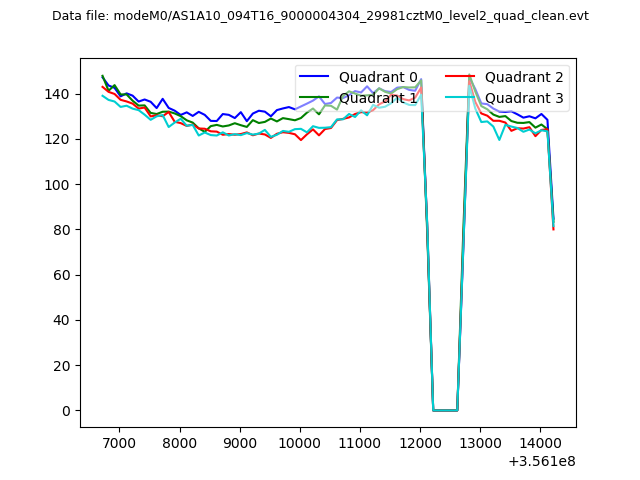 |
|
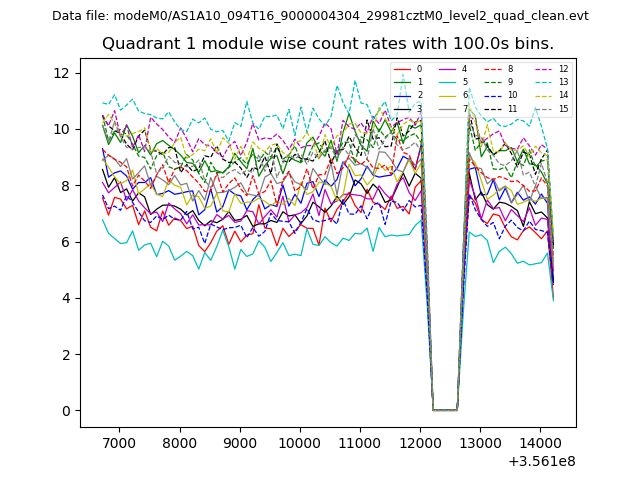
| Module-wise count rates for Quadrant A Data is divided into 100 sec bins |
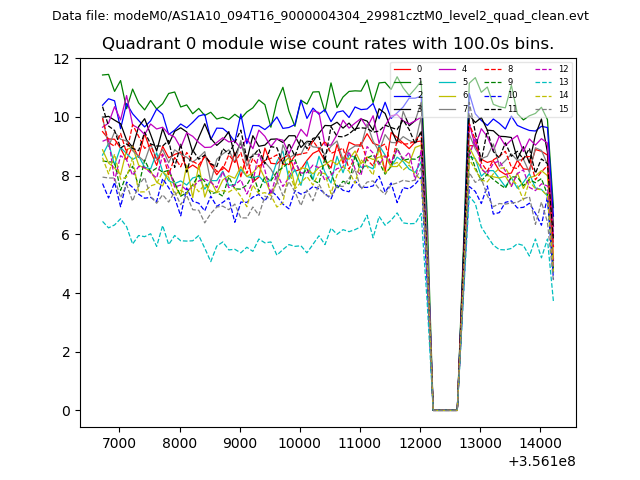 |
 |
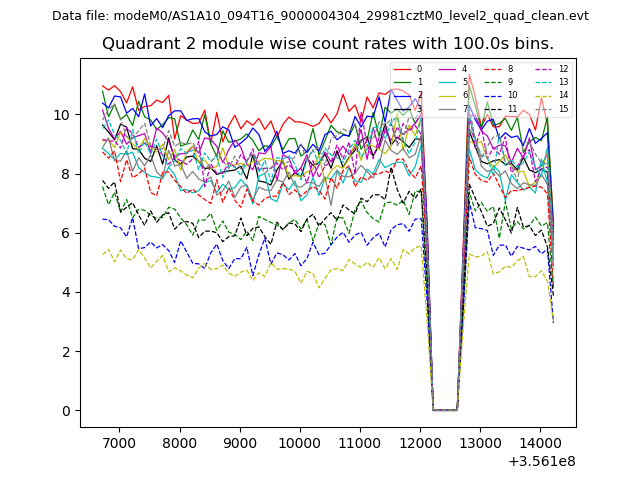
| Module-wise count rates for Quadrant B Data is divided into 100 sec bins |
 |
 |
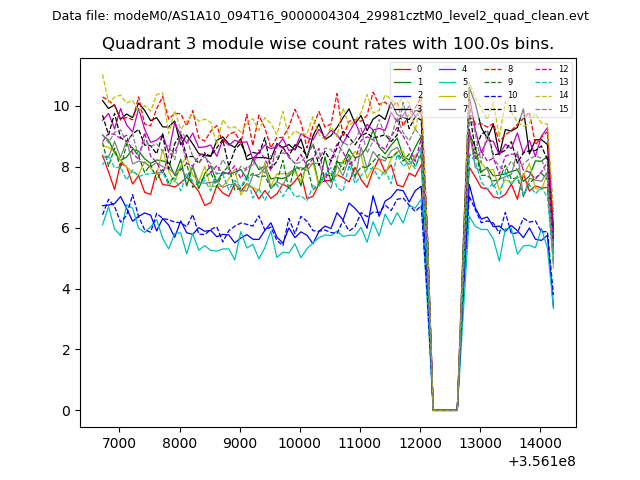
| Module-wise count rates for Quadrant C Data is divided into 100 sec bins |
 |
 |
| Module-wise count rates for Quadrant D Data is divided into 100 sec bins |
 |
 |
| Parameter | Plot |
|---|---|
| CZT HV Monitor | 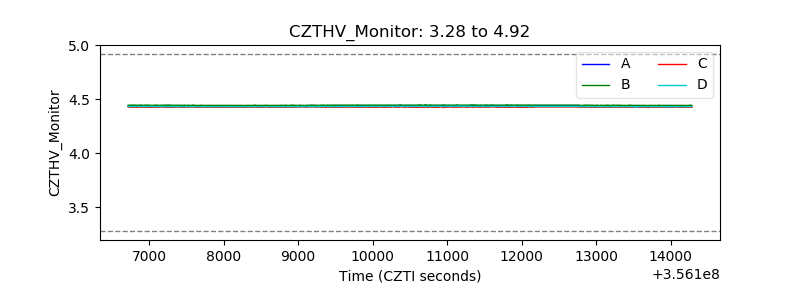 |
| D_VDD | 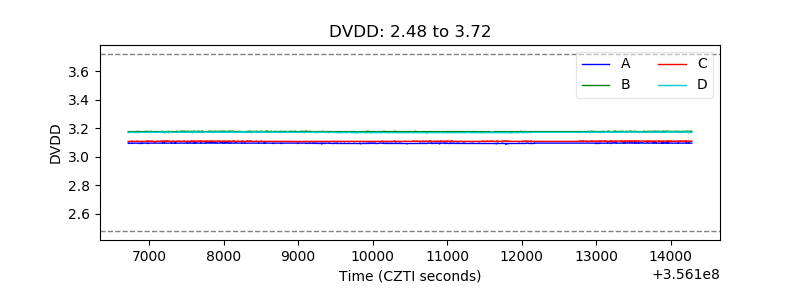 |
| Temperature 1 | 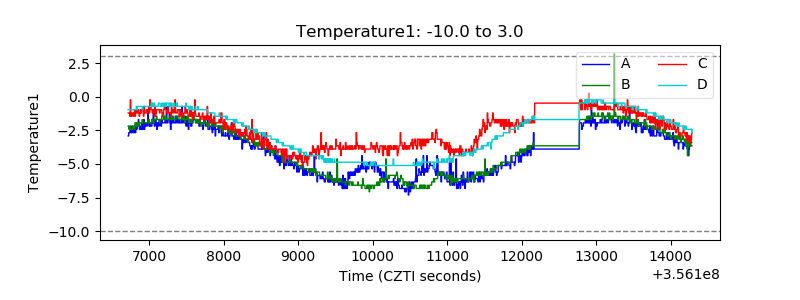 |
| Veto HV Monitor | 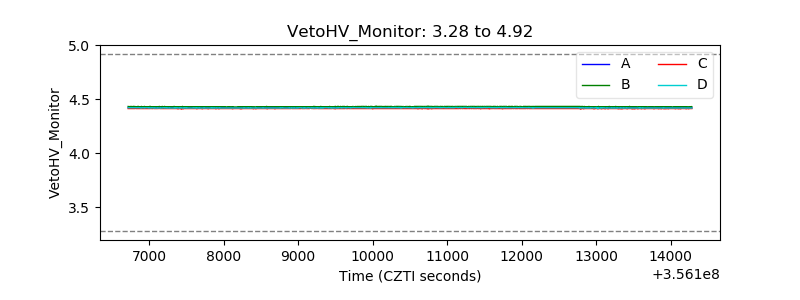 |
| Veto LLD | 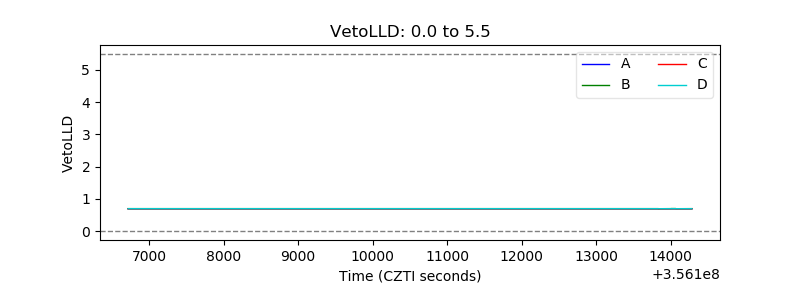 |
| Alpha Counter | 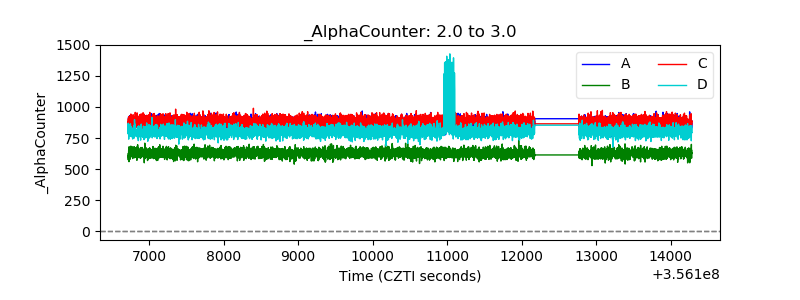 |
| _CPM_Rate | 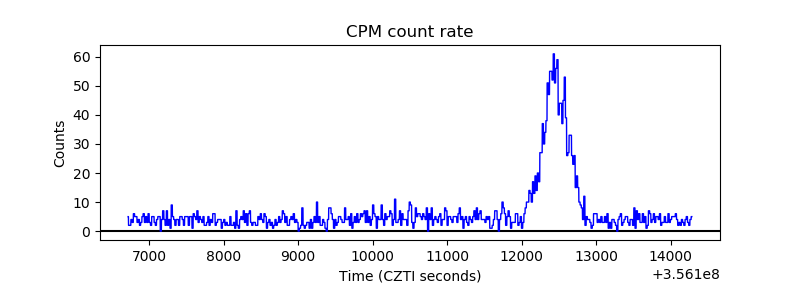 |
| CZT Counter | 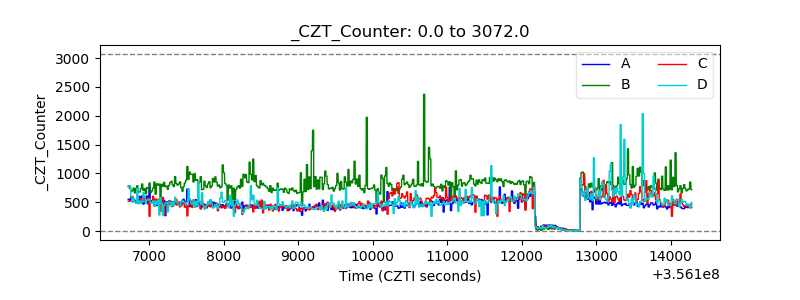 |
| +2.5 Volts monitor |  |
| +5 Volts monitor |  |
| _ROLL_ROT | 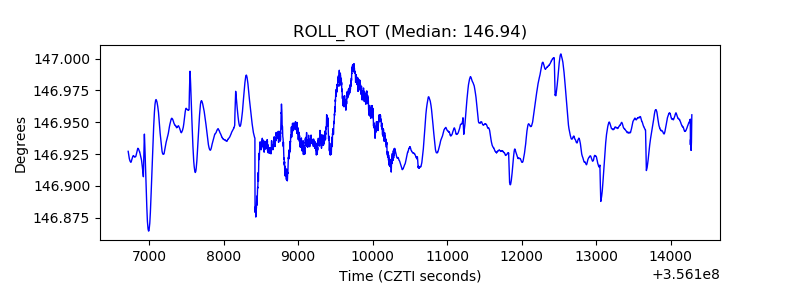 |
| _Roll_DEC | 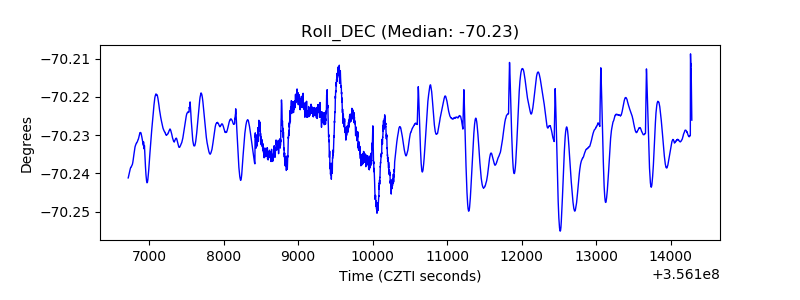 |
| _Roll_RA | 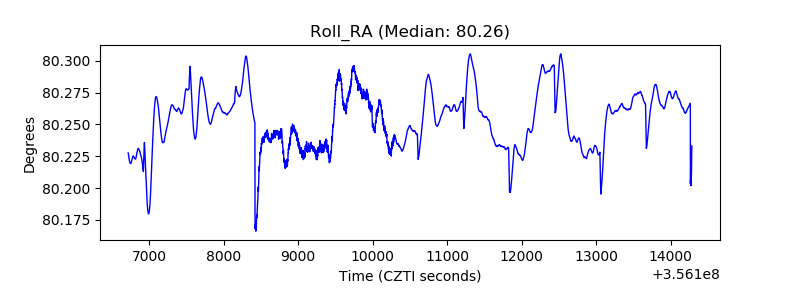 |
| Veto Counter | 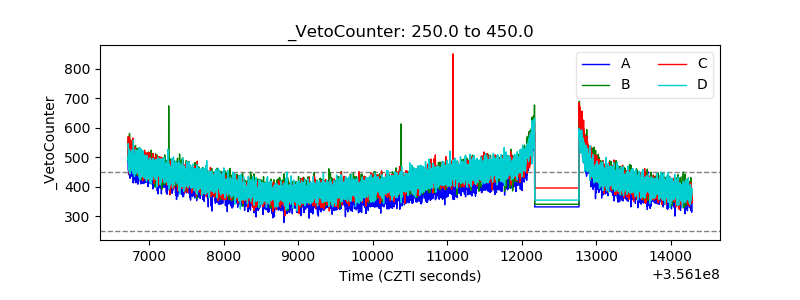 |