| Param | Original file | Final file |
|---|---|---|
| Filename | modeM0/AS1A10_094T16_9000004304_29982cztM0_level2.evt | modeM0/AS1A10_094T16_9000004304_29982cztM0_level2_quad_clean.evt |
| Size (bytes) | 93,078,720 | 21,634,560 |
| Size | 88.8 MB | 20.6 MB |
| Events in quadrant A | 503,806 | 146,453 |
| Events in quadrant B | 971,541 | 142,624 |
| Events in quadrant C | 610,895 | 139,536 |
| Events in quadrant D | 652,600 | 139,729 |
| Mode SS | |||
|---|---|---|---|
| Quadrant | BADHDUFLAG | Total packets | Discarded packets |
| A | 0 | 24 | 0 |
| B | 0 | 24 | 0 |
| C | 0 | 24 | 0 |
| D | 0 | 24 | 0 |
| Mode M0 | |||
|---|---|---|---|
| Quadrant | BADHDUFLAG | Total packets | Discarded packets |
| A | 0 | 2263 | 0 |
| B | 0 | 3657 | 0 |
| C | 0 | 2566 | 0 |
| D | 0 | 2651 | 0 |
| Quadrant | Total seconds | Saturated seconds | Saturation percentage |
|---|---|---|---|
| A | 1129 | 1 | 0.088574% |
| B | 1130 | 11 | 0.973451% |
| C | 1130 | 1 | 0.088496% |
| D | 1130 | 13 | 1.150442% |
Noise dominated data is calculated using 1-second bins in cleaned event files. If a bin has >2000 counts, and if more than 50% of those come from <1% of pixels, then it is considered to be noise-dominated and hence unusable.
| Quadrant | # 1 sec bins | Bins with >0 counts | Bins with >2000 counts | High rate bins dominated by noise | Noise dominated (total time) | Noise dominated (detector-on time) | Marked lightcurve |
|---|---|---|---|---|---|---|---|
| A | 1129 | 1129 | 0 | 0 | 0.00% | 0.00% | 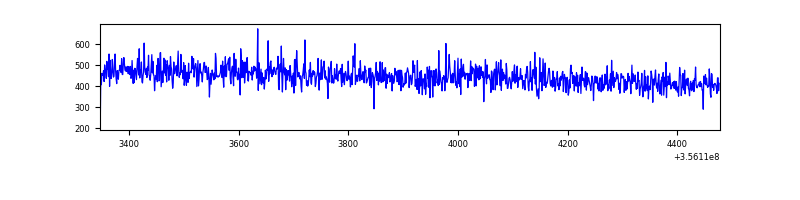 |
| B | 1130 | 1130 | 1 | 1 | 0.09% | 0.09% | 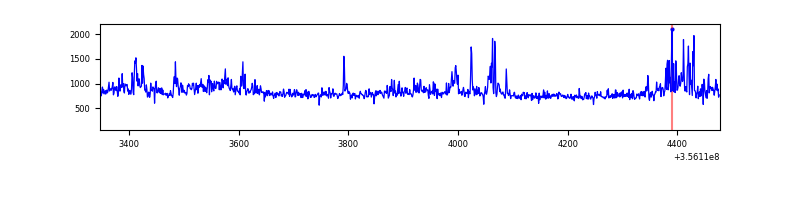 |
| C | 1130 | 1130 | 0 | 0 | 0.00% | 0.00% |  |
| D | 1130 | 1130 | 13 | 13 | 1.15% | 1.15% | 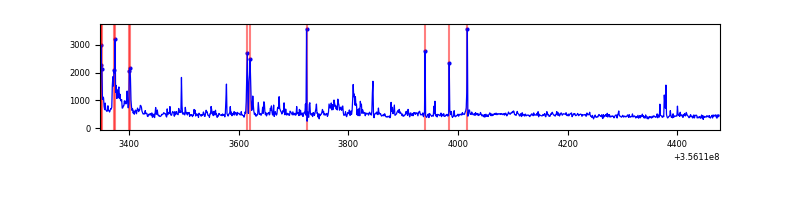 |
Top three noisy pixels from each quadrant. If the there are fewer than three noisy pixels in the level2.evt file, extra rows are filled as -1
| Pixel properties | Quadrant properties | ||||||
|---|---|---|---|---|---|---|---|
| Quadrant | DetID | PixID | Counts | Sigma | Mean | Median | Sigma |
| A | 13 | 254 | 2464 | 83.65 | 130 | 128 | 27.9 |
| A | 3 | 137 | 1193 | 38.14 | 130 | 128 | 27.9 |
| A | 0 | 226 | 1185 | 37.85 | 130 | 128 | 27.9 |
| B | 6 | 159 | 361129 | 13499.05 | 127 | 125 | 26.7 |
| B | 0 | 190 | 105528 | 3941.34 | 127 | 125 | 26.7 |
| B | 6 | 36 | 4806 | 175.04 | 127 | 125 | 26.7 |
| C | 3 | 233 | 118788 | 3954.95 | 120 | 120 | 30.0 |
| C | 14 | 238 | 19716 | 653.09 | 120 | 120 | 30.0 |
| C | 2 | 114 | 2793 | 89.09 | 120 | 120 | 30.0 |
| D | 12 | 233 | 69885 | 2253.93 | 123 | 120 | 31.0 |
| D | 8 | 195 | 60919 | 1964.26 | 123 | 120 | 31.0 |
| D | 7 | 80 | 23305 | 749.05 | 123 | 120 | 31.0 |
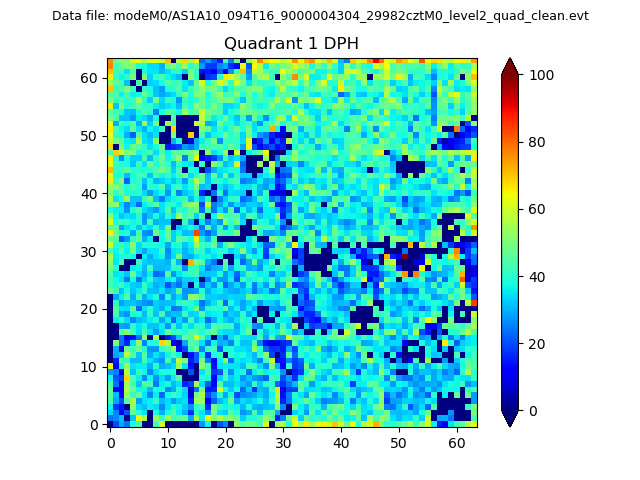
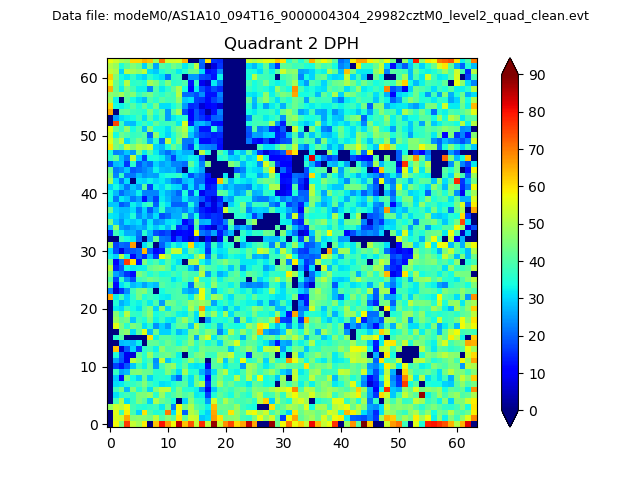
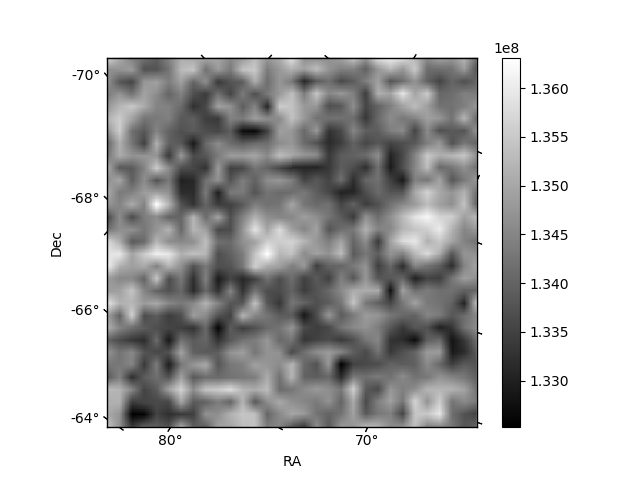
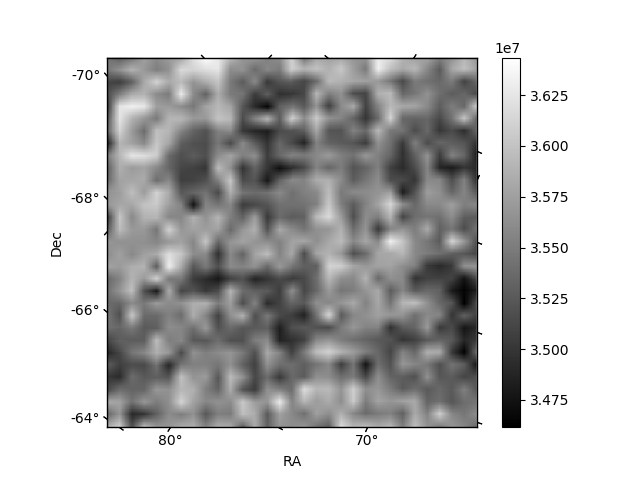
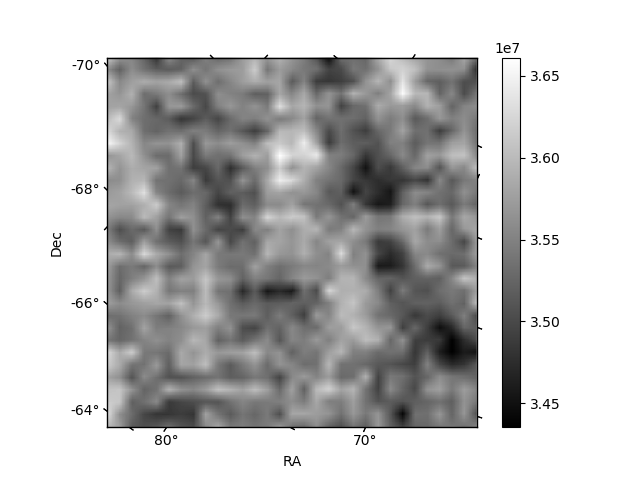
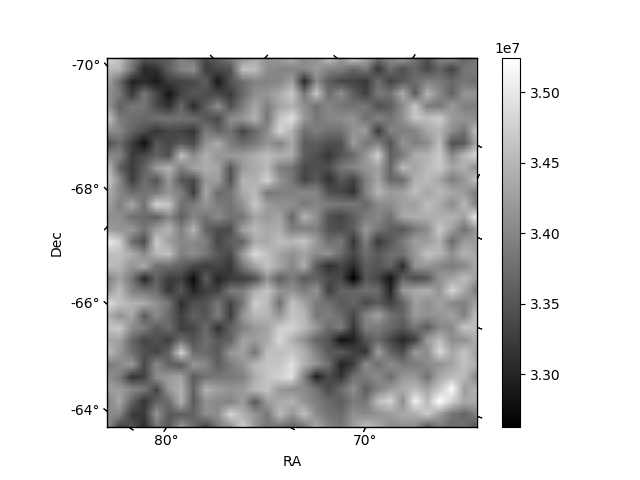
Histogram calculated using DETX and DETY for each event in the final _common_clean file
| Quadrant A | 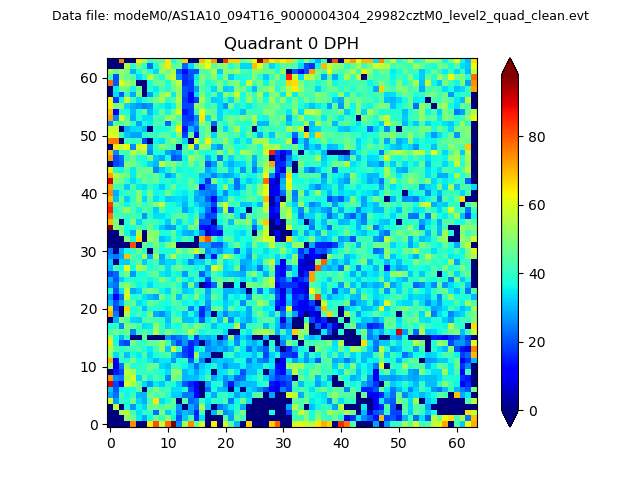 |
 |
Quadrant B |
|---|---|---|---|
| Quadrant D | 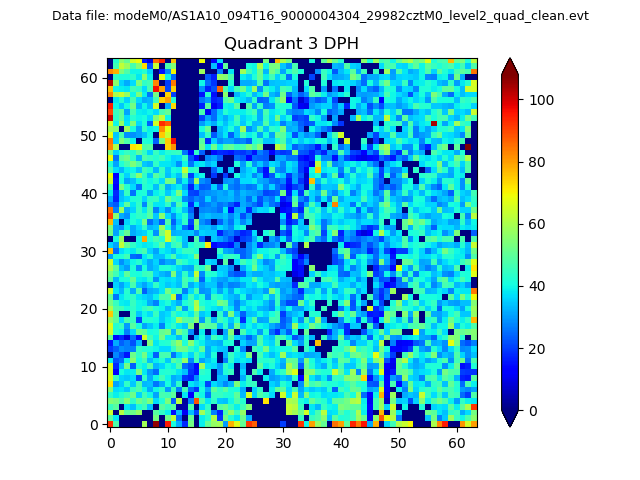 |
 |
Quadrant C |
| Plot type | Count rate plots | Images |
|---|---|---|
| Comparison with Poisson distribution Blue bars denote a histogram of data divided into 1 sec bins. Red curve is a Poisson curve with rate = median count rate of data. |
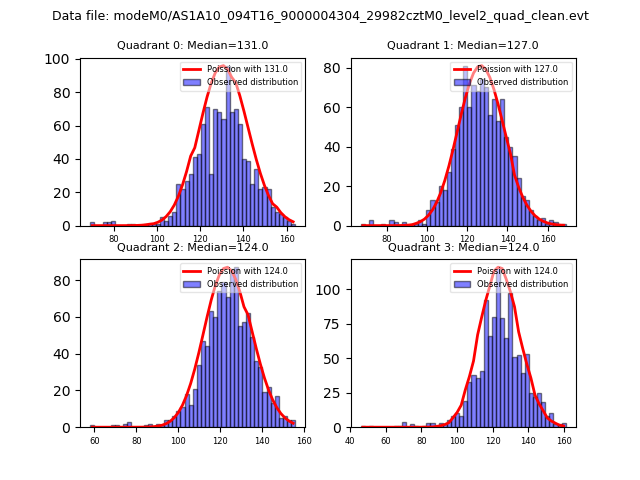 |
 |
| Quadrant-wise count rates Data is divided into 100 sec bins |
 |
|
| Module-wise count rates for Quadrant A Data is divided into 100 sec bins |
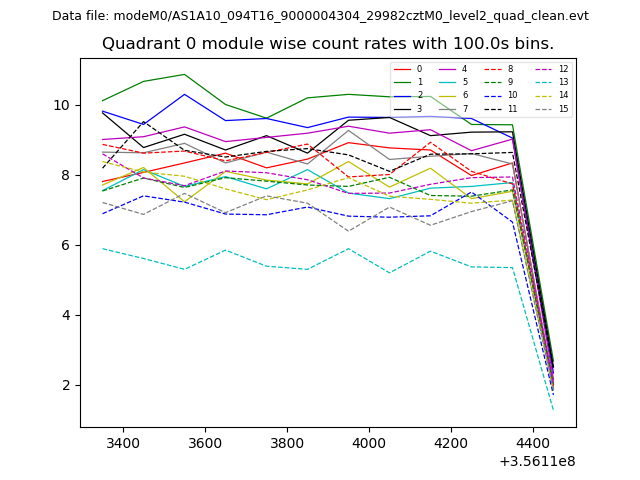 |
 |
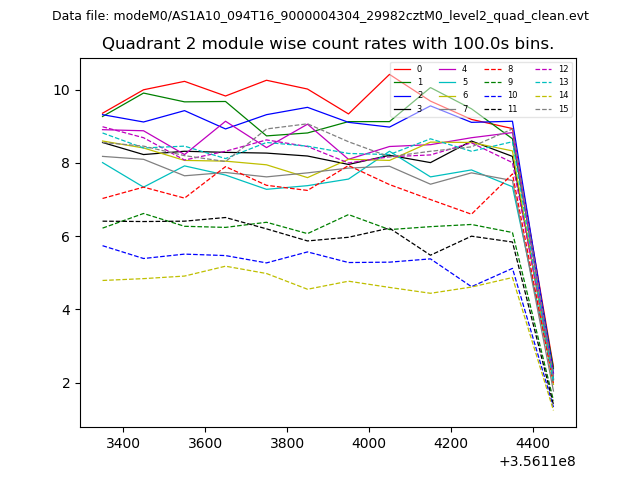
| Module-wise count rates for Quadrant B Data is divided into 100 sec bins |
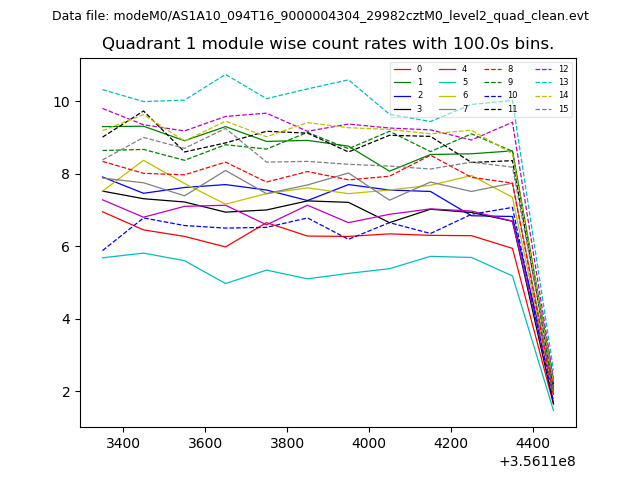 |
 |
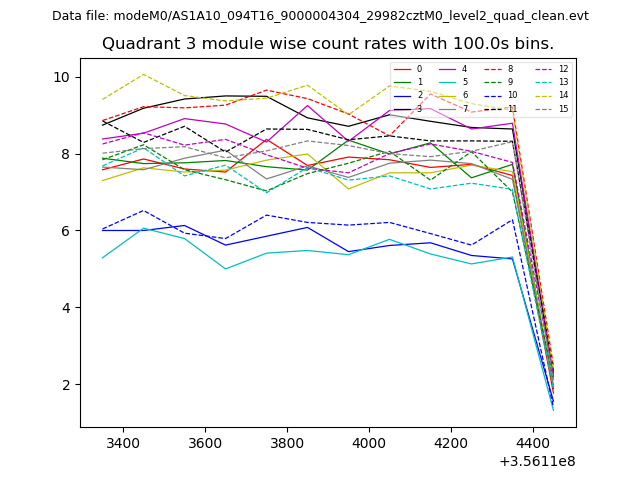
| Module-wise count rates for Quadrant C Data is divided into 100 sec bins |
 |
 |
| Module-wise count rates for Quadrant D Data is divided into 100 sec bins |
 |
 |
| Parameter | Plot |
|---|---|
| CZT HV Monitor |  |
| D_VDD | 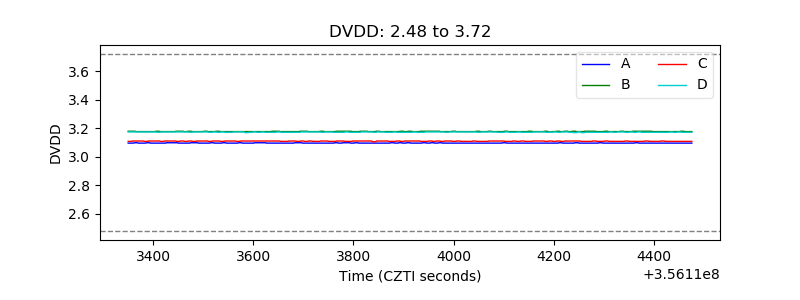 |
| Temperature 1 | 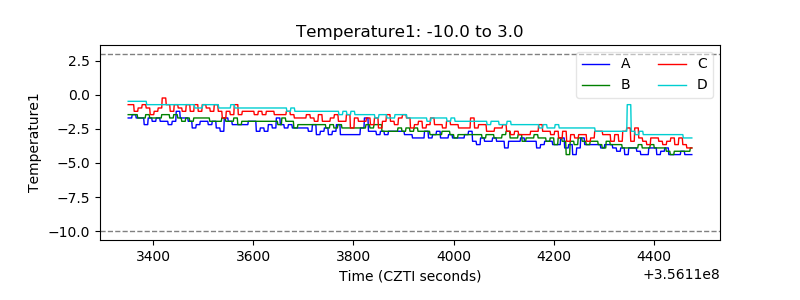 |
| Veto HV Monitor | 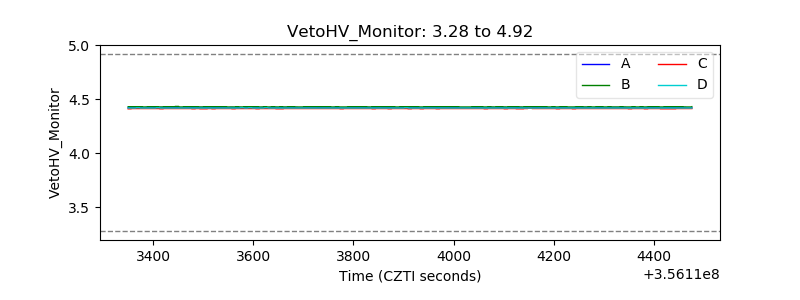 |
| Veto LLD | 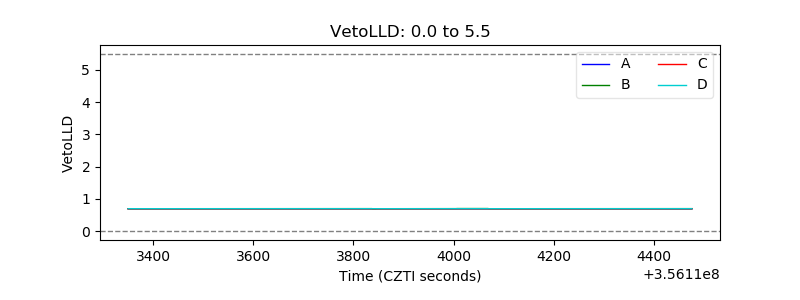 |
| Alpha Counter |  |
| _CPM_Rate |  |
| CZT Counter | 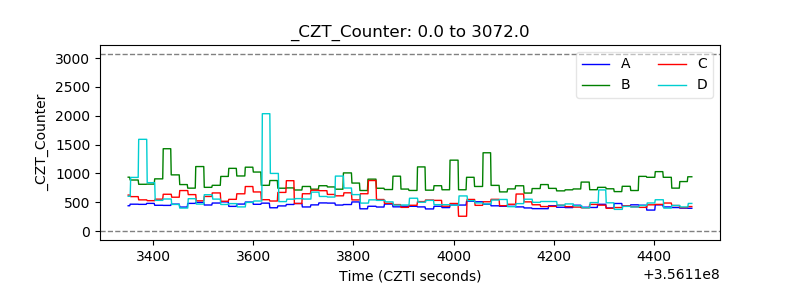 |
| +2.5 Volts monitor |  |
| +5 Volts monitor |  |
| _ROLL_ROT | 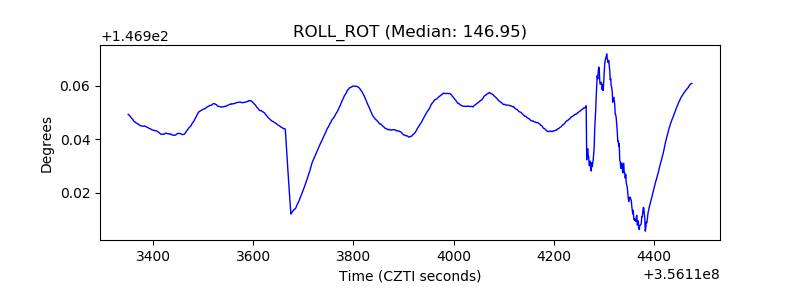 |
| _Roll_DEC | 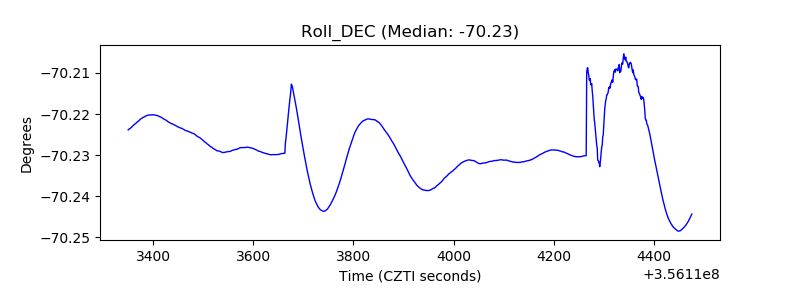 |
| _Roll_RA | 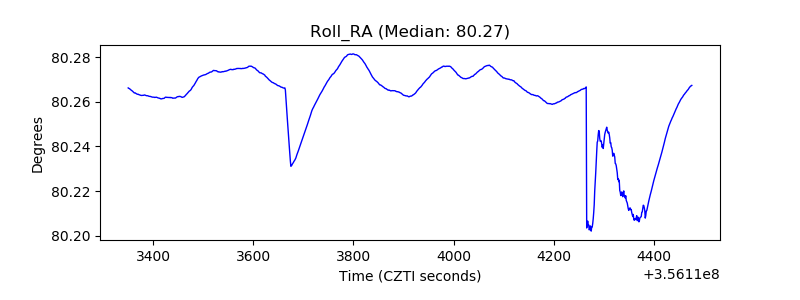 |
| Veto Counter | 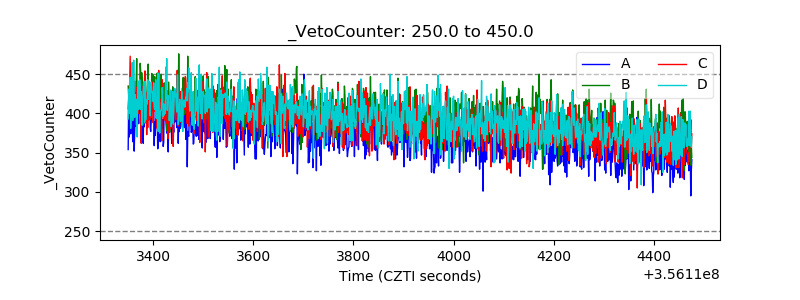 |