| Param | Original file | Final file |
|---|---|---|
| Filename | modeM0/AS1A10_071T01_9000004310cztM0_level2.fits | modeM0/AS1A10_071T01_9000004310cztM0_level2_quad_clean.evt |
| Size (bytes) | 604,748,160 | 403,508,160 |
| Size | 576.7 MB | 384.8 MB |
| Events in quadrant A | 3,870,070 | 2,205,487 |
| Events in quadrant B | 3,448,660 | 1,971,536 |
| Events in quadrant C | 3,675,524 | 2,056,805 |
| Events in quadrant D | 3,224,770 | 1,891,369 |
| Mode SS | |||
|---|---|---|---|
| Quadrant | BADHDUFLAG | Total packets | Discarded packets |
| A | 0 | 1220 | 0 |
| B | 0 | 1220 | 0 |
| C | 0 | 1220 | 0 |
| D | 0 | 1220 | 0 |
| Mode M0 | |||
|---|---|---|---|
| Quadrant | BADHDUFLAG | Total packets | Discarded packets |
| A | 0 | 125622 | 0 |
| B | 0 | 243322 | 0 |
| C | 0 | 130472 | 0 |
| D | 0 | 145194 | 0 |
| Mode M9 | |||
|---|---|---|---|
| Quadrant | BADHDUFLAG | Total packets | Discarded packets |
| A | 0 | 88 | 0 |
| B | 0 | 88 | 0 |
| C | 0 | 88 | 0 |
| D | 0 | 88 | 0 |
| Quadrant | Total seconds | Saturated seconds | Saturation percentage |
|---|---|---|---|
| A | 59639 | 725 | 1.215647% |
| B | 59639 | 8954 | 15.013666% |
| C | 59639 | 1332 | 2.233438% |
| D | 59639 | 2223 | 3.727427% |
Noise dominated data is calculated using 1-second bins in cleaned event files. If a bin has >2000 counts, and if more than 50% of those come from <1% of pixels, then it is considered to be noise-dominated and hence unusable.
| Quadrant | # 1 sec bins | Bins with >0 counts | Bins with >2000 counts | High rate bins dominated by noise | Noise dominated (total time) | Noise dominated (detector-on time) | Marked lightcurve |
|---|---|---|---|---|---|---|---|
| A | 68599 | 59639 | 0 | 0 | 0.00% | 0.00% |  |
| B | 68599 | 59635 | 0 | 0 | 0.00% | 0.00% |  |
| C | 68599 | 59637 | 0 | 0 | 0.00% | 0.00% |  |
| D | 68598 | 59578 | 0 | 0 | 0.00% | 0.00% |  |
Top three noisy pixels from each quadrant. If the there are fewer than three noisy pixels in the level2.evt file, extra rows are filled as -1
| Pixel properties | Quadrant properties | ||||||
|---|---|---|---|---|---|---|---|
| Quadrant | DetID | PixID | Counts | Sigma | Mean | Median | Sigma |
| A | 0 | 29 | 3804 | 11.66 | 1008 | 947 | 245.1 |
| A | 7 | 110 | 2983 | 8.31 | 1008 | 947 | 245.1 |
| A | 0 | 30 | 2881 | 7.89 | 1008 | 947 | 245.1 |
| B | 2 | 9 | 2722 | 10.27 | 909 | 869 | 180.4 |
| B | 3 | 17 | 2290 | 7.88 | 909 | 869 | 180.4 |
| B | 5 | 255 | 2284 | 7.84 | 909 | 869 | 180.4 |
| C | 1 | 81 | 2820 | 7.73 | 970 | 907 | 247.4 |
| C | 1 | 80 | 2758 | 7.48 | 970 | 907 | 247.4 |
| C | 12 | 241 | 2554 | 6.66 | 970 | 907 | 247.4 |
| D | 15 | 46 | 2424 | 6.47 | 920 | 838 | 245.2 |
| D | 3 | 14 | 2318 | 6.03 | 920 | 838 | 245.2 |
| D | 10 | 189 | 2295 | 5.94 | 920 | 838 | 245.2 |
Histogram calculated using DETX and DETY for each event in the final _common_clean file
| Quadrant A |  |
 |
Quadrant B |
|---|---|---|---|
| Quadrant D |  |
 |
Quadrant C |
| Plot type | Count rate plots | Images |
|---|---|---|
| Comparison with Poisson distribution Blue bars denote a histogram of data divided into 1 sec bins. Red curve is a Poisson curve with rate = median count rate of data. |
 |
 |
| Quadrant-wise count rates Data is divided into 100 sec bins |
 |
|
| Module-wise count rates for Quadrant A Data is divided into 100 sec bins |
 |
 |
| Module-wise count rates for Quadrant B Data is divided into 100 sec bins |
 |
 |
| Module-wise count rates for Quadrant C Data is divided into 100 sec bins |
 |
 |
| Module-wise count rates for Quadrant D Data is divided into 100 sec bins |
 |
 |
| Parameter | Plot |
|---|---|
| CZT HV Monitor |  |
| D_VDD | 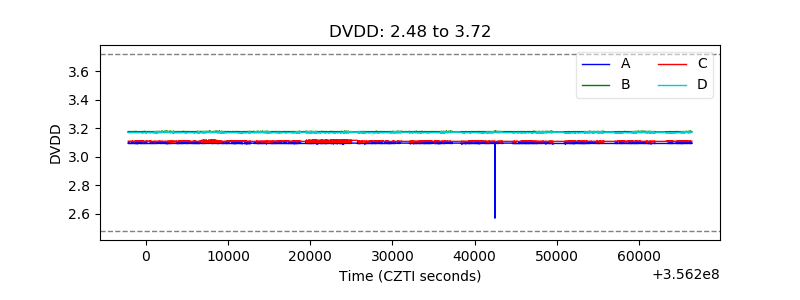 |
| Temperature 1 |  |
| Veto HV Monitor |  |
| Veto LLD |  |
| Alpha Counter |  |
| _CPM_Rate |  |
| CZT Counter |  |
| +2.5 Volts monitor |  |
| +5 Volts monitor |  |
| _ROLL_ROT |  |
| _Roll_DEC |  |
| _Roll_RA |  |
| Veto Counter |  |