| Param | Original file | Final file |
|---|---|---|
| Filename | modeM0/AS1A10_071T01_9000004310_29997cztM0_level2.evt | modeM0/AS1A10_071T01_9000004310_29997cztM0_level2_quad_clean.evt |
| Size (bytes) | 656,867,520 | 108,676,800 |
| Size | 626.4 MB | 103.6 MB |
| Events in quadrant A | 4,103,901 | 705,927 |
| Events in quadrant B | 6,198,508 | 696,324 |
| Events in quadrant C | 4,217,689 | 669,800 |
| Events in quadrant D | 4,834,623 | 666,378 |
| Mode SS | |||
|---|---|---|---|
| Quadrant | BADHDUFLAG | Total packets | Discarded packets |
| A | 0 | 166 | 0 |
| B | 0 | 166 | 0 |
| C | 0 | 166 | 0 |
| D | 0 | 166 | 0 |
| Mode M0 | |||
|---|---|---|---|
| Quadrant | BADHDUFLAG | Total packets | Discarded packets |
| A | 0 | 17228 | 2 |
| B | 0 | 24548 | 2 |
| C | 0 | 17503 | 2 |
| D | 0 | 19267 | 2 |
| Mode M9 | |||
|---|---|---|---|
| Quadrant | BADHDUFLAG | Total packets | Discarded packets |
| A | 0 | 3 | 0 |
| B | 0 | 3 | 0 |
| C | 0 | 3 | 0 |
| D | 0 | 3 | 0 |
| Quadrant | Total seconds | Saturated seconds | Saturation percentage |
|---|---|---|---|
| A | 7938 | 345 | 4.346183% |
| B | 7938 | 569 | 7.168052% |
| C | 7938 | 476 | 5.996473% |
| D | 7938 | 431 | 5.429579% |
Noise dominated data is calculated using 1-second bins in cleaned event files. If a bin has >2000 counts, and if more than 50% of those come from <1% of pixels, then it is considered to be noise-dominated and hence unusable.
| Quadrant | # 1 sec bins | Bins with >0 counts | Bins with >2000 counts | High rate bins dominated by noise | Noise dominated (total time) | Noise dominated (detector-on time) | Marked lightcurve |
|---|---|---|---|---|---|---|---|
| A | 8323 | 7940 | 0 | 0 | 0.00% | 0.00% | 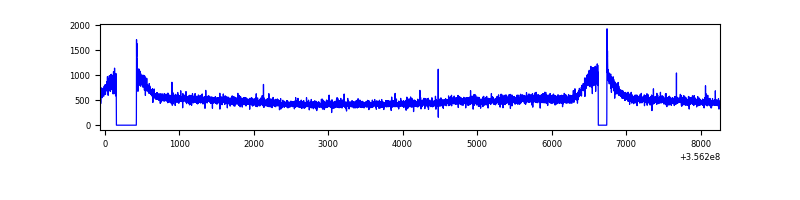 |
| B | 8323 | 7940 | 3 | 3 | 0.04% | 0.04% | 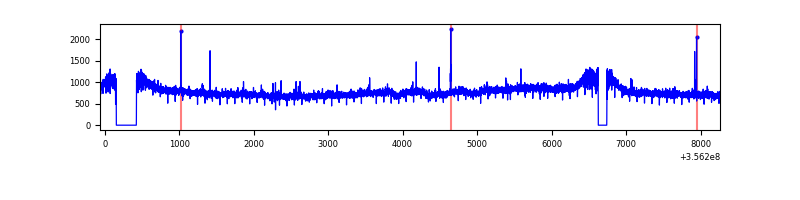 |
| C | 8323 | 7940 | 5 | 5 | 0.06% | 0.06% |  |
| D | 8323 | 7940 | 128 | 128 | 1.54% | 1.61% | 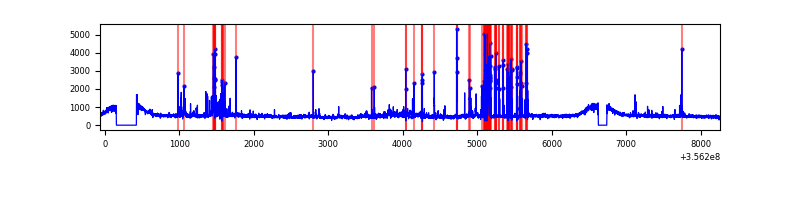 |
Top three noisy pixels from each quadrant. If the there are fewer than three noisy pixels in the level2.evt file, extra rows are filled as -1
| Pixel properties | Quadrant properties | ||||||
|---|---|---|---|---|---|---|---|
| Quadrant | DetID | PixID | Counts | Sigma | Mean | Median | Sigma |
| A | 8 | 192 | 18600 | 81.26 | 1056 | 1031 | 216.2 |
| A | 13 | 254 | 14666 | 63.06 | 1056 | 1031 | 216.2 |
| A | 3 | 1 | 13769 | 58.91 | 1056 | 1031 | 216.2 |
| B | 6 | 159 | 2132683 | 10546.43 | 1022 | 993 | 202.1 |
| B | 12 | 111 | 25999 | 123.71 | 1022 | 993 | 202.1 |
| B | 11 | 111 | 23987 | 113.76 | 1022 | 993 | 202.1 |
| C | 14 | 238 | 157588 | 654.64 | 1002 | 1004 | 239.2 |
| C | 3 | 233 | 135330 | 561.58 | 1002 | 1004 | 239.2 |
| C | 2 | 114 | 19084 | 75.59 | 1002 | 1004 | 239.2 |
| D | 7 | 80 | 750401 | 2804.52 | 1014 | 995 | 267.2 |
| D | 8 | 195 | 155049 | 576.52 | 1014 | 995 | 267.2 |
| D | 2 | 234 | 36962 | 134.6 | 1014 | 995 | 267.2 |
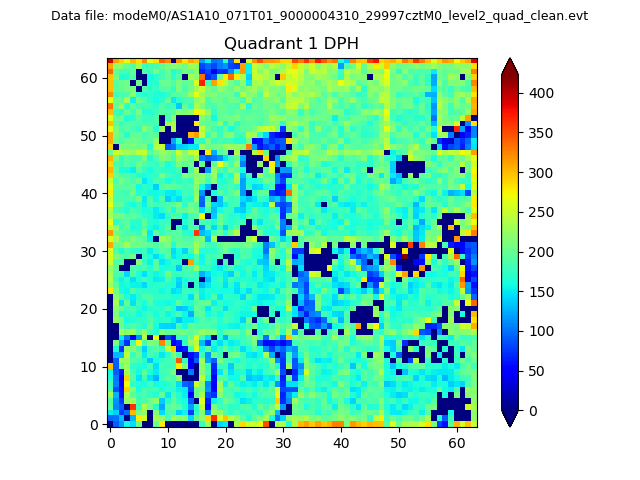
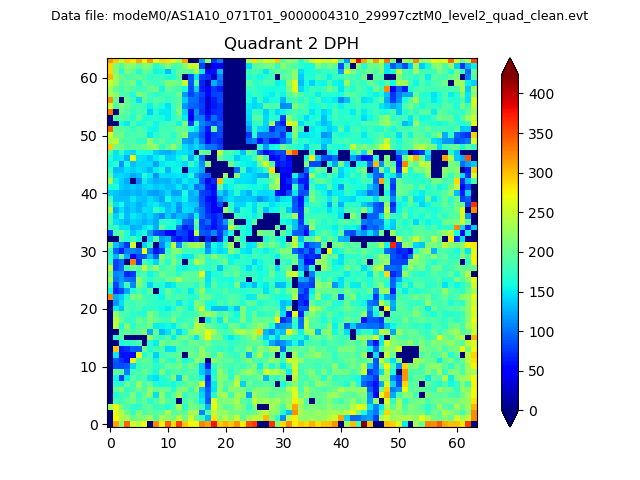
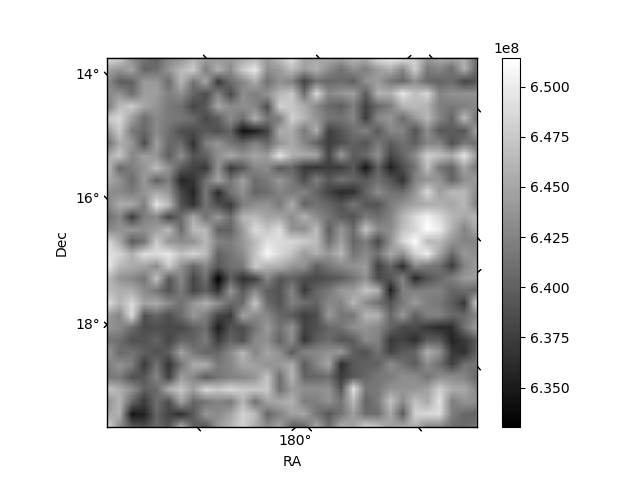
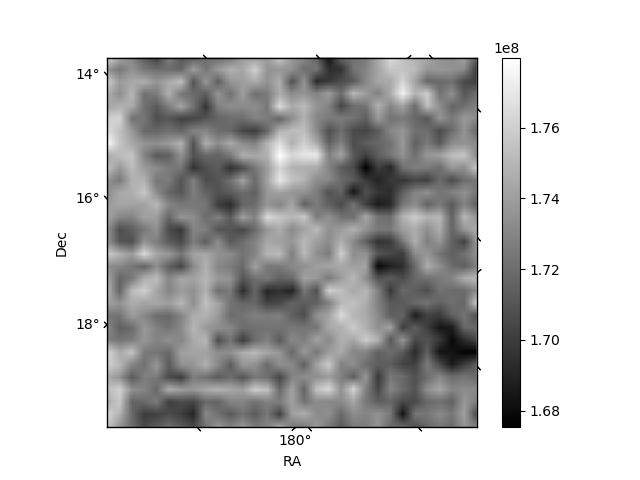
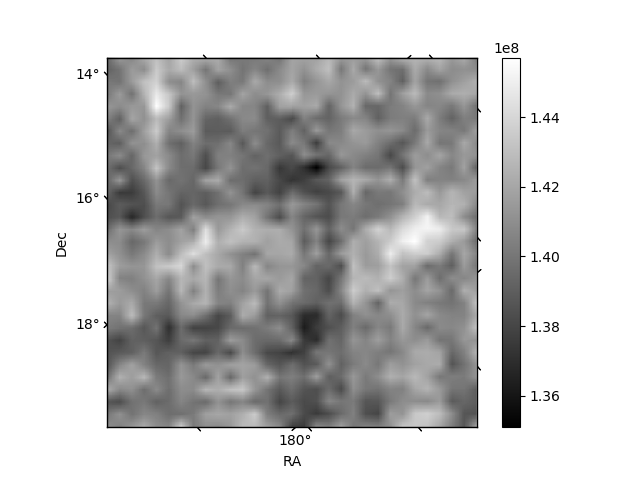
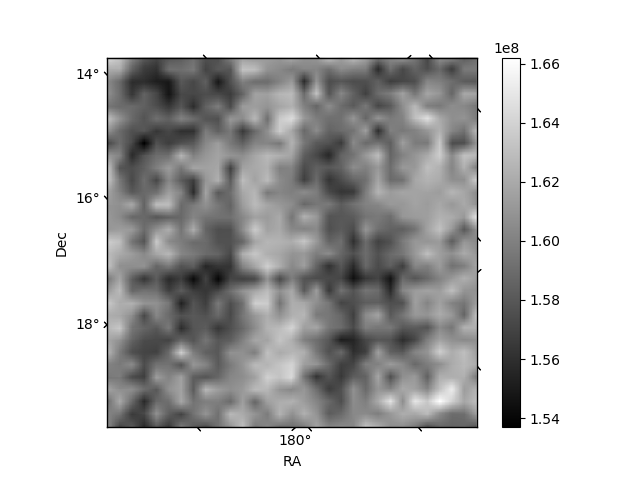
Histogram calculated using DETX and DETY for each event in the final _common_clean file
| Quadrant A | 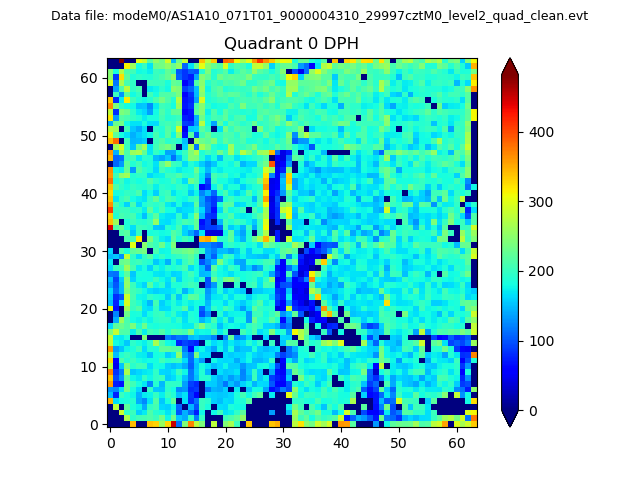 |
 |
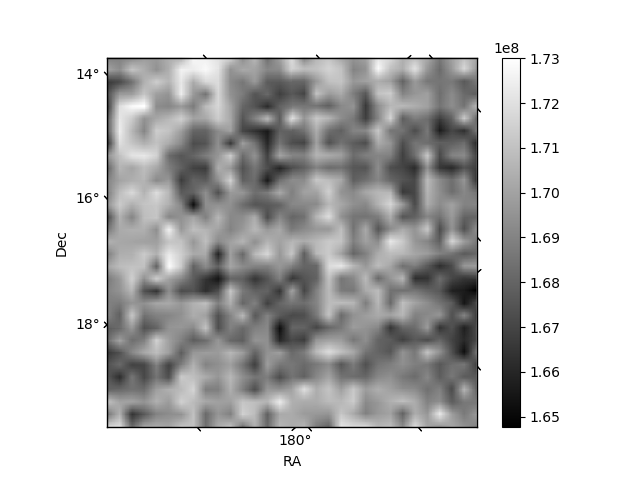
Quadrant B |
|---|---|---|---|
| Quadrant D | 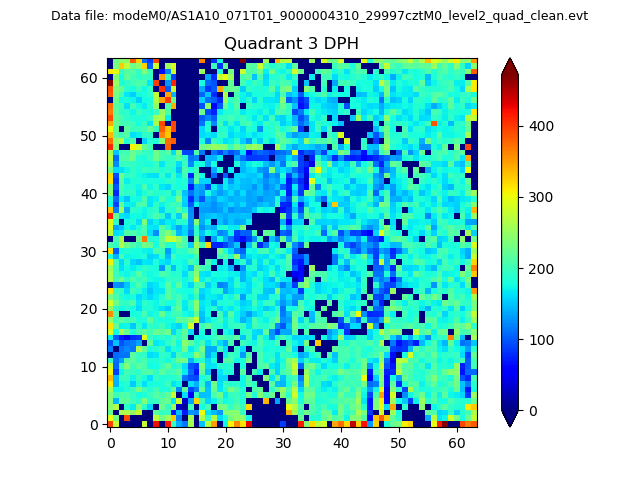 |
 |
Quadrant C |
| Plot type | Count rate plots | Images |
|---|---|---|
| Comparison with Poisson distribution Blue bars denote a histogram of data divided into 1 sec bins. Red curve is a Poisson curve with rate = median count rate of data. |
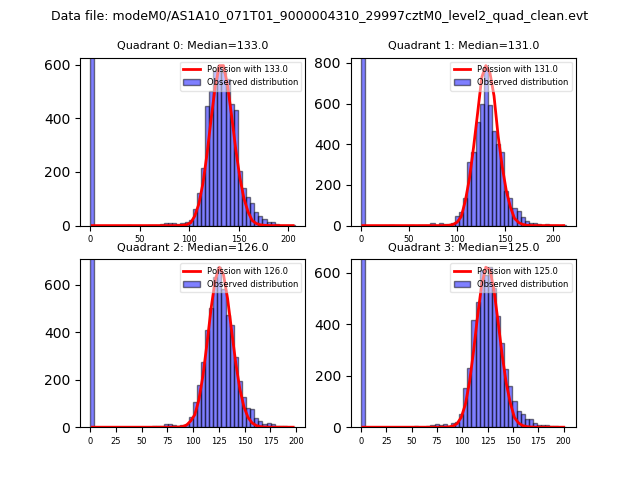 |
 |
| Quadrant-wise count rates Data is divided into 100 sec bins |
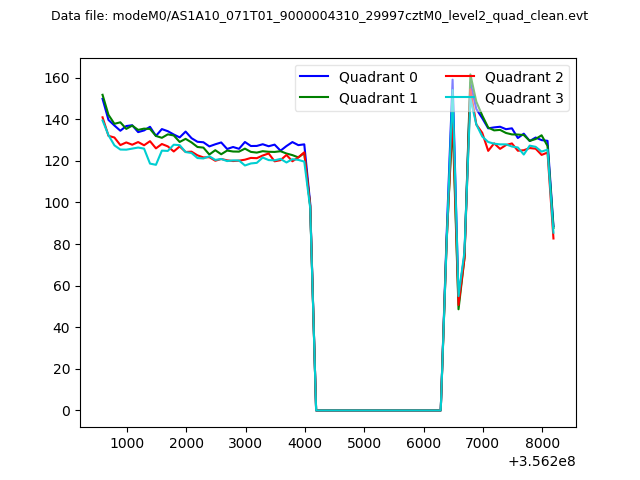 |
|
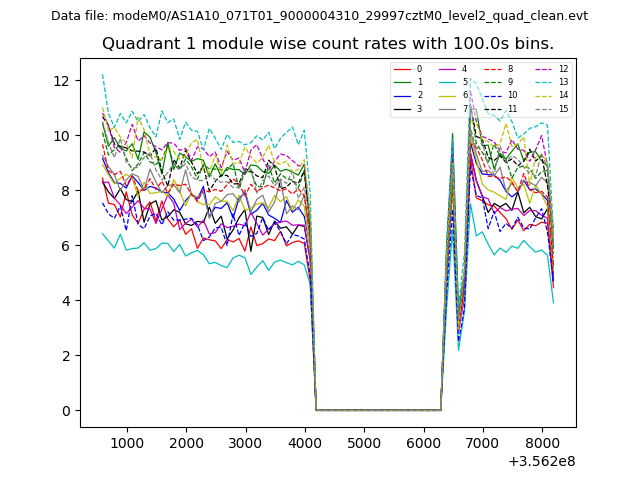
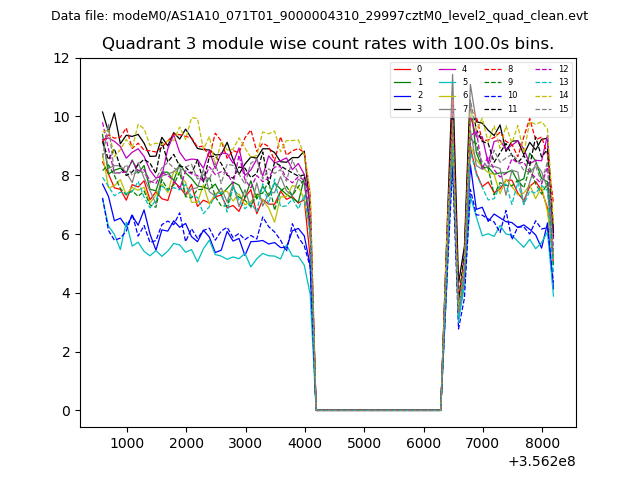
| Module-wise count rates for Quadrant A Data is divided into 100 sec bins |
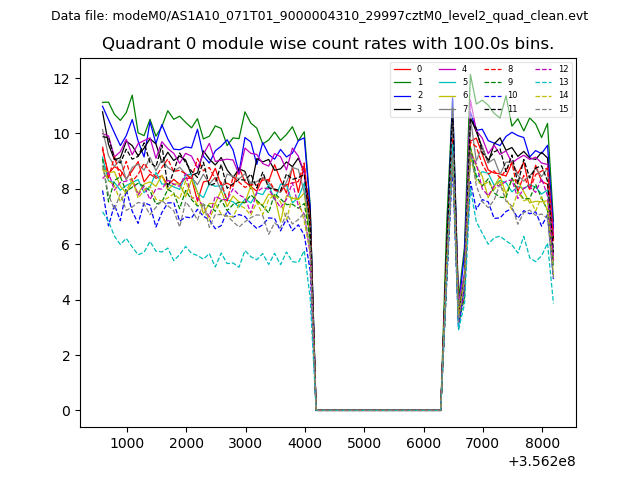 |
 |
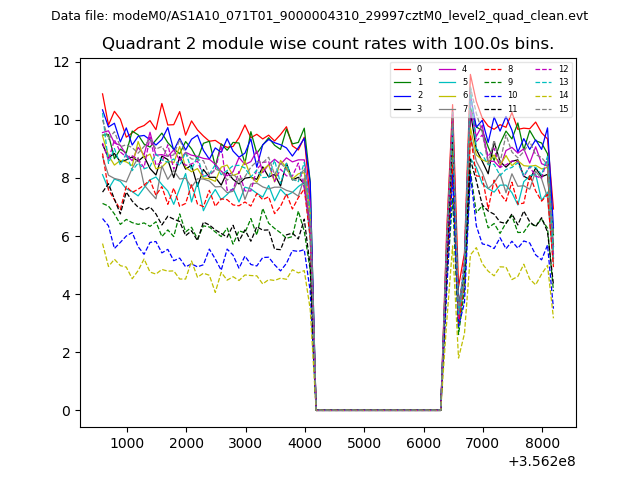
| Module-wise count rates for Quadrant B Data is divided into 100 sec bins |
 |
 |
| Module-wise count rates for Quadrant C Data is divided into 100 sec bins |
 |
 |
| Module-wise count rates for Quadrant D Data is divided into 100 sec bins |
 |
 |
| Parameter | Plot |
|---|---|
| CZT HV Monitor | 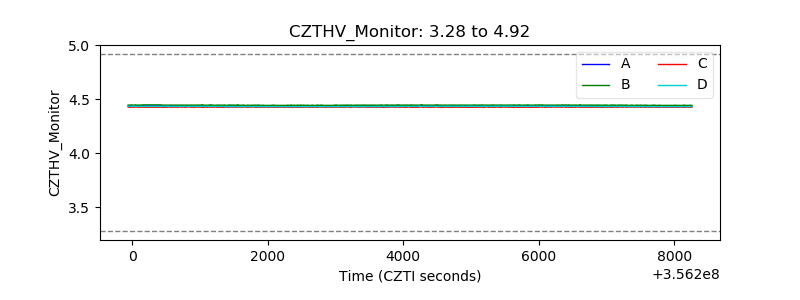 |
| D_VDD | 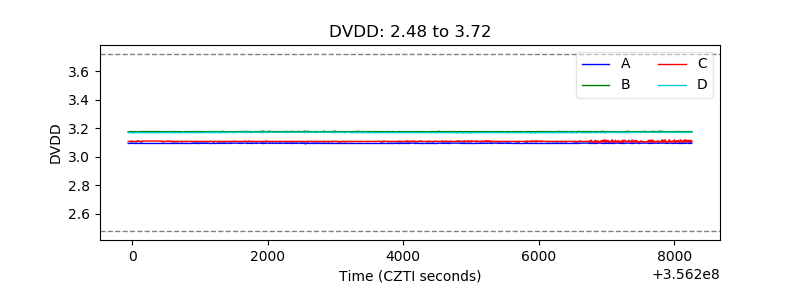 |
| Temperature 1 | 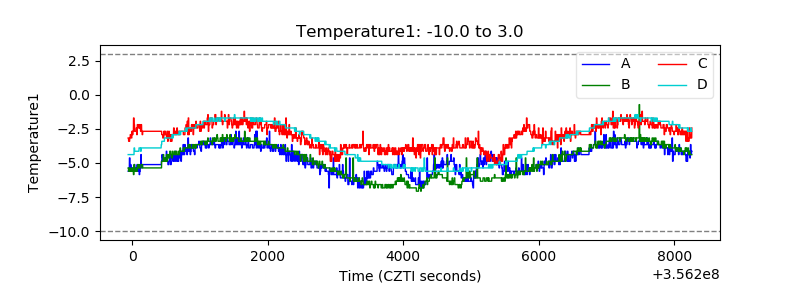 |
| Veto HV Monitor | 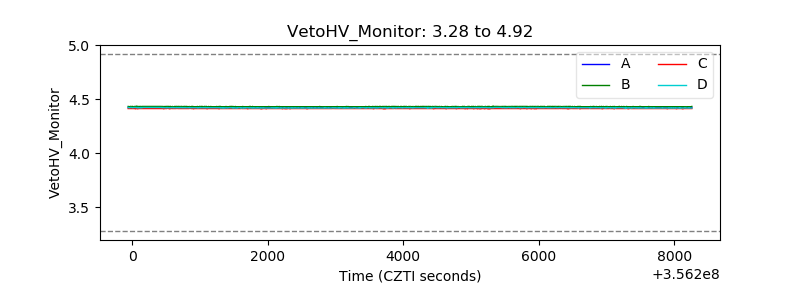 |
| Veto LLD | 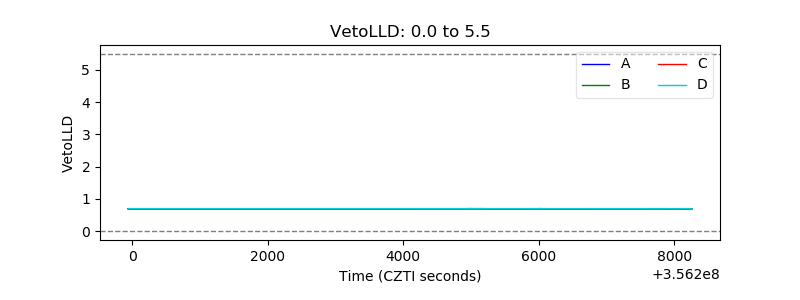 |
| Alpha Counter | 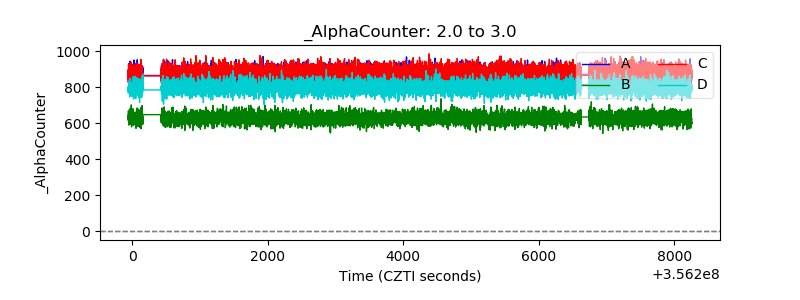 |
| _CPM_Rate | 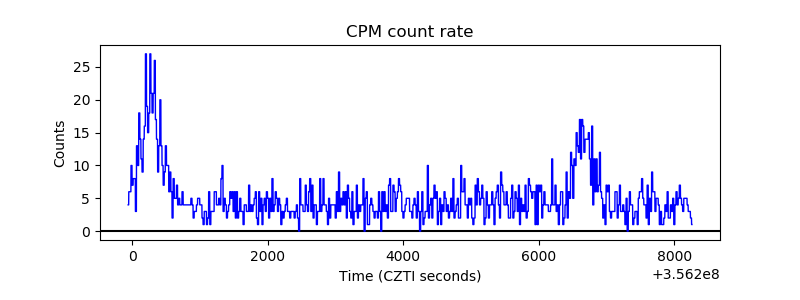 |
| CZT Counter | 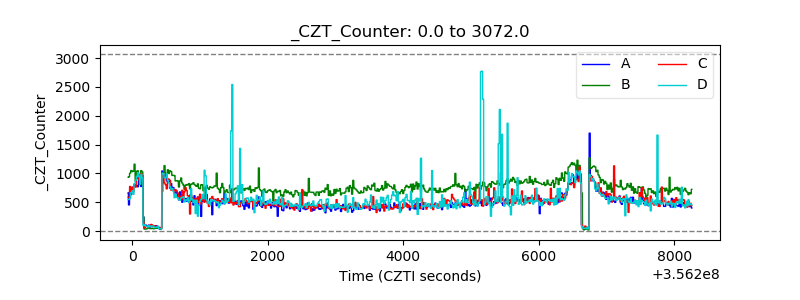 |
| +2.5 Volts monitor |  |
| +5 Volts monitor |  |
| _ROLL_ROT | 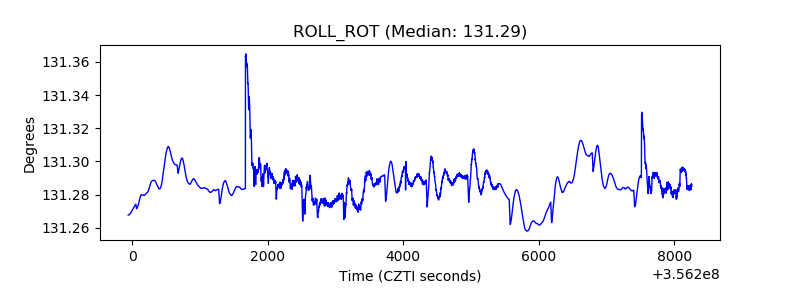 |
| _Roll_DEC | 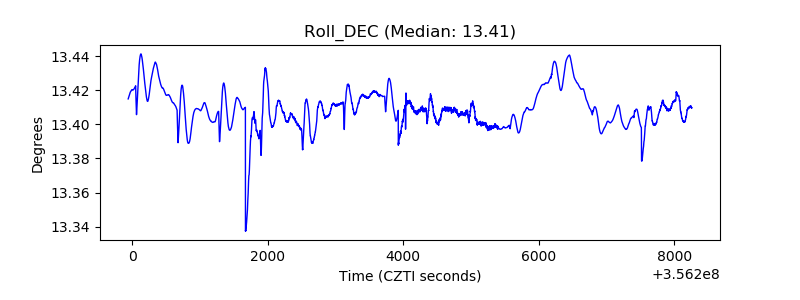 |
| _Roll_RA | 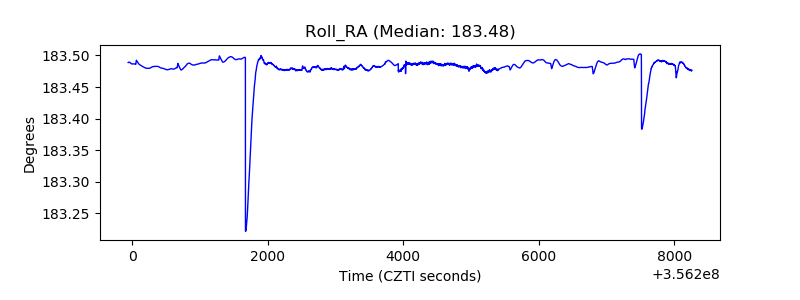 |
| Veto Counter | 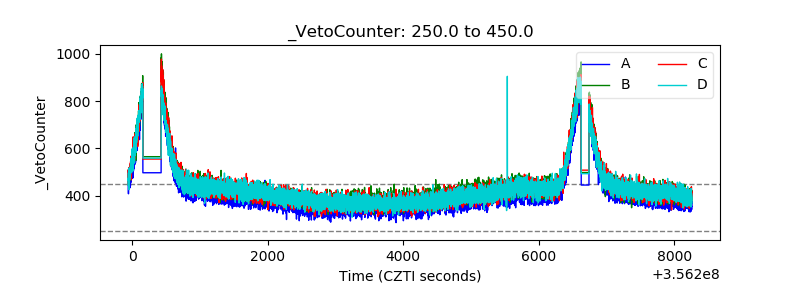 |