| Param | Original file | Final file |
|---|---|---|
| Filename | modeM0/AS1A10_071T01_9000004310_29998cztM0_level2.evt | modeM0/AS1A10_071T01_9000004310_29998cztM0_level2_quad_clean.evt |
| Size (bytes) | 598,190,400 | 108,538,560 |
| Size | 570.5 MB | 103.5 MB |
| Events in quadrant A | 3,766,149 | 705,157 |
| Events in quadrant B | 5,819,565 | 702,084 |
| Events in quadrant C | 3,970,891 | 675,405 |
| Events in quadrant D | 4,041,398 | 672,126 |
| Mode SS | |||
|---|---|---|---|
| Quadrant | BADHDUFLAG | Total packets | Discarded packets |
| A | 0 | 158 | 0 |
| B | 0 | 158 | 0 |
| C | 0 | 158 | 0 |
| D | 0 | 158 | 0 |
| Mode M0 | |||
|---|---|---|---|
| Quadrant | BADHDUFLAG | Total packets | Discarded packets |
| A | 0 | 16147 | 2 |
| B | 0 | 23316 | 2 |
| C | 0 | 16594 | 2 |
| D | 0 | 17149 | 2 |
| Mode M9 | |||
|---|---|---|---|
| Quadrant | BADHDUFLAG | Total packets | Discarded packets |
| A | 0 | 4 | 0 |
| B | 0 | 4 | 0 |
| C | 0 | 4 | 0 |
| D | 0 | 4 | 0 |
| Quadrant | Total seconds | Saturated seconds | Saturation percentage |
|---|---|---|---|
| A | 7645 | 177 | 2.315239% |
| B | 7646 | 273 | 3.570494% |
| C | 7646 | 259 | 3.387392% |
| D | 7645 | 146 | 1.909745% |
Noise dominated data is calculated using 1-second bins in cleaned event files. If a bin has >2000 counts, and if more than 50% of those come from <1% of pixels, then it is considered to be noise-dominated and hence unusable.
| Quadrant | # 1 sec bins | Bins with >0 counts | Bins with >2000 counts | High rate bins dominated by noise | Noise dominated (total time) | Noise dominated (detector-on time) | Marked lightcurve |
|---|---|---|---|---|---|---|---|
| A | 8120 | 7647 | 0 | 0 | 0.00% | 0.00% | 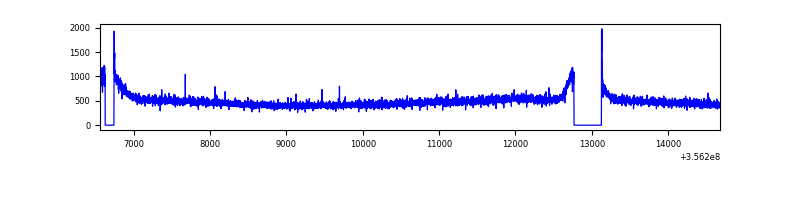 |
| B | 8121 | 7648 | 1 | 1 | 0.01% | 0.01% | 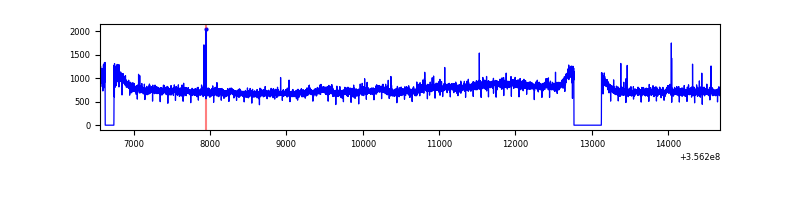 |
| C | 8121 | 7648 | 5 | 5 | 0.06% | 0.07% | 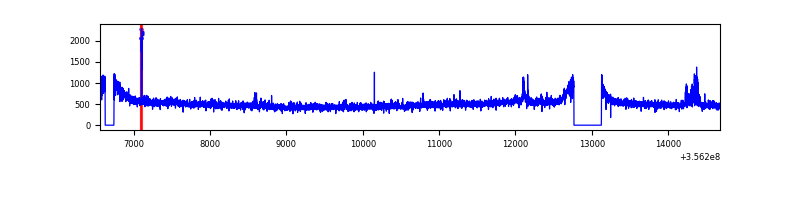 |
| D | 8120 | 7647 | 16 | 16 | 0.20% | 0.21% |  |
Top three noisy pixels from each quadrant. If the there are fewer than three noisy pixels in the level2.evt file, extra rows are filled as -1
| Pixel properties | Quadrant properties | ||||||
|---|---|---|---|---|---|---|---|
| Quadrant | DetID | PixID | Counts | Sigma | Mean | Median | Sigma |
| A | 8 | 192 | 21548 | 103.89 | 969 | 947 | 198.3 |
| A | 13 | 254 | 13518 | 63.39 | 969 | 947 | 198.3 |
| A | 3 | 137 | 10280 | 47.06 | 969 | 947 | 198.3 |
| B | 6 | 159 | 2052892 | 11046.37 | 947 | 925 | 185.8 |
| B | 12 | 111 | 23424 | 121.12 | 947 | 925 | 185.8 |
| B | 11 | 111 | 21630 | 111.46 | 947 | 925 | 185.8 |
| C | 3 | 233 | 192604 | 867.15 | 926 | 930 | 221.0 |
| C | 14 | 238 | 149009 | 669.92 | 926 | 930 | 221.0 |
| C | 2 | 114 | 18211 | 78.18 | 926 | 930 | 221.0 |
| D | 8 | 195 | 249143 | 1001.74 | 937 | 921 | 247.8 |
| D | 7 | 80 | 127465 | 510.69 | 937 | 921 | 247.8 |
| D | 13 | 249 | 56072 | 222.57 | 937 | 921 | 247.8 |
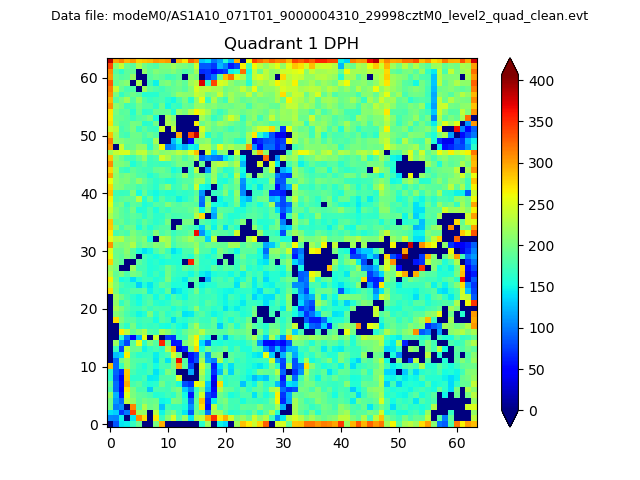
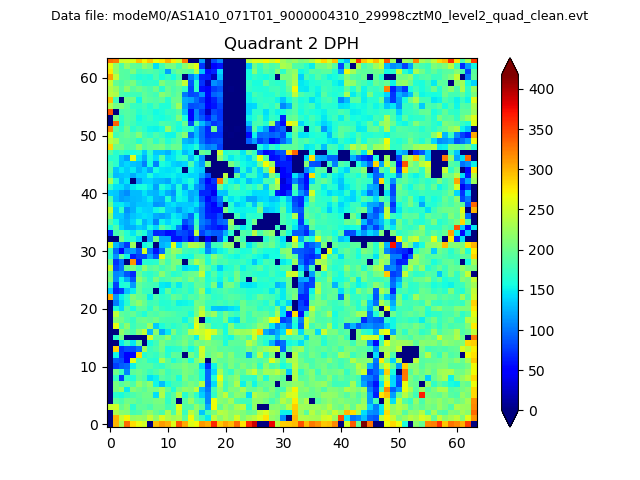
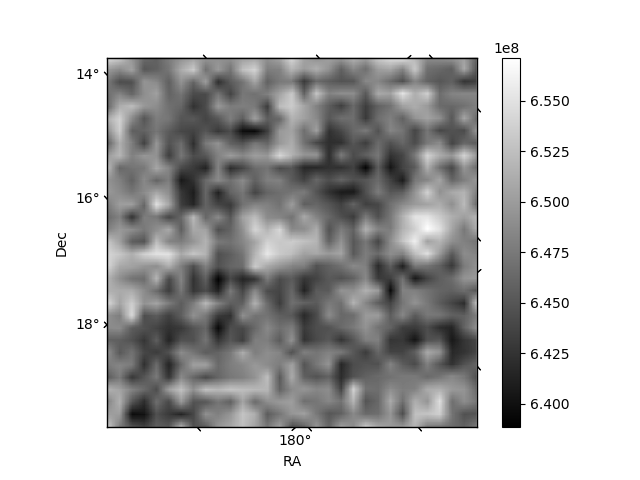
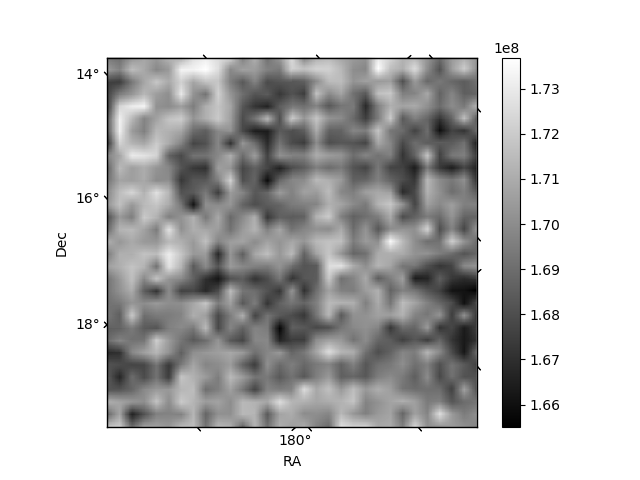
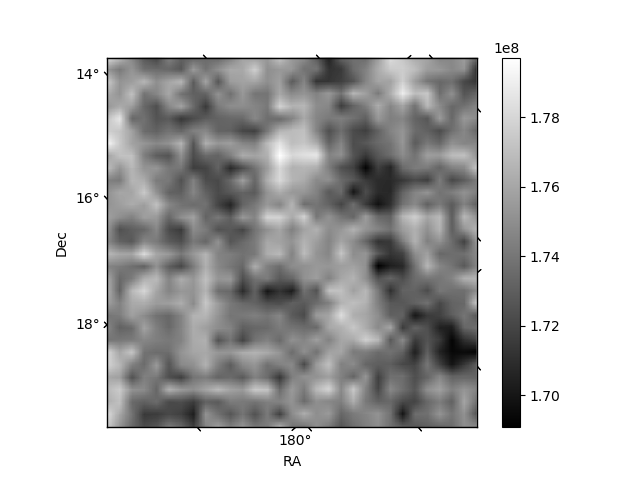
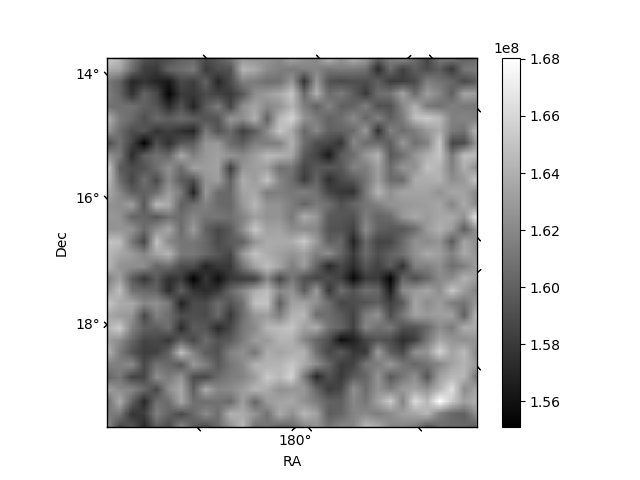
Histogram calculated using DETX and DETY for each event in the final _common_clean file
| Quadrant A | 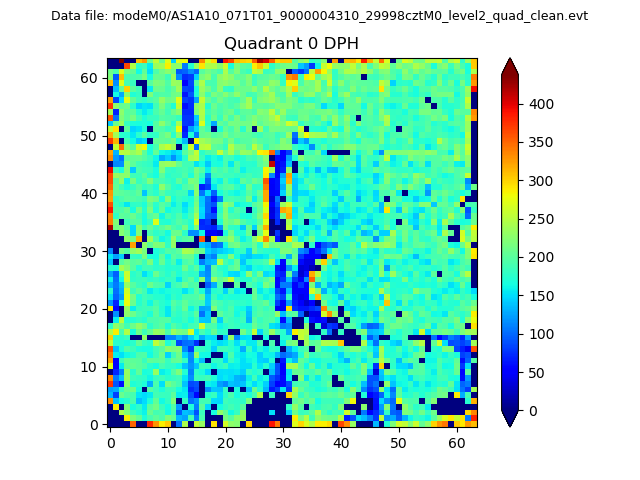 |
 |
Quadrant B |
|---|---|---|---|
| Quadrant D | 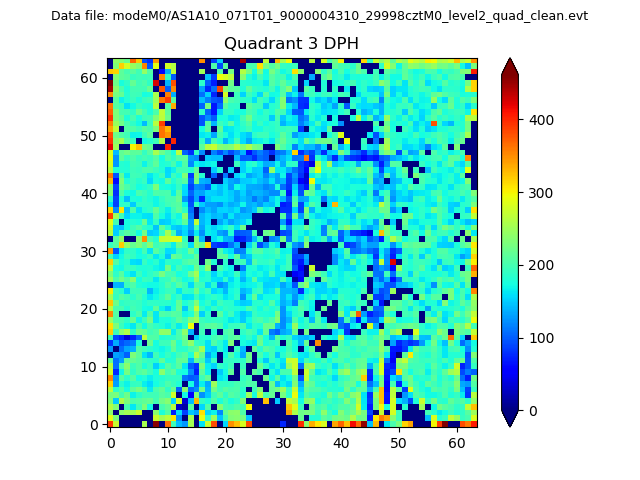 |
 |
Quadrant C |
| Plot type | Count rate plots | Images |
|---|---|---|
| Comparison with Poisson distribution Blue bars denote a histogram of data divided into 1 sec bins. Red curve is a Poisson curve with rate = median count rate of data. |
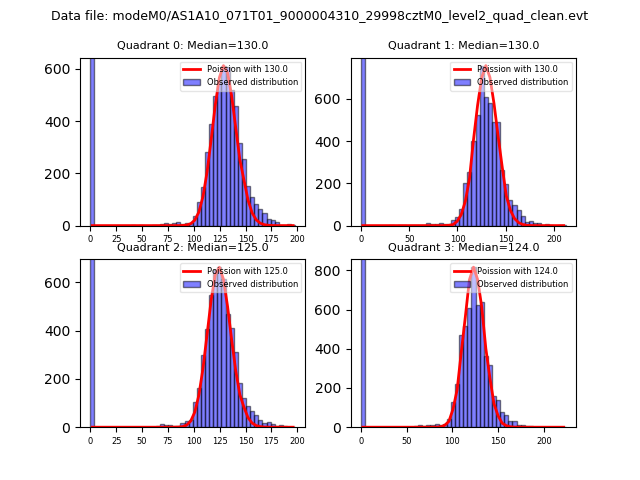 |
 |
| Quadrant-wise count rates Data is divided into 100 sec bins |
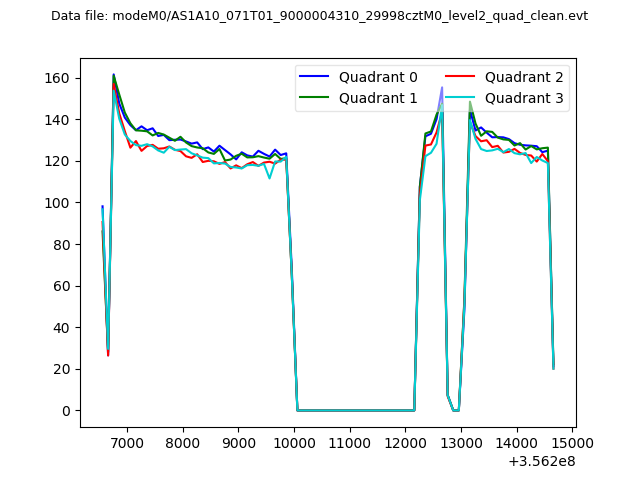 |
|
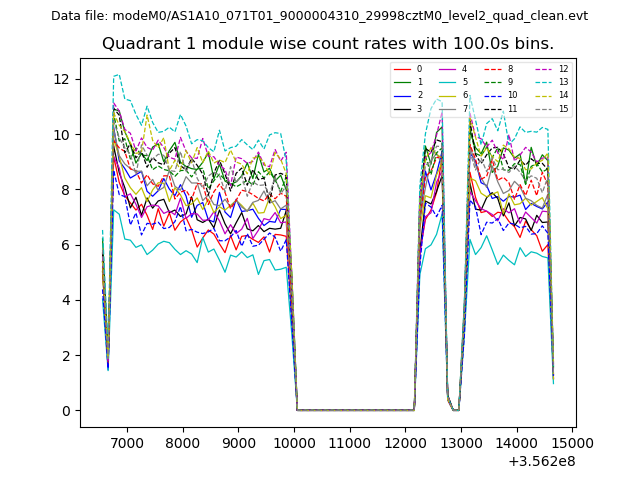
| Module-wise count rates for Quadrant A Data is divided into 100 sec bins |
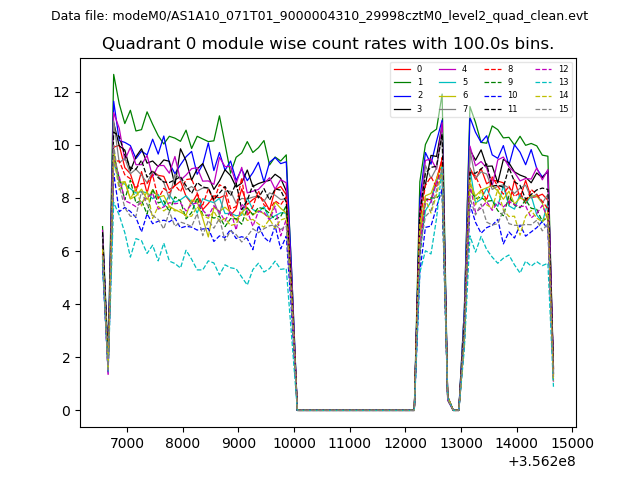 |
 |
| Module-wise count rates for Quadrant B Data is divided into 100 sec bins |
 |
 |
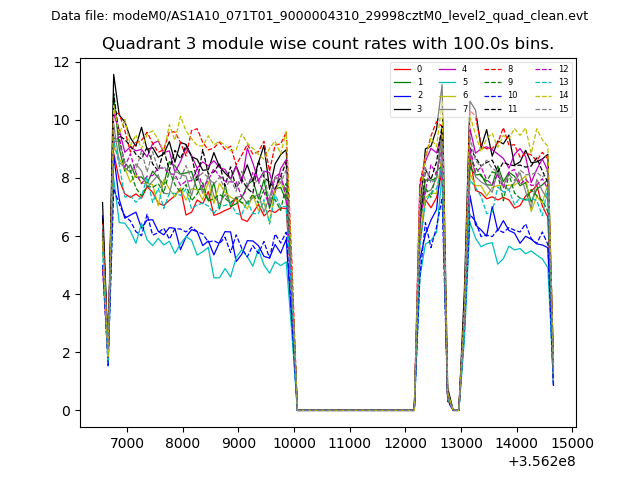
| Module-wise count rates for Quadrant C Data is divided into 100 sec bins |
 |
 |
| Module-wise count rates for Quadrant D Data is divided into 100 sec bins |
 |
 |
| Parameter | Plot |
|---|---|
| CZT HV Monitor |  |
| D_VDD | 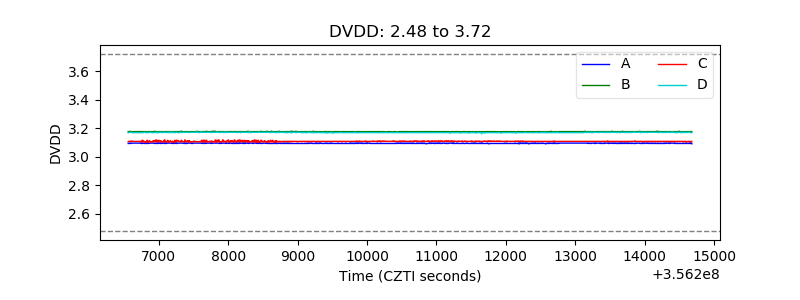 |
| Temperature 1 | 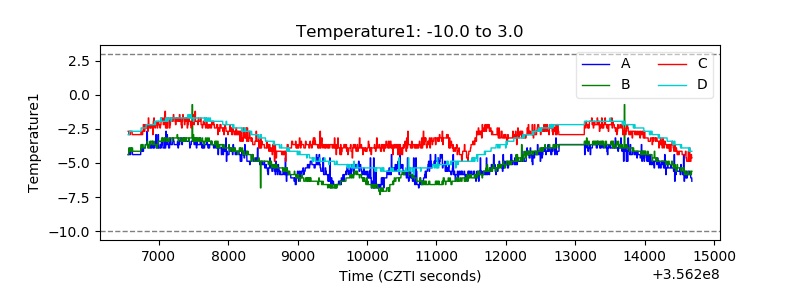 |
| Veto HV Monitor | 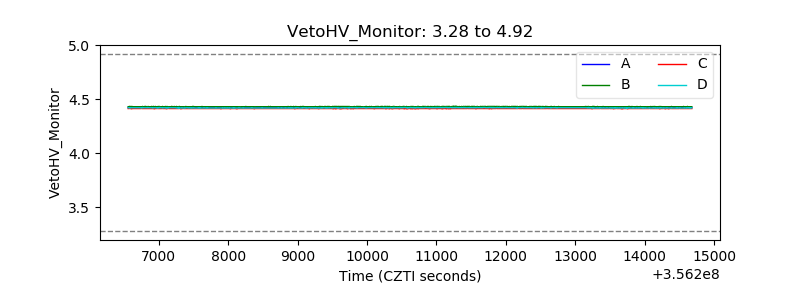 |
| Veto LLD | 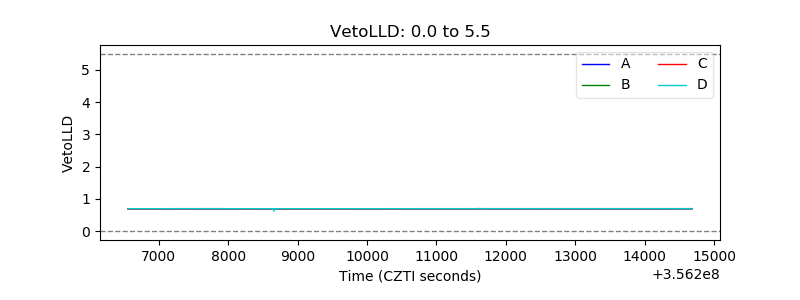 |
| Alpha Counter | 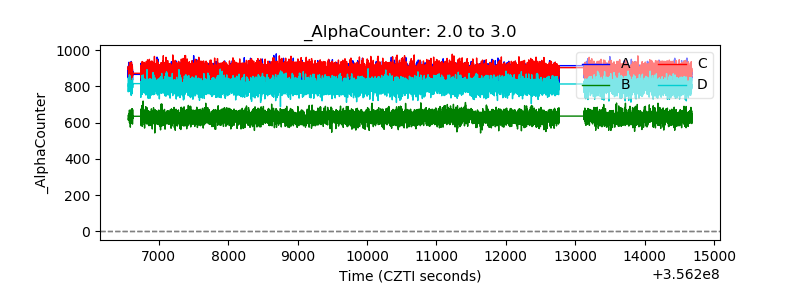 |
| _CPM_Rate | 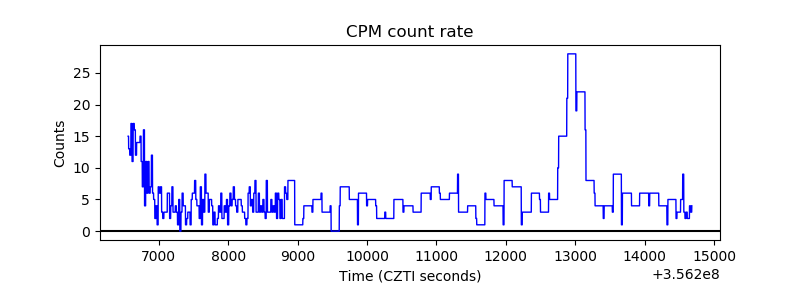 |
| CZT Counter | 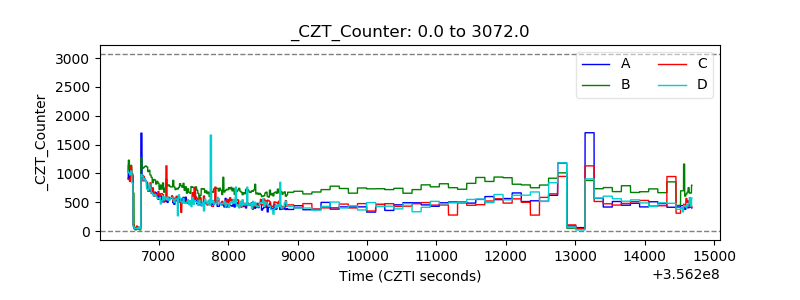 |
| +2.5 Volts monitor |  |
| +5 Volts monitor |  |
| _ROLL_ROT |  |
| _Roll_DEC | 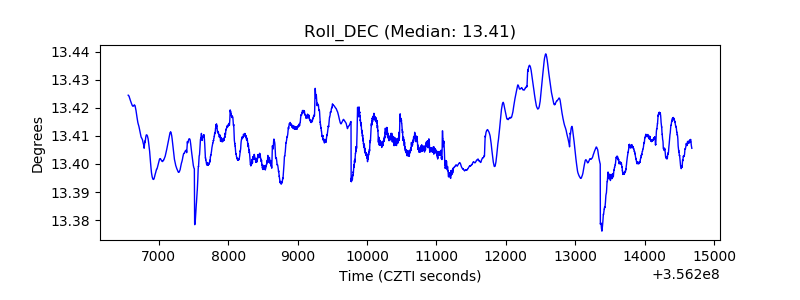 |
| _Roll_RA | 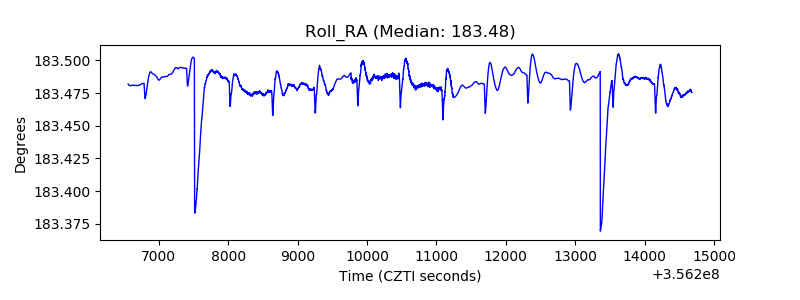 |
| Veto Counter | 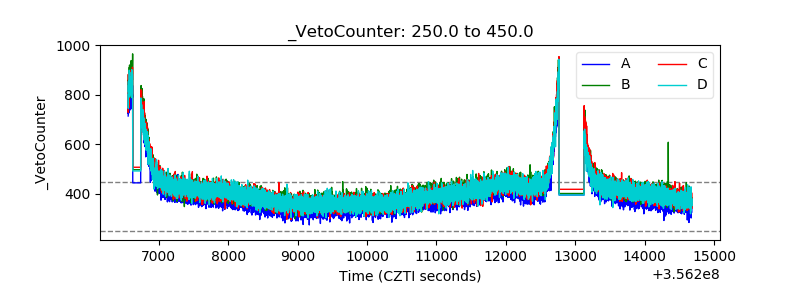 |