| Param | Original file | Final file |
|---|---|---|
| Filename | modeM0/AS1A10_071T01_9000004310_30000cztM0_level2.evt | modeM0/AS1A10_071T01_9000004310_30000cztM0_level2_quad_clean.evt |
| Size (bytes) | 1,069,041,600 | 168,235,200 |
| Size | 1019.5 MB | 160.4 MB |
| Events in quadrant A | 6,074,457 | 1,088,475 |
| Events in quadrant B | 11,541,070 | 1,053,370 |
| Events in quadrant C | 6,397,854 | 1,047,966 |
| Events in quadrant D | 7,491,833 | 1,013,623 |
| Mode SS | |||
|---|---|---|---|
| Quadrant | BADHDUFLAG | Total packets | Discarded packets |
| A | 0 | 264 | 0 |
| B | 0 | 264 | 0 |
| C | 0 | 264 | 0 |
| D | 0 | 264 | 0 |
| Mode M0 | |||
|---|---|---|---|
| Quadrant | BADHDUFLAG | Total packets | Discarded packets |
| A | 0 | 26602 | 3 |
| B | 0 | 43845 | 5 |
| C | 0 | 27160 | 3 |
| D | 0 | 30939 | 3 |
| Mode M9 | |||
|---|---|---|---|
| Quadrant | BADHDUFLAG | Total packets | Discarded packets |
| A | 0 | 14 | 0 |
| B | 0 | 15 | 0 |
| C | 0 | 15 | 0 |
| D | 0 | 15 | 0 |
| Quadrant | Total seconds | Saturated seconds | Saturation percentage |
|---|---|---|---|
| A | 12897 | 84 | 0.651314% |
| B | 12896 | 867 | 6.723015% |
| C | 12896 | 184 | 1.426799% |
| D | 12896 | 502 | 3.892680% |
Noise dominated data is calculated using 1-second bins in cleaned event files. If a bin has >2000 counts, and if more than 50% of those come from <1% of pixels, then it is considered to be noise-dominated and hence unusable.
| Quadrant | # 1 sec bins | Bins with >0 counts | Bins with >2000 counts | High rate bins dominated by noise | Noise dominated (total time) | Noise dominated (detector-on time) | Marked lightcurve |
|---|---|---|---|---|---|---|---|
| A | 14137 | 12900 | 2 | 2 | 0.01% | 0.02% | 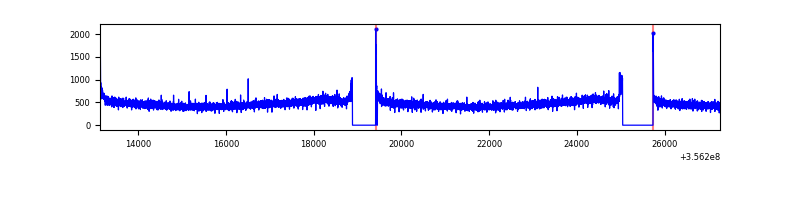 |
| B | 14136 | 12899 | 454 | 454 | 3.21% | 3.52% | 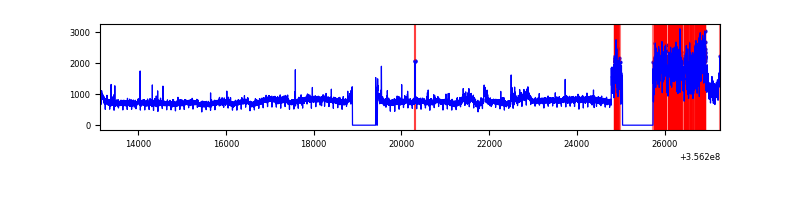 |
| C | 14136 | 12899 | 0 | 0 | 0.00% | 0.00% | 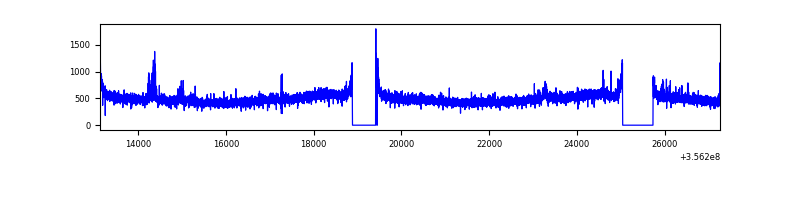 |
| D | 14136 | 12898 | 324 | 324 | 2.29% | 2.51% | 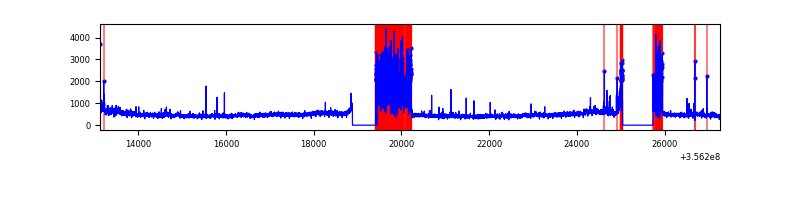 |
Top three noisy pixels from each quadrant. If the there are fewer than three noisy pixels in the level2.evt file, extra rows are filled as -1
| Pixel properties | Quadrant properties | ||||||
|---|---|---|---|---|---|---|---|
| Quadrant | DetID | PixID | Counts | Sigma | Mean | Median | Sigma |
| A | 8 | 192 | 38107 | 116.13 | 1563 | 1526 | 315.0 |
| A | 13 | 254 | 24172 | 71.89 | 1563 | 1526 | 315.0 |
| A | 3 | 137 | 16074 | 46.18 | 1563 | 1526 | 315.0 |
| B | 6 | 159 | 3561009 | 12163.16 | 1518 | 1478 | 292.6 |
| B | 6 | 36 | 1972368 | 6734.67 | 1518 | 1478 | 292.6 |
| B | 12 | 111 | 37630 | 123.53 | 1518 | 1478 | 292.6 |
| C | 3 | 233 | 251636 | 707.6 | 1498 | 1506 | 353.5 |
| C | 14 | 238 | 249394 | 701.26 | 1498 | 1506 | 353.5 |
| C | 2 | 114 | 30537 | 82.13 | 1498 | 1506 | 353.5 |
| D | 7 | 80 | 1370482 | 3623.18 | 1482 | 1446 | 377.9 |
| D | 8 | 195 | 355755 | 937.69 | 1482 | 1446 | 377.9 |
| D | 2 | 234 | 51883 | 133.48 | 1482 | 1446 | 377.9 |
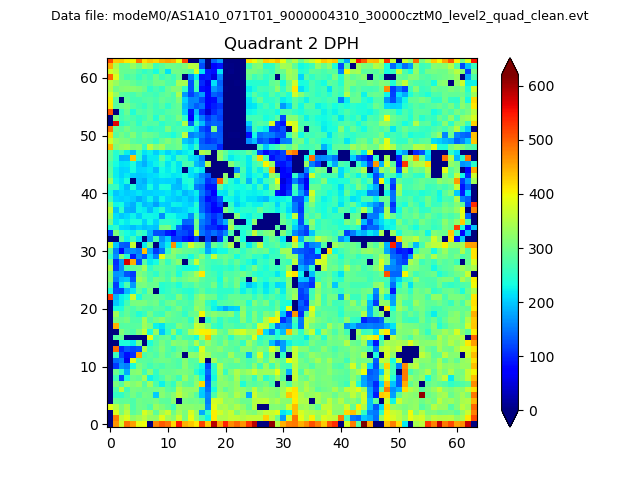
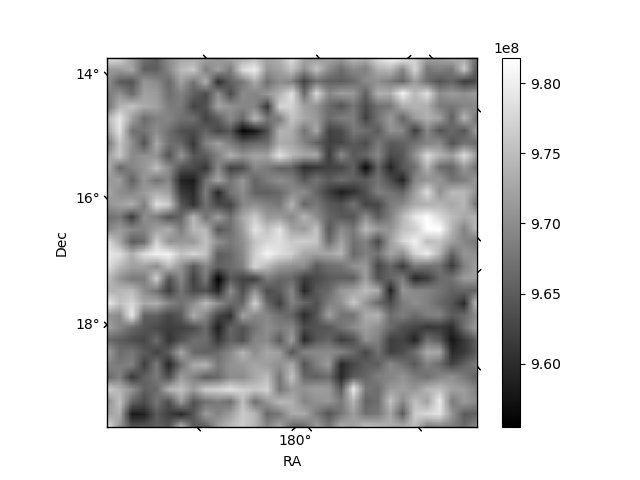
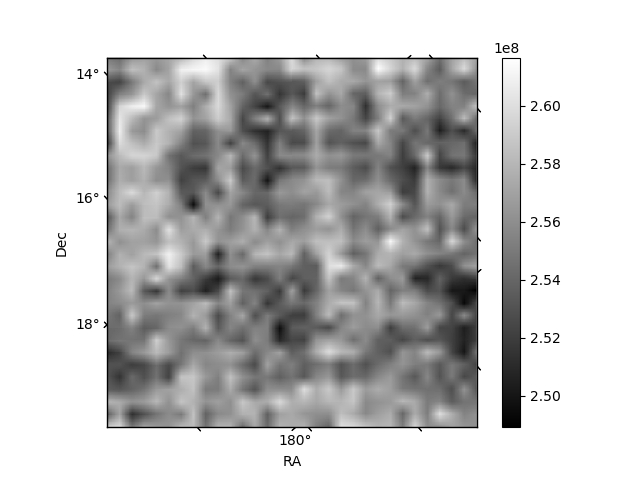
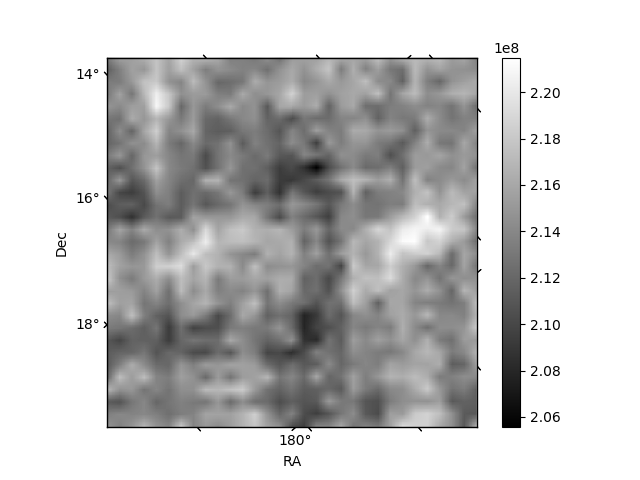
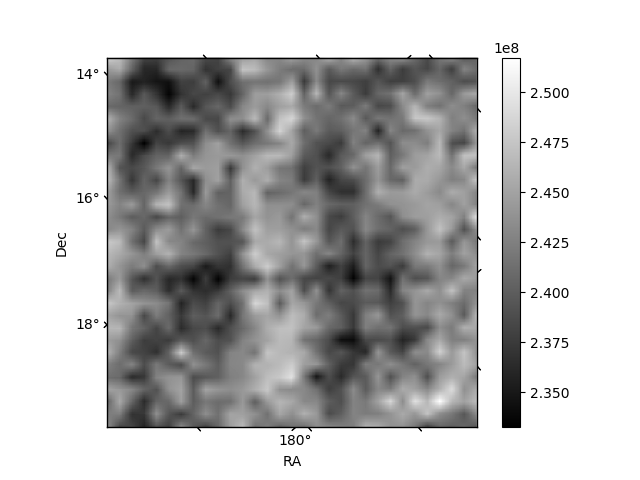
Histogram calculated using DETX and DETY for each event in the final _common_clean file
| Quadrant A | 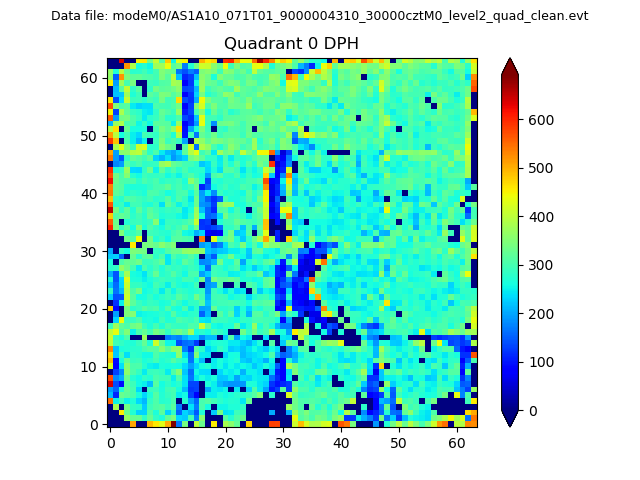 |
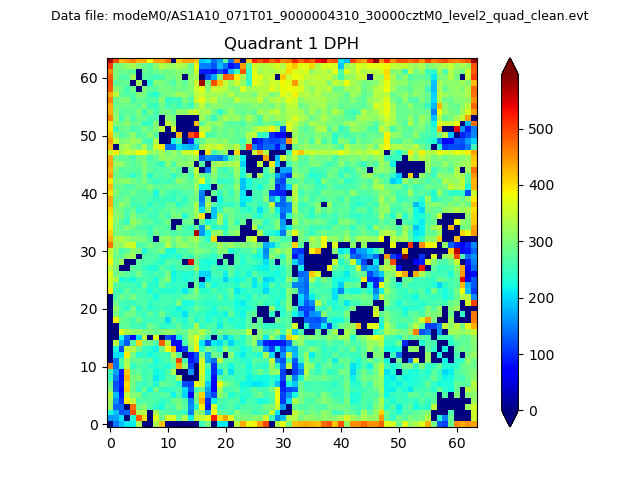 |
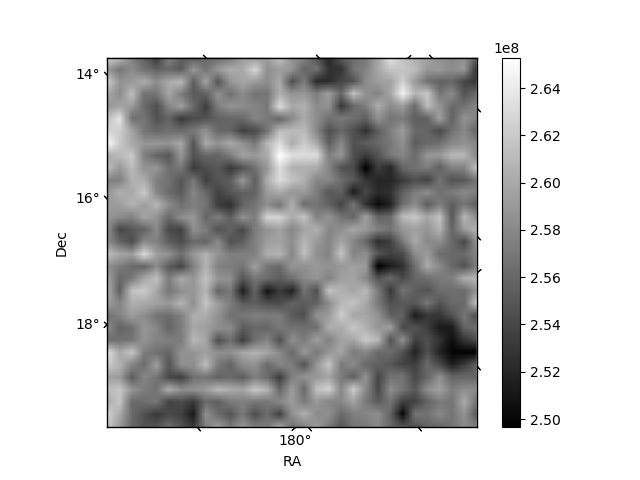
Quadrant B |
|---|---|---|---|
| Quadrant D | 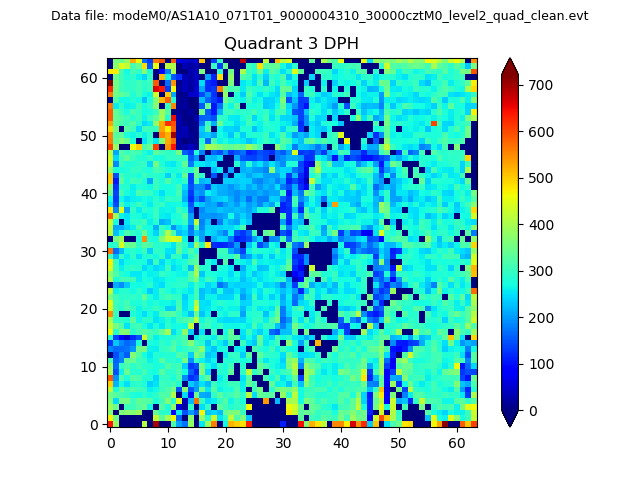 |
 |
Quadrant C |
| Plot type | Count rate plots | Images |
|---|---|---|
| Comparison with Poisson distribution Blue bars denote a histogram of data divided into 1 sec bins. Red curve is a Poisson curve with rate = median count rate of data. |
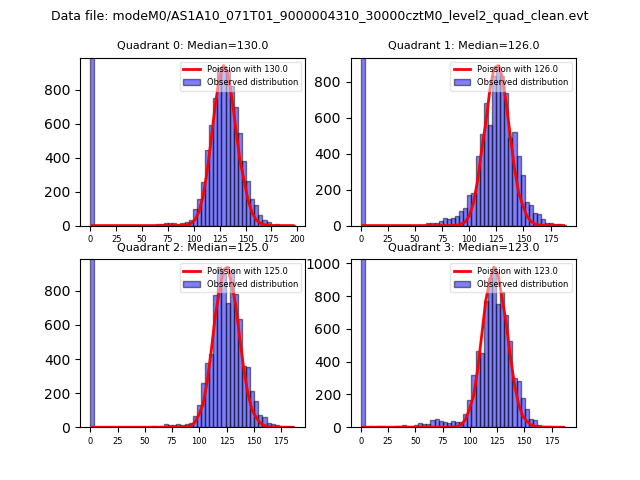 |
 |
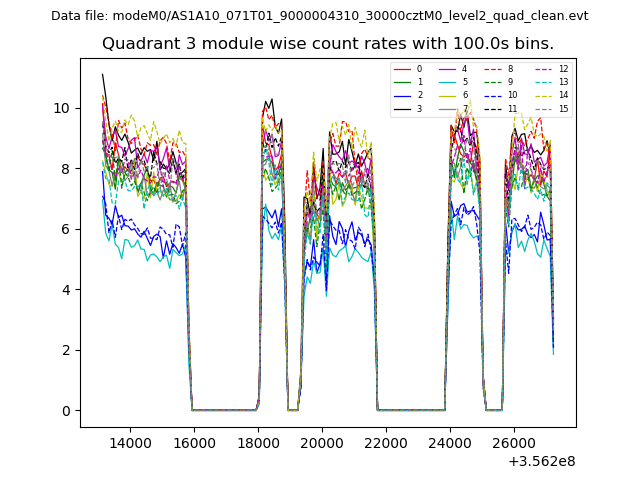
| Quadrant-wise count rates Data is divided into 100 sec bins |
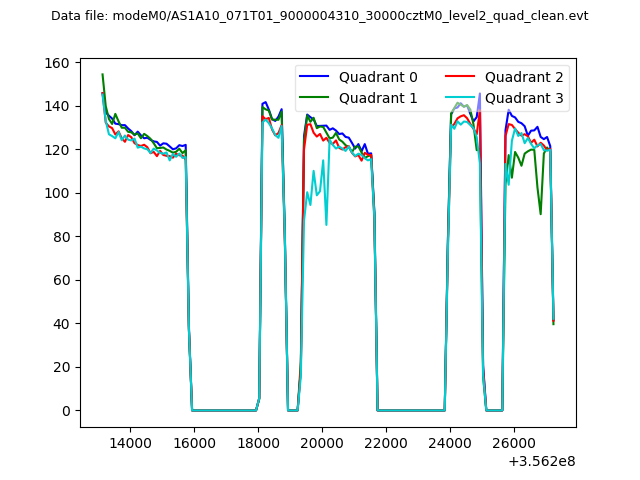 |
|
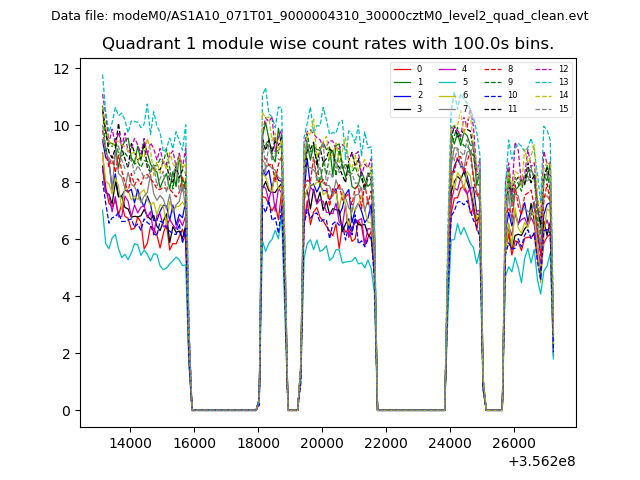
| Module-wise count rates for Quadrant A Data is divided into 100 sec bins |
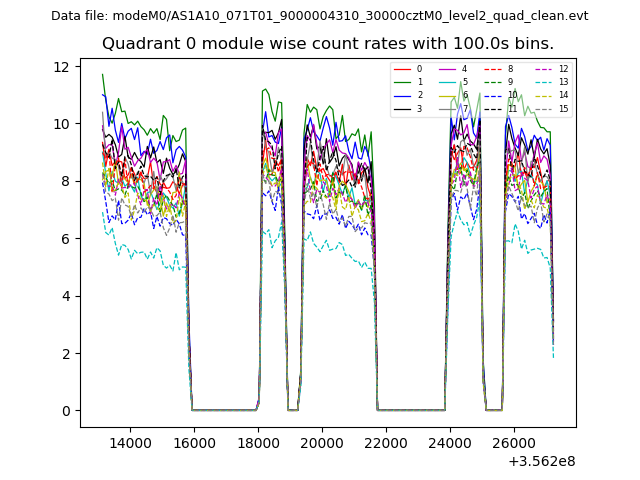 |
 |
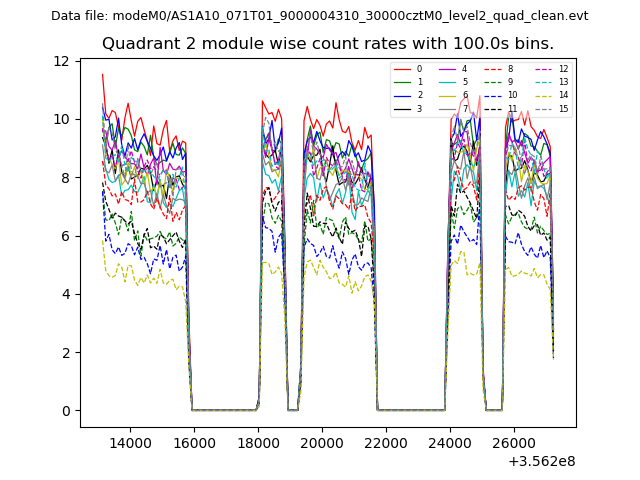
| Module-wise count rates for Quadrant B Data is divided into 100 sec bins |
 |
 |
| Module-wise count rates for Quadrant C Data is divided into 100 sec bins |
 |
 |
| Module-wise count rates for Quadrant D Data is divided into 100 sec bins |
 |
 |
| Parameter | Plot |
|---|---|
| CZT HV Monitor | 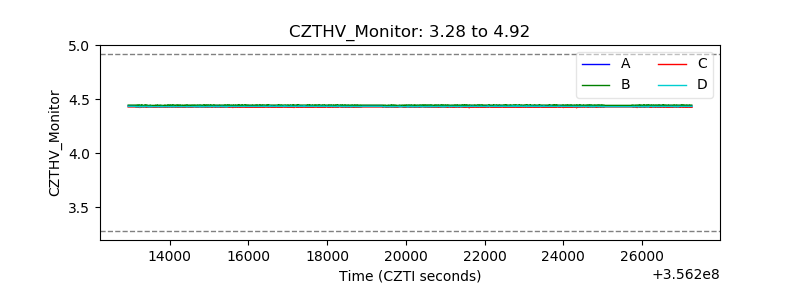 |
| D_VDD | 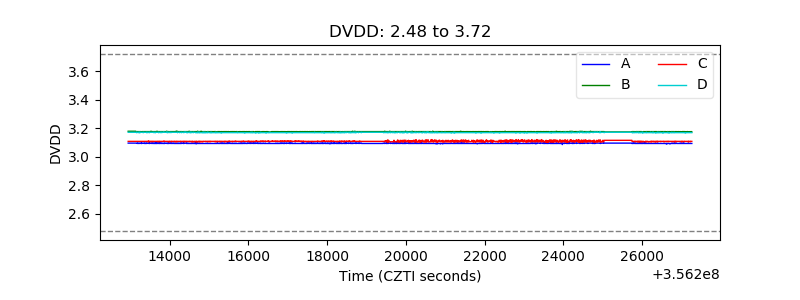 |
| Temperature 1 | 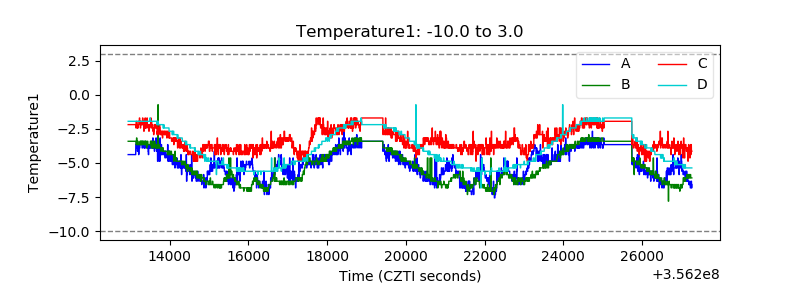 |
| Veto HV Monitor | 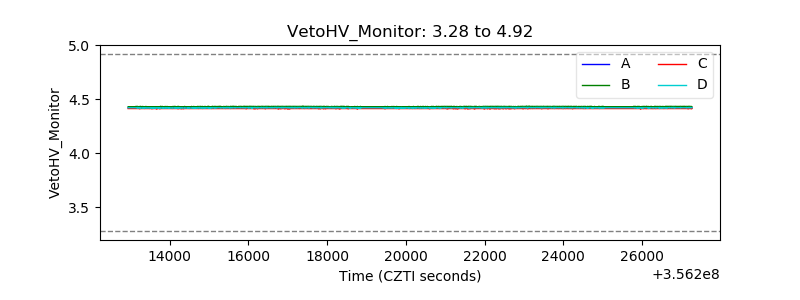 |
| Veto LLD | 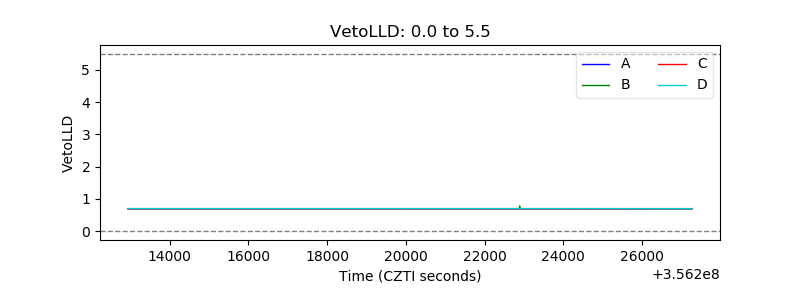 |
| Alpha Counter | 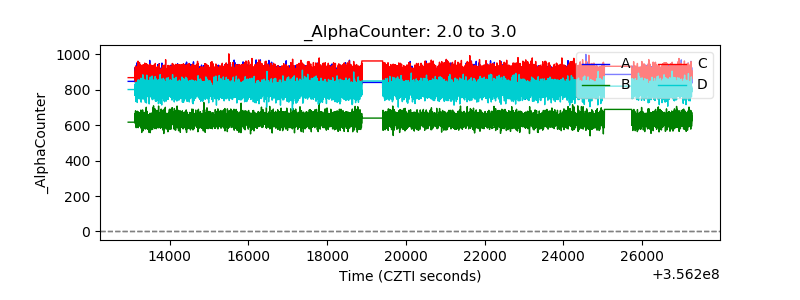 |
| _CPM_Rate | 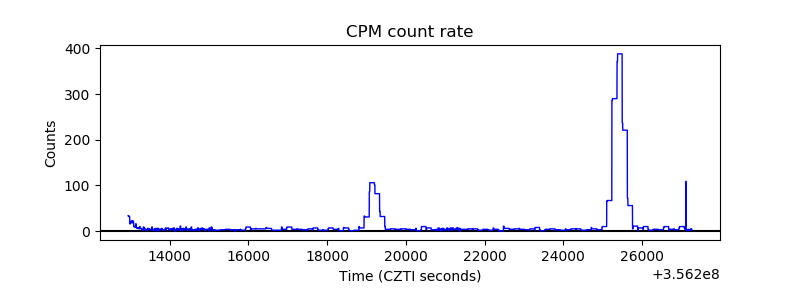 |
| CZT Counter | 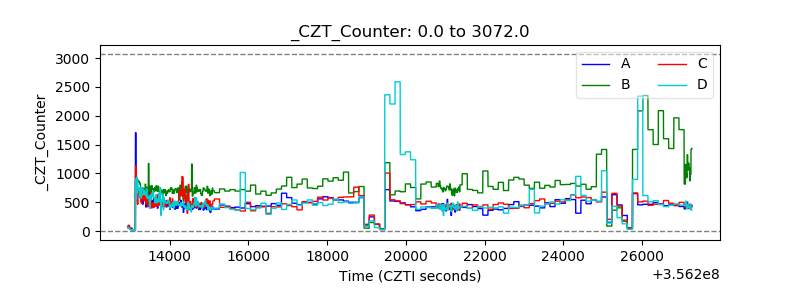 |
| +2.5 Volts monitor |  |
| +5 Volts monitor |  |
| _ROLL_ROT | 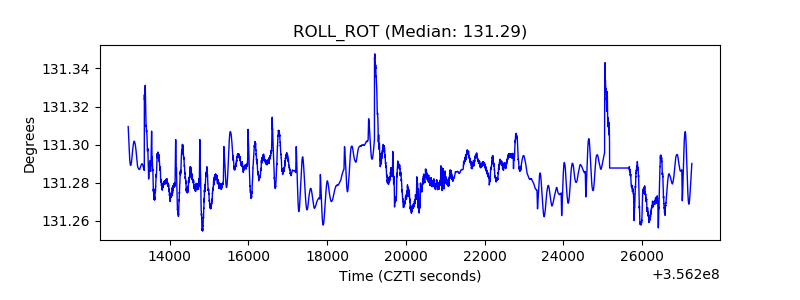 |
| _Roll_DEC | 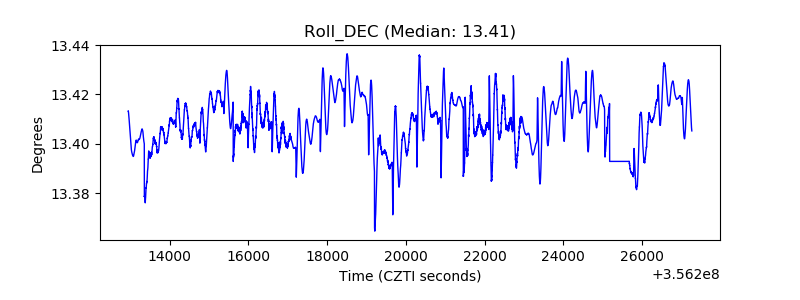 |
| _Roll_RA | 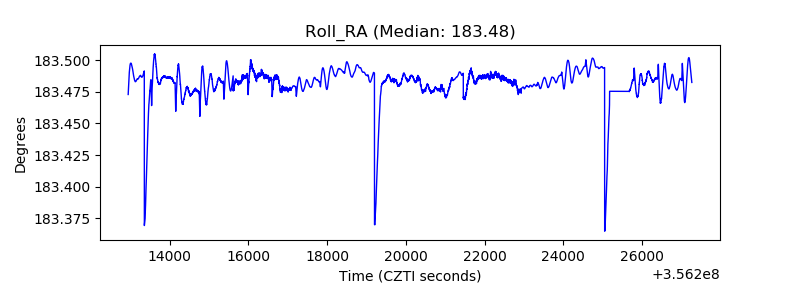 |
| Veto Counter | 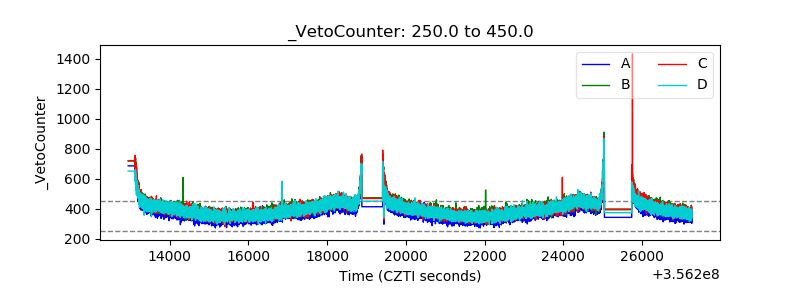 |