| Param | Original file | Final file |
|---|---|---|
| Filename | modeM0/AS1A10_071T01_9000004310_30001cztM0_level2.evt | modeM0/AS1A10_071T01_9000004310_30001cztM0_level2_quad_clean.evt |
| Size (bytes) | 731,309,760 | 95,797,440 |
| Size | 697.4 MB | 91.4 MB |
| Events in quadrant A | 3,387,389 | 634,918 |
| Events in quadrant B | 10,932,201 | 557,337 |
| Events in quadrant C | 3,579,894 | 612,194 |
| Events in quadrant D | 3,767,047 | 600,257 |
| Mode SS | |||
|---|---|---|---|
| Quadrant | BADHDUFLAG | Total packets | Discarded packets |
| A | 0 | 146 | 0 |
| B | 0 | 146 | 0 |
| C | 0 | 146 | 0 |
| D | 0 | 146 | 0 |
| Mode M0 | |||
|---|---|---|---|
| Quadrant | BADHDUFLAG | Total packets | Discarded packets |
| A | 0 | 14662 | 2 |
| B | 0 | 37437 | 2 |
| C | 0 | 15135 | 2 |
| D | 0 | 15868 | 2 |
| Mode M9 | |||
|---|---|---|---|
| Quadrant | BADHDUFLAG | Total packets | Discarded packets |
| A | 0 | 16 | 0 |
| B | 0 | 16 | 0 |
| C | 0 | 16 | 0 |
| D | 0 | 16 | 0 |
| Quadrant | Total seconds | Saturated seconds | Saturation percentage |
|---|---|---|---|
| A | 7118 | 56 | 0.786738% |
| B | 7118 | 2363 | 33.197527% |
| C | 7118 | 138 | 1.938747% |
| D | 7119 | 131 | 1.840146% |
Noise dominated data is calculated using 1-second bins in cleaned event files. If a bin has >2000 counts, and if more than 50% of those come from <1% of pixels, then it is considered to be noise-dominated and hence unusable.
| Quadrant | # 1 sec bins | Bins with >0 counts | Bins with >2000 counts | High rate bins dominated by noise | Noise dominated (total time) | Noise dominated (detector-on time) | Marked lightcurve |
|---|---|---|---|---|---|---|---|
| A | 8708 | 7120 | 2 | 2 | 0.02% | 0.03% | 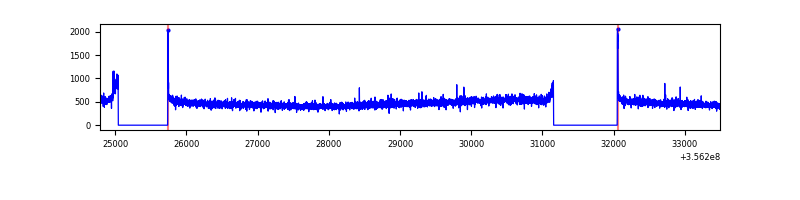 |
| B | 8708 | 7120 | 1416 | 1416 | 16.26% | 19.89% | 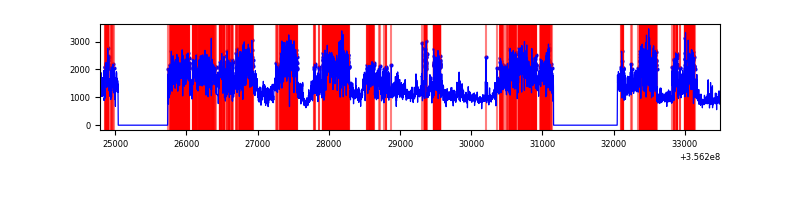 |
| C | 8708 | 7120 | 0 | 0 | 0.00% | 0.00% | 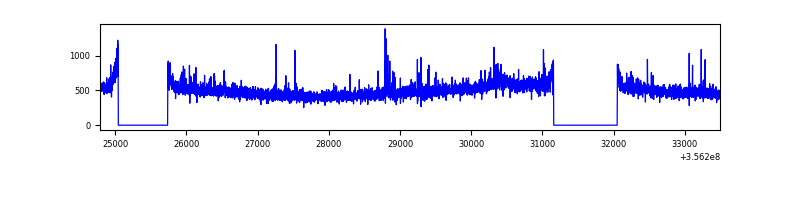 |
| D | 8709 | 7121 | 80 | 80 | 0.92% | 1.12% | 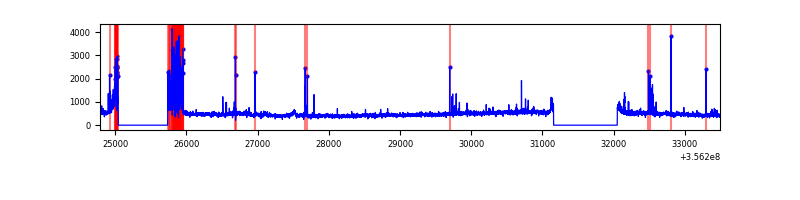 |
Top three noisy pixels from each quadrant. If the there are fewer than three noisy pixels in the level2.evt file, extra rows are filled as -1
| Pixel properties | Quadrant properties | ||||||
|---|---|---|---|---|---|---|---|
| Quadrant | DetID | PixID | Counts | Sigma | Mean | Median | Sigma |
| A | 8 | 192 | 26605 | 146.32 | 869 | 852 | 176.0 |
| A | 13 | 254 | 12349 | 65.32 | 869 | 852 | 176.0 |
| A | 3 | 137 | 8880 | 45.61 | 869 | 852 | 176.0 |
| B | 6 | 36 | 5908781 | 38176.53 | 791 | 768 | 154.8 |
| B | 6 | 159 | 1904152 | 12299.33 | 791 | 768 | 154.8 |
| B | 12 | 111 | 19313 | 119.83 | 791 | 768 | 154.8 |
| C | 14 | 238 | 167838 | 852.74 | 831 | 837 | 195.8 |
| C | 3 | 233 | 109947 | 557.14 | 831 | 837 | 195.8 |
| C | 14 | 254 | 49773 | 249.88 | 831 | 837 | 195.8 |
| D | 7 | 80 | 340470 | 1669.52 | 827 | 808 | 203.4 |
| D | 8 | 195 | 188332 | 921.72 | 827 | 808 | 203.4 |
| D | 2 | 250 | 30663 | 146.74 | 827 | 808 | 203.4 |
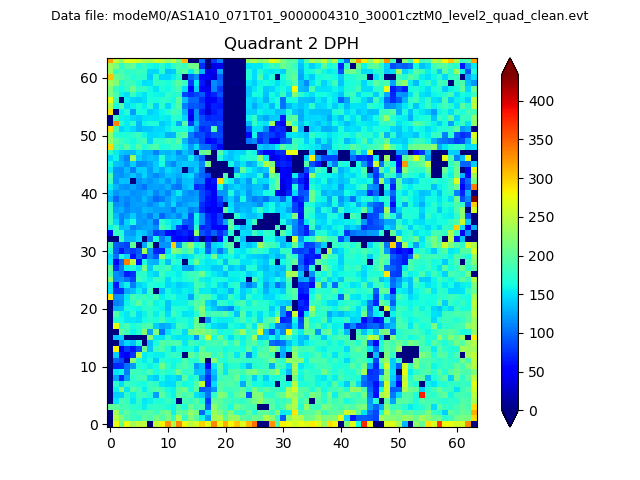
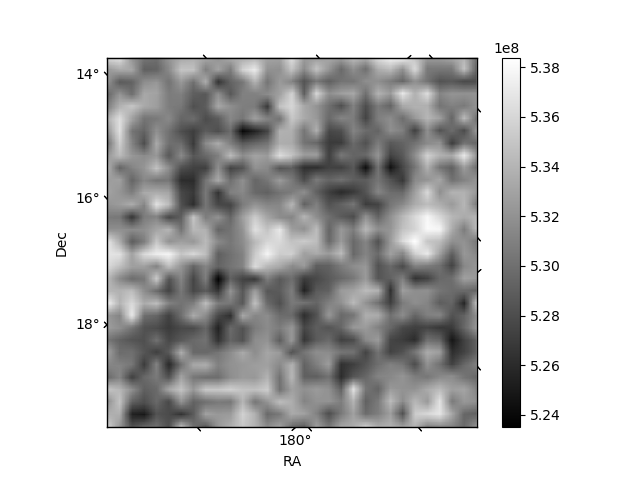
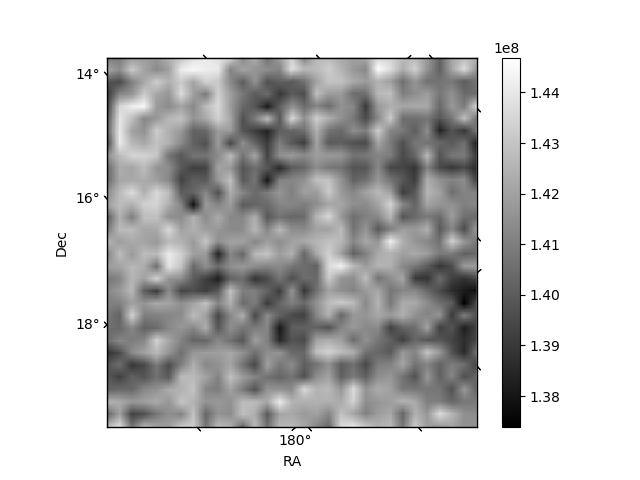
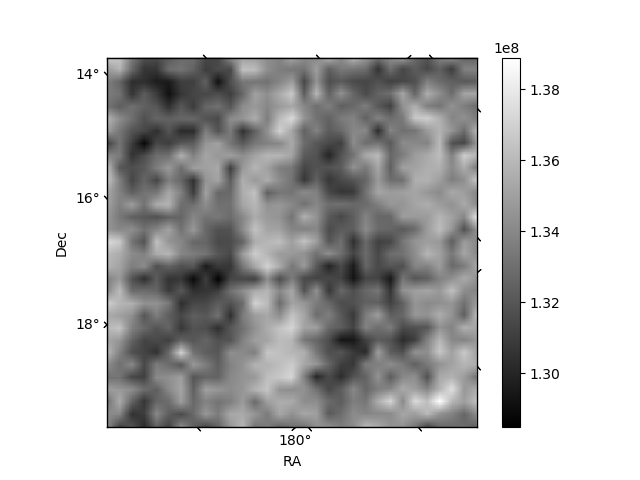
Histogram calculated using DETX and DETY for each event in the final _common_clean file
| Quadrant A | 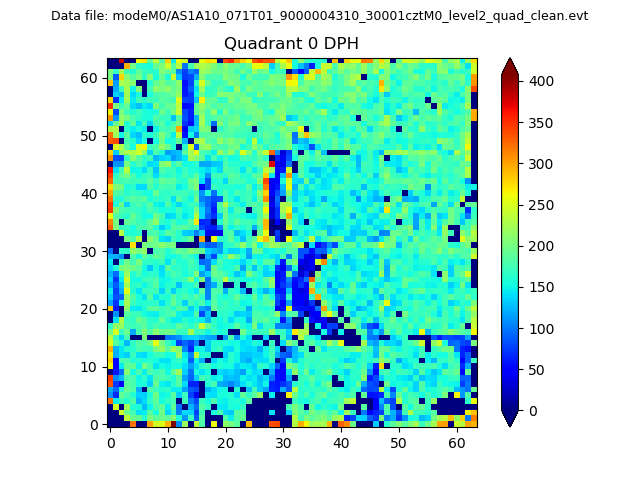 |
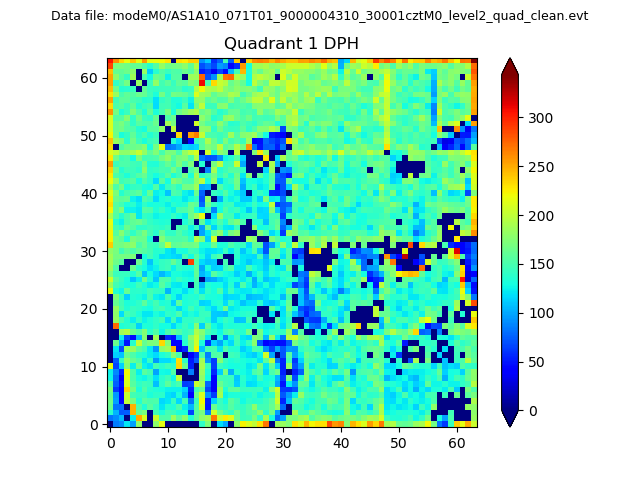 |
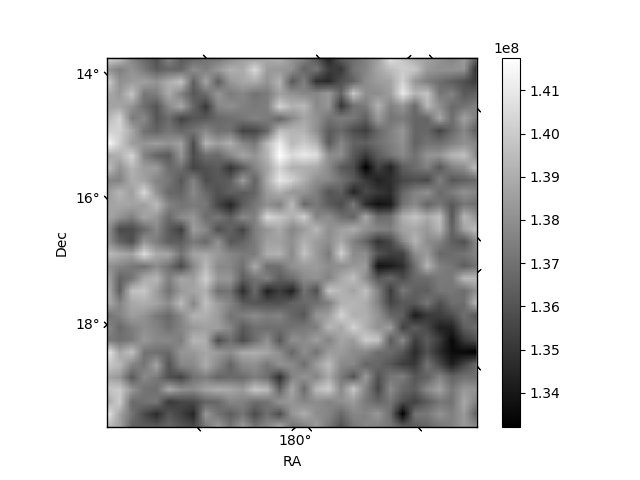
Quadrant B |
|---|---|---|---|
| Quadrant D | 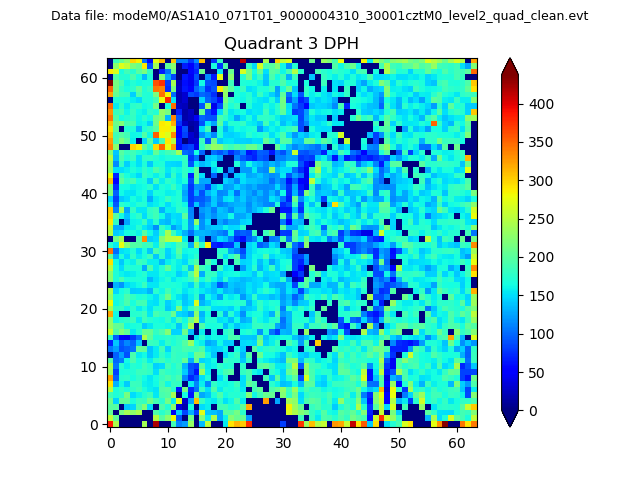 |
 |
Quadrant C |
| Plot type | Count rate plots | Images |
|---|---|---|
| Comparison with Poisson distribution Blue bars denote a histogram of data divided into 1 sec bins. Red curve is a Poisson curve with rate = median count rate of data. |
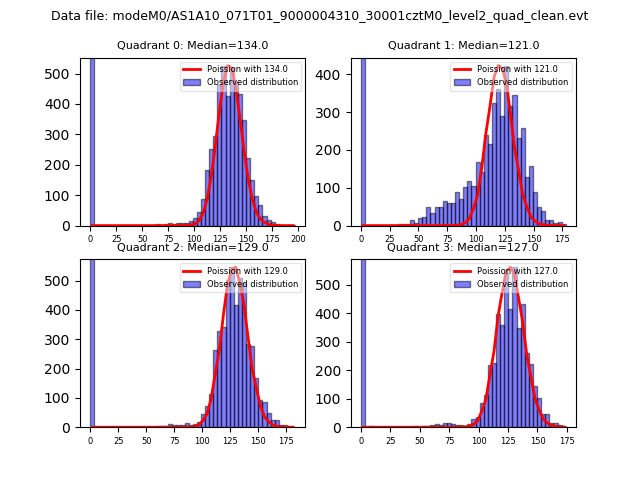 |
 |
| Quadrant-wise count rates Data is divided into 100 sec bins |
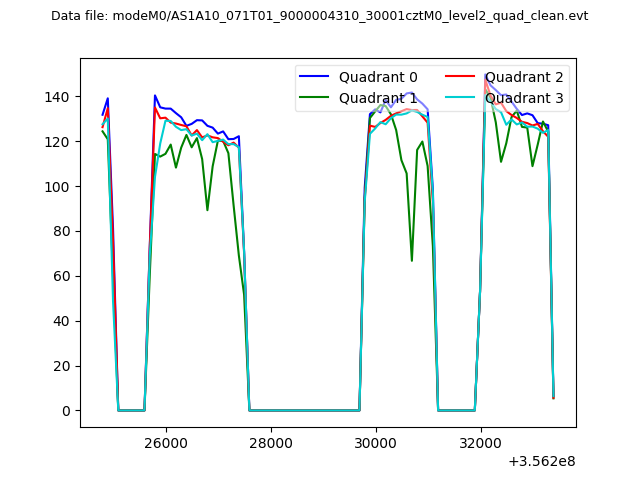 |
|
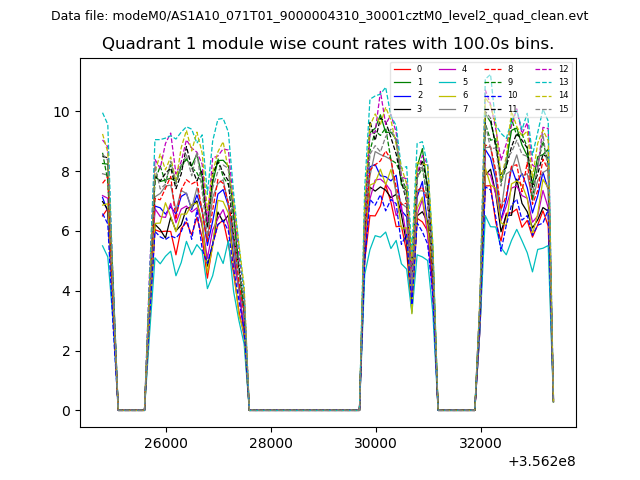
| Module-wise count rates for Quadrant A Data is divided into 100 sec bins |
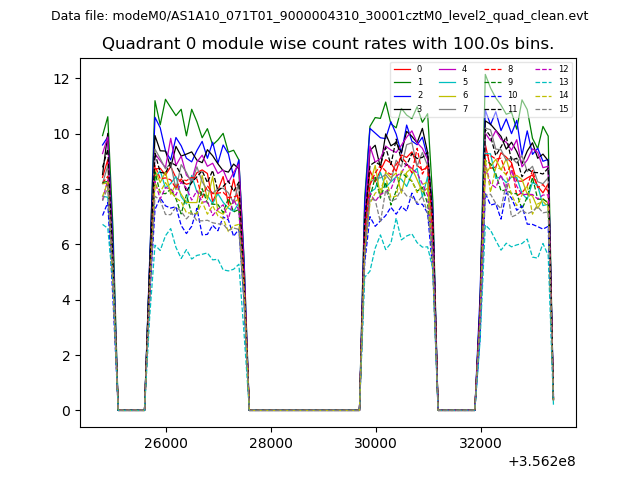 |
 |
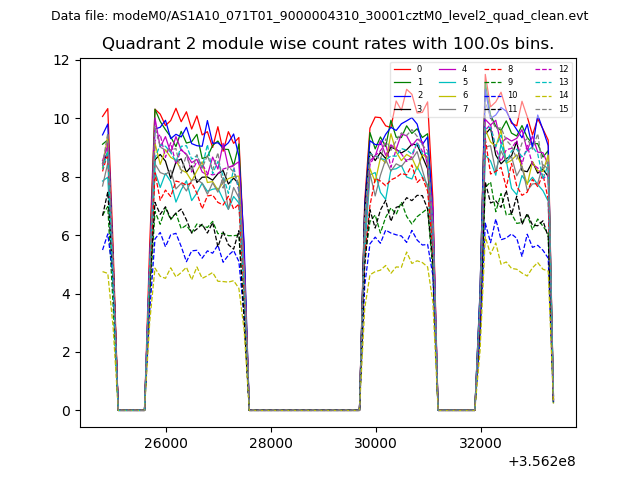
| Module-wise count rates for Quadrant B Data is divided into 100 sec bins |
 |
 |
| Module-wise count rates for Quadrant C Data is divided into 100 sec bins |
 |
 |
| Module-wise count rates for Quadrant D Data is divided into 100 sec bins |
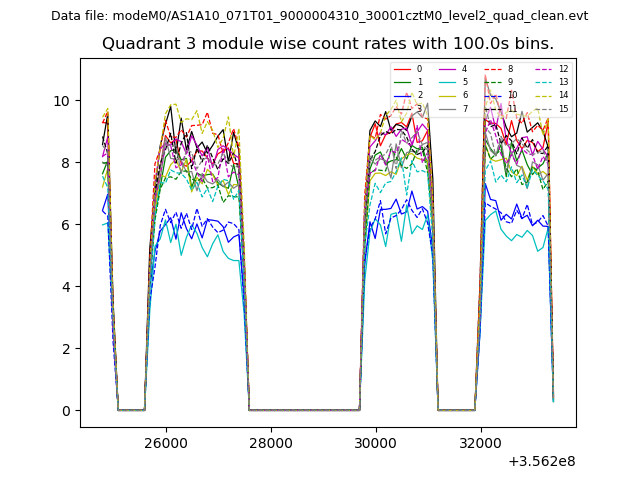 |
 |
| Parameter | Plot |
|---|---|
| CZT HV Monitor | 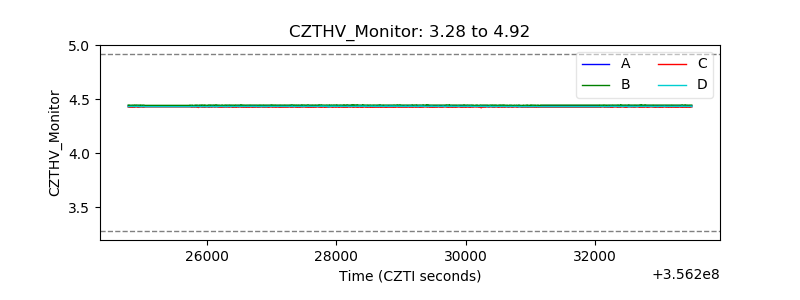 |
| D_VDD | 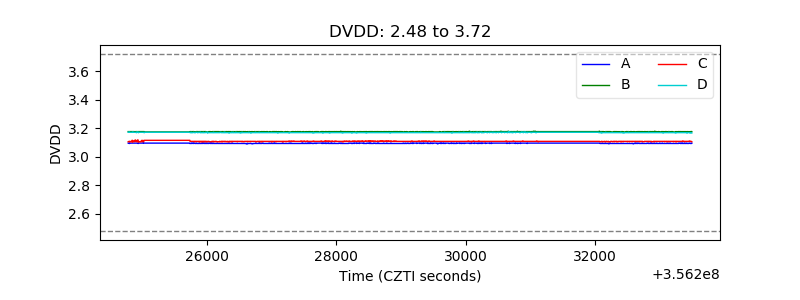 |
| Temperature 1 | 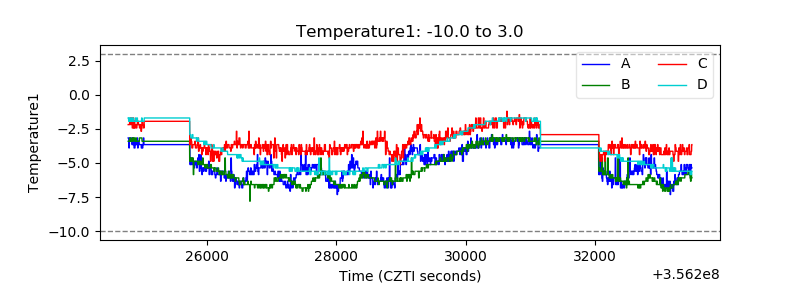 |
| Veto HV Monitor | 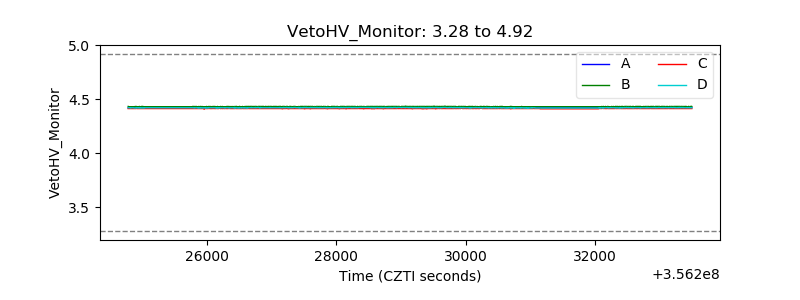 |
| Veto LLD | 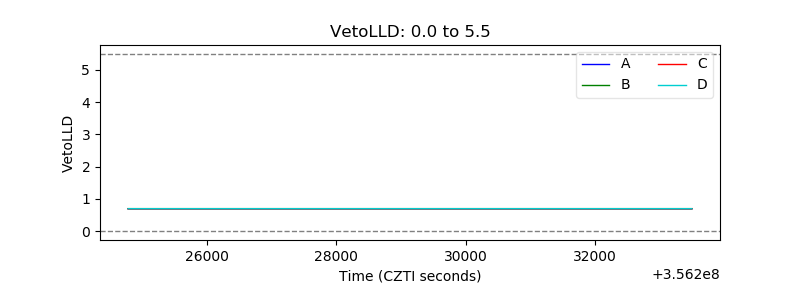 |
| Alpha Counter | 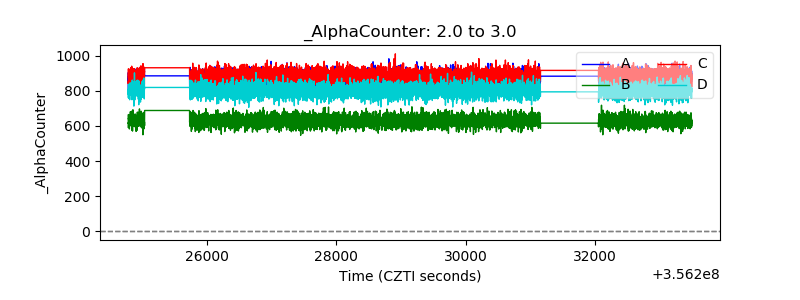 |
| _CPM_Rate | 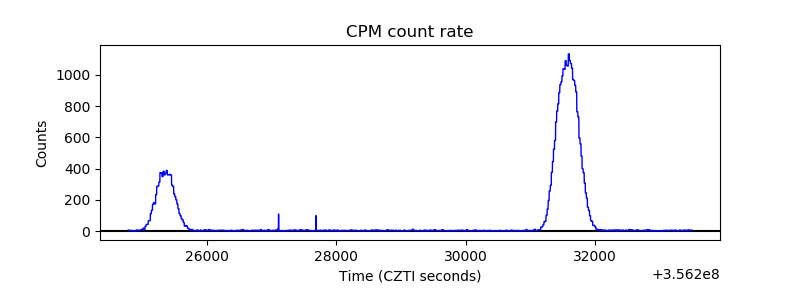 |
| CZT Counter | 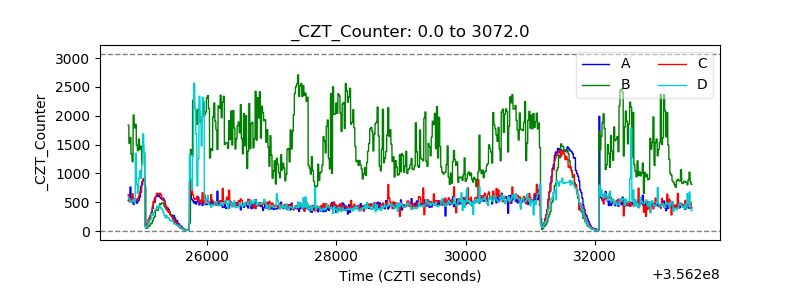 |
| +2.5 Volts monitor |  |
| +5 Volts monitor | 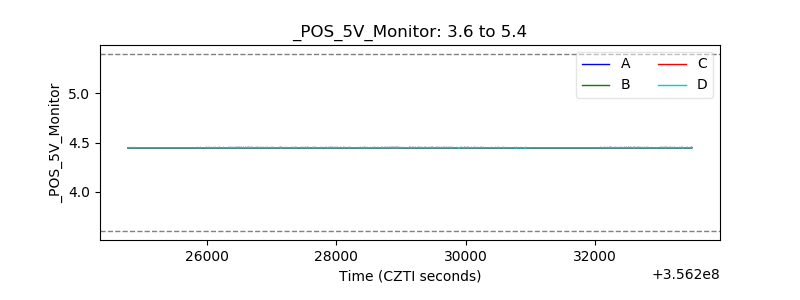 |
| _ROLL_ROT | 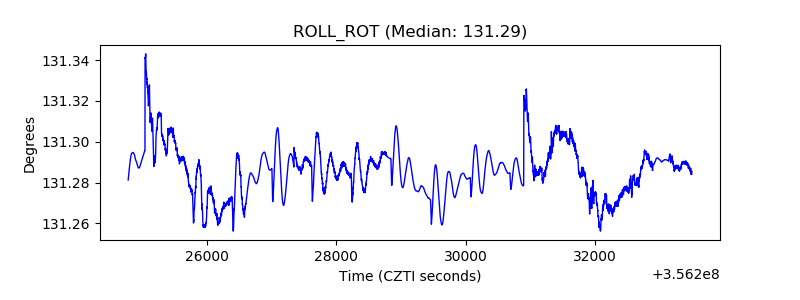 |
| _Roll_DEC | 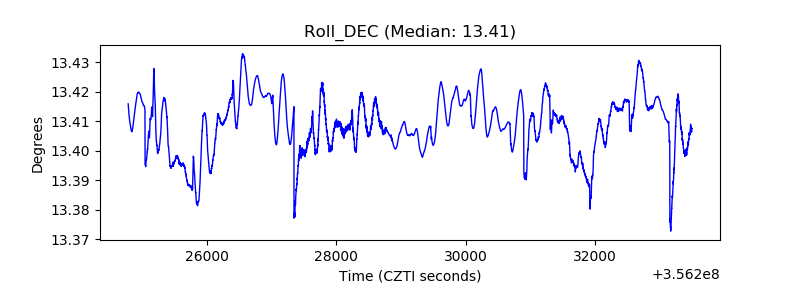 |
| _Roll_RA | 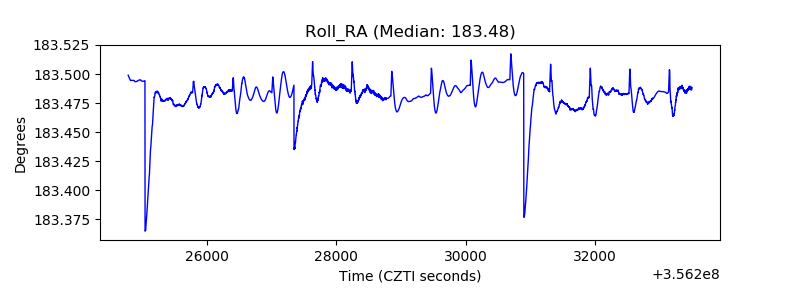 |
| Veto Counter | 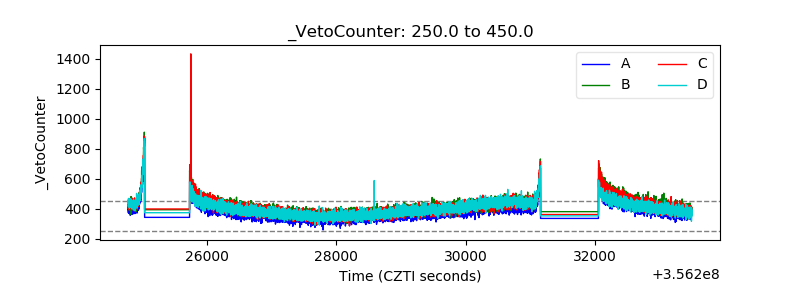 |