| Param | Original file | Final file |
|---|---|---|
| Filename | modeM0/AS1A10_071T01_9000004310_30002cztM0_level2.evt | modeM0/AS1A10_071T01_9000004310_30002cztM0_level2_quad_clean.evt |
| Size (bytes) | 638,184,960 | 89,066,880 |
| Size | 608.6 MB | 84.9 MB |
| Events in quadrant A | 3,298,147 | 575,588 |
| Events in quadrant B | 8,591,463 | 547,440 |
| Events in quadrant C | 3,480,704 | 551,385 |
| Events in quadrant D | 3,496,133 | 547,315 |
| Mode SS | |||
|---|---|---|---|
| Quadrant | BADHDUFLAG | Total packets | Discarded packets |
| A | 0 | 142 | 0 |
| B | 0 | 142 | 0 |
| C | 0 | 142 | 0 |
| D | 0 | 142 | 0 |
| Mode M0 | |||
|---|---|---|---|
| Quadrant | BADHDUFLAG | Total packets | Discarded packets |
| A | 0 | 13982 | 2 |
| B | 0 | 30271 | 4 |
| C | 0 | 14549 | 2 |
| D | 0 | 14775 | 2 |
| Mode M9 | |||
|---|---|---|---|
| Quadrant | BADHDUFLAG | Total packets | Discarded packets |
| A | 0 | 19 | 0 |
| B | 0 | 19 | 0 |
| C | 0 | 19 | 0 |
| D | 0 | 19 | 0 |
| Quadrant | Total seconds | Saturated seconds | Saturation percentage |
|---|---|---|---|
| A | 6814 | 28 | 0.410919% |
| B | 6814 | 921 | 13.516290% |
| C | 6814 | 97 | 1.423540% |
| D | 6814 | 46 | 0.675081% |
Noise dominated data is calculated using 1-second bins in cleaned event files. If a bin has >2000 counts, and if more than 50% of those come from <1% of pixels, then it is considered to be noise-dominated and hence unusable.
| Quadrant | # 1 sec bins | Bins with >0 counts | Bins with >2000 counts | High rate bins dominated by noise | Noise dominated (total time) | Noise dominated (detector-on time) | Marked lightcurve |
|---|---|---|---|---|---|---|---|
| A | 8764 | 6816 | 5 | 5 | 0.06% | 0.07% | 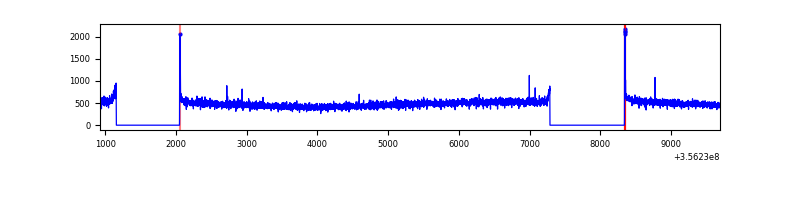 |
| B | 8764 | 6816 | 454 | 454 | 5.18% | 6.66% | 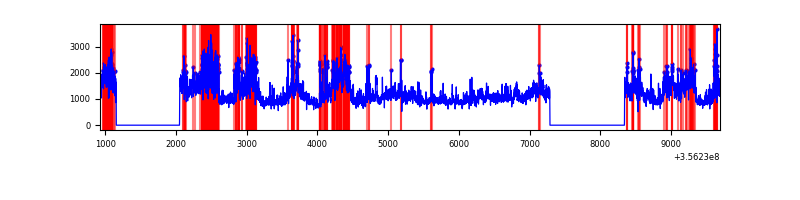 |
| C | 8764 | 6816 | 0 | 0 | 0.00% | 0.00% | 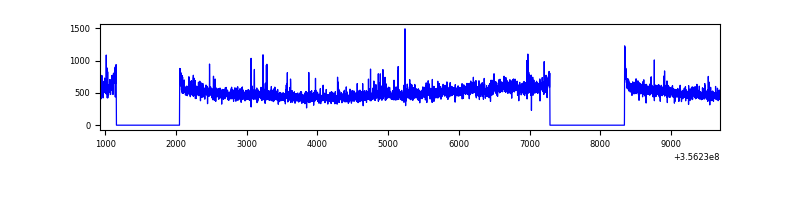 |
| D | 8764 | 6816 | 32 | 32 | 0.37% | 0.47% | 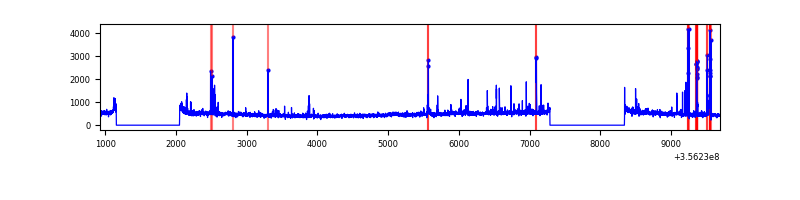 |
Top three noisy pixels from each quadrant. If the there are fewer than three noisy pixels in the level2.evt file, extra rows are filled as -1
| Pixel properties | Quadrant properties | ||||||
|---|---|---|---|---|---|---|---|
| Quadrant | DetID | PixID | Counts | Sigma | Mean | Median | Sigma |
| A | 8 | 192 | 27542 | 157.22 | 848 | 832 | 169.9 |
| A | 13 | 254 | 11634 | 63.58 | 848 | 832 | 169.9 |
| A | 3 | 137 | 8361 | 44.32 | 848 | 832 | 169.9 |
| B | 6 | 36 | 3526167 | 22414.84 | 815 | 795 | 157.3 |
| B | 6 | 159 | 1850765 | 11762.38 | 815 | 795 | 157.3 |
| B | 12 | 111 | 19628 | 119.74 | 815 | 795 | 157.3 |
| C | 14 | 238 | 151842 | 794.91 | 807 | 813 | 190.0 |
| C | 3 | 233 | 141076 | 738.24 | 807 | 813 | 190.0 |
| C | 14 | 254 | 30000 | 153.62 | 807 | 813 | 190.0 |
| D | 8 | 195 | 153263 | 780.4 | 810 | 793 | 195.4 |
| D | 7 | 80 | 91013 | 461.78 | 810 | 793 | 195.4 |
| D | 10 | 199 | 90552 | 459.42 | 810 | 793 | 195.4 |
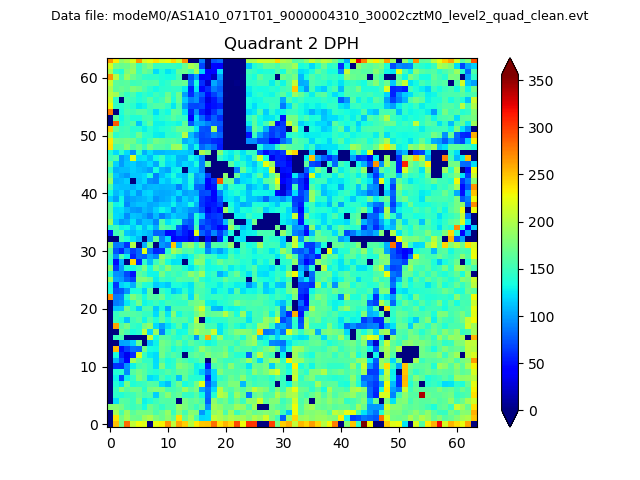
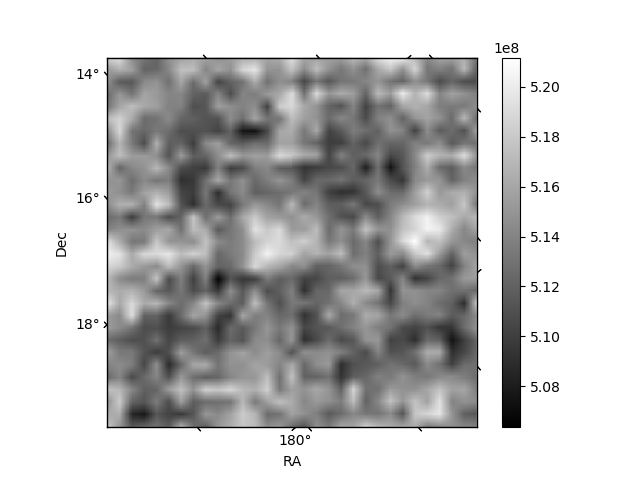
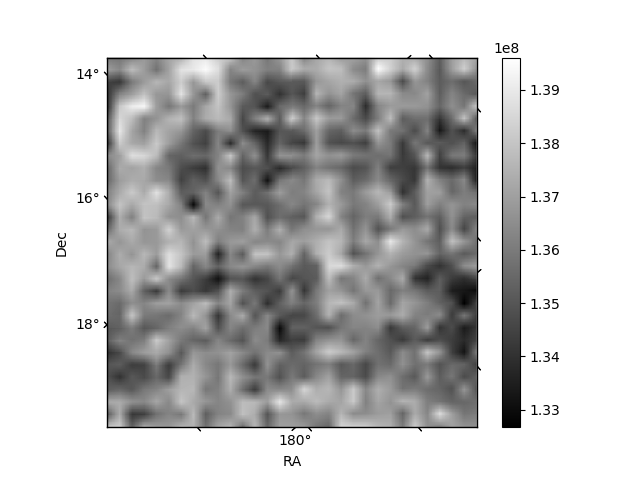
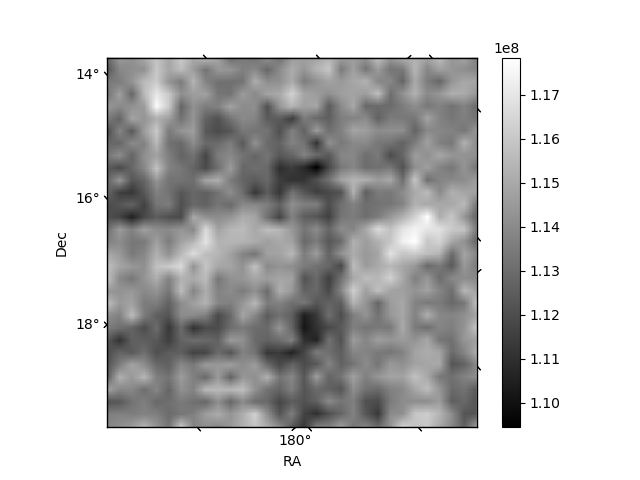
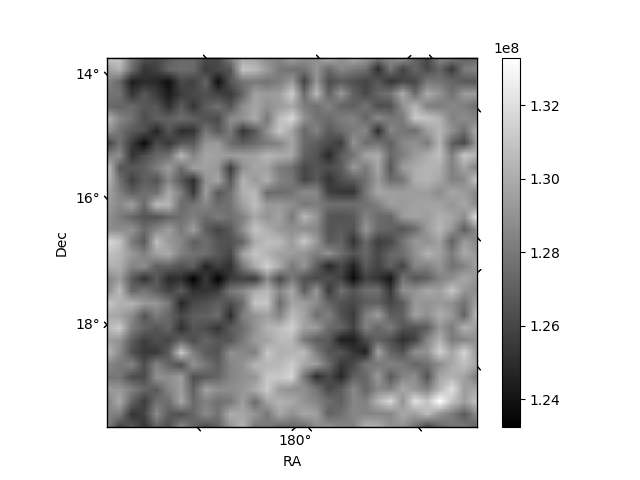
Histogram calculated using DETX and DETY for each event in the final _common_clean file
| Quadrant A | 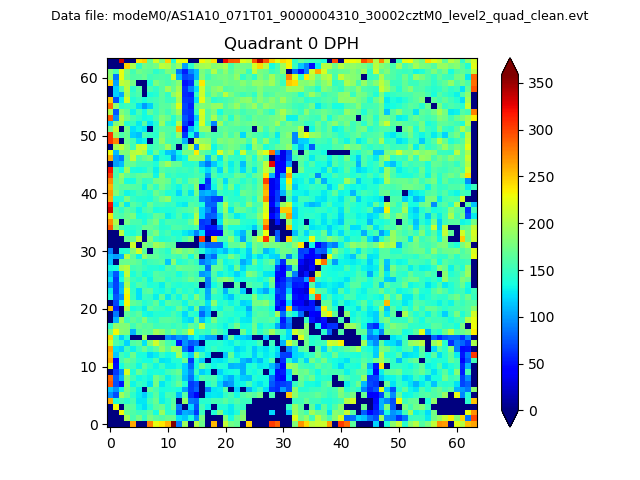 |
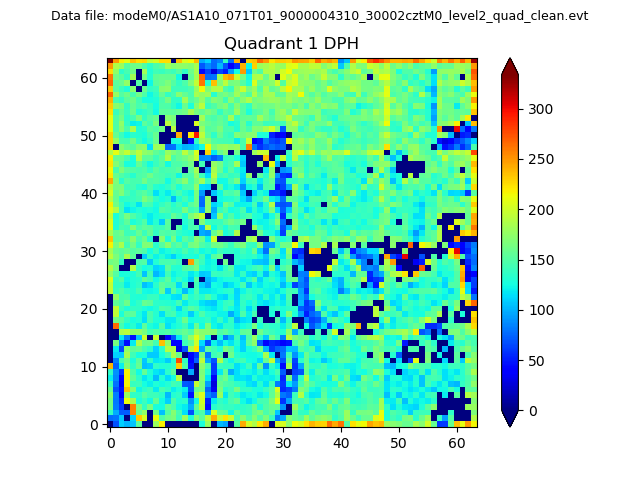 |
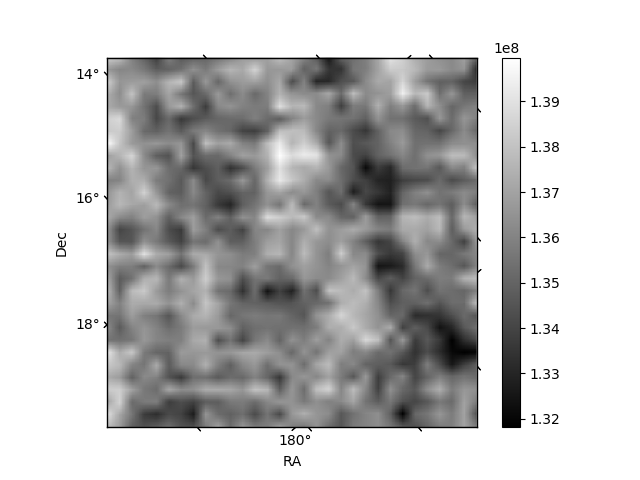
Quadrant B |
|---|---|---|---|
| Quadrant D | 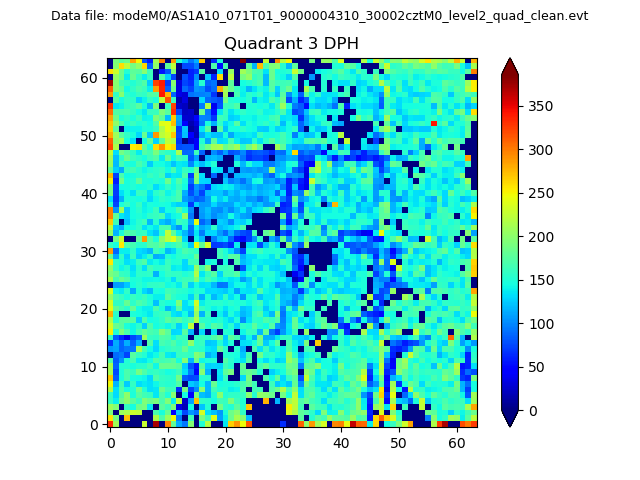 |
 |
Quadrant C |
| Plot type | Count rate plots | Images |
|---|---|---|
| Comparison with Poisson distribution Blue bars denote a histogram of data divided into 1 sec bins. Red curve is a Poisson curve with rate = median count rate of data. |
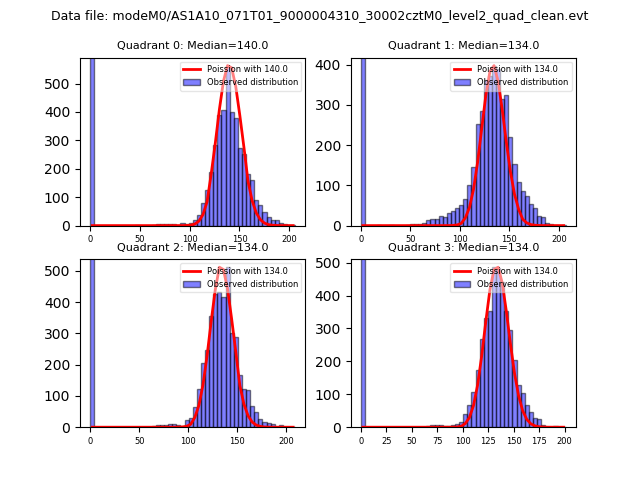 |
 |
| Quadrant-wise count rates Data is divided into 100 sec bins |
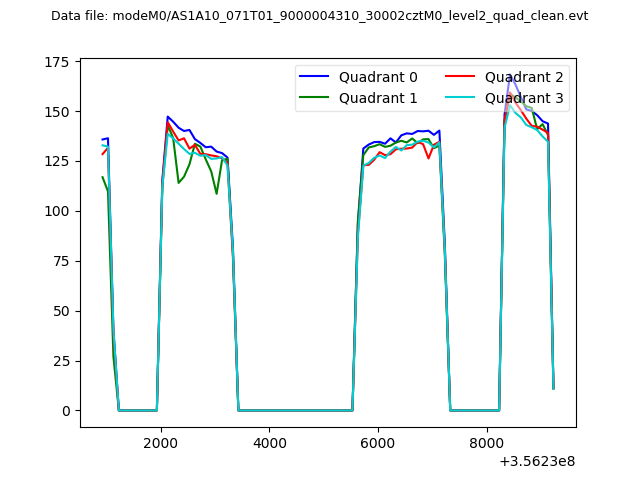 |
|
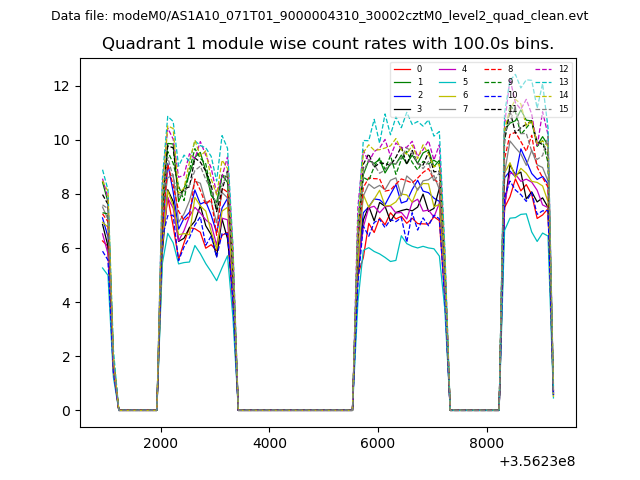
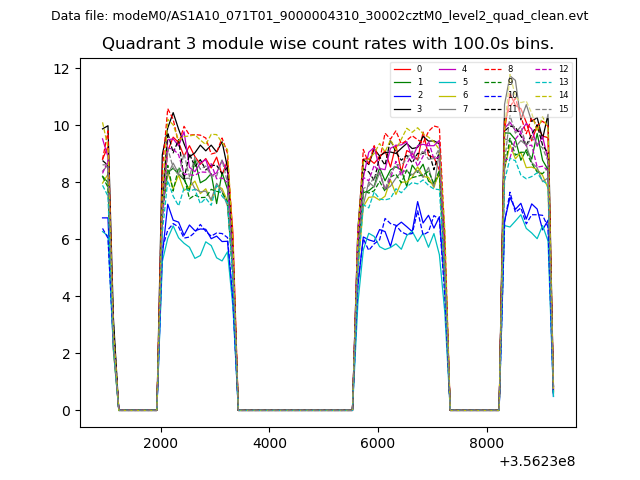
| Module-wise count rates for Quadrant A Data is divided into 100 sec bins |
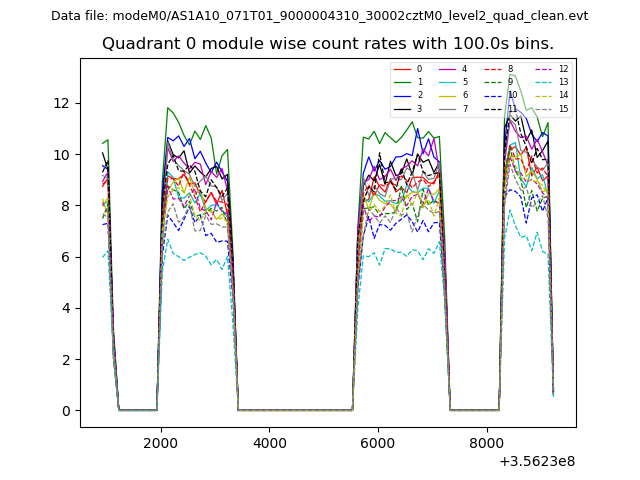 |
 |
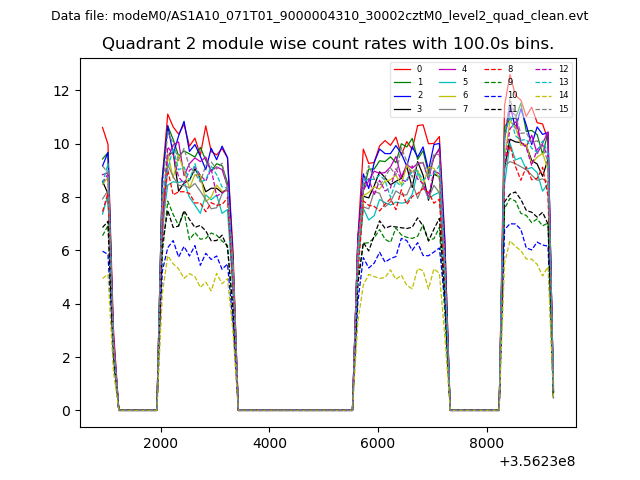
| Module-wise count rates for Quadrant B Data is divided into 100 sec bins |
 |
 |
| Module-wise count rates for Quadrant C Data is divided into 100 sec bins |
 |
 |
| Module-wise count rates for Quadrant D Data is divided into 100 sec bins |
 |
 |
| Parameter | Plot |
|---|---|
| CZT HV Monitor | 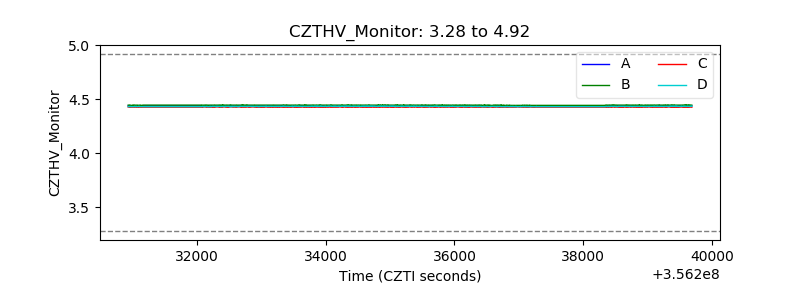 |
| D_VDD | 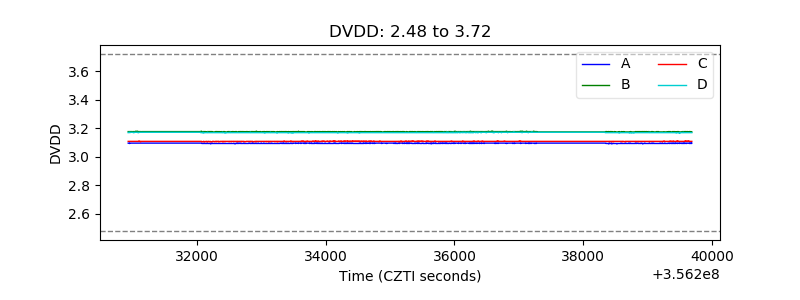 |
| Temperature 1 | 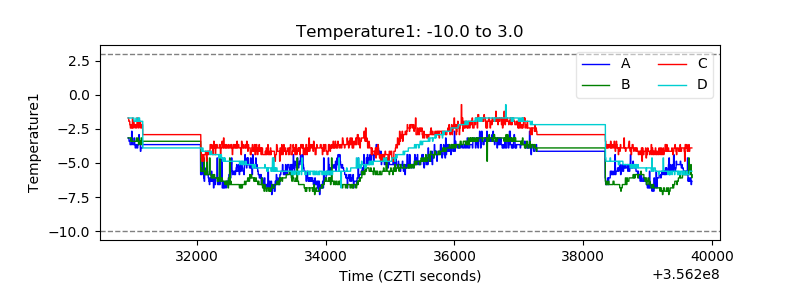 |
| Veto HV Monitor | 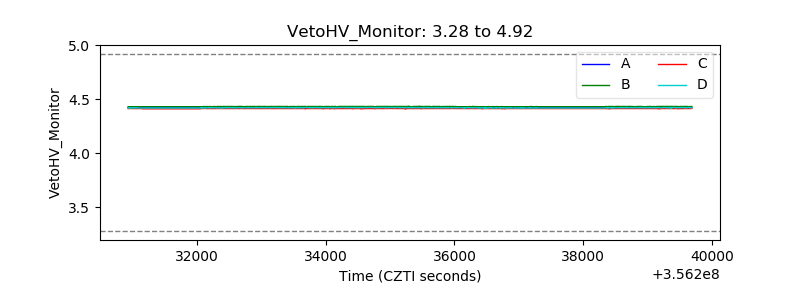 |
| Veto LLD | 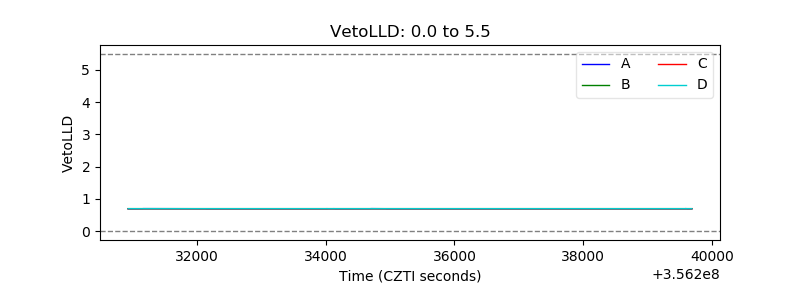 |
| Alpha Counter | 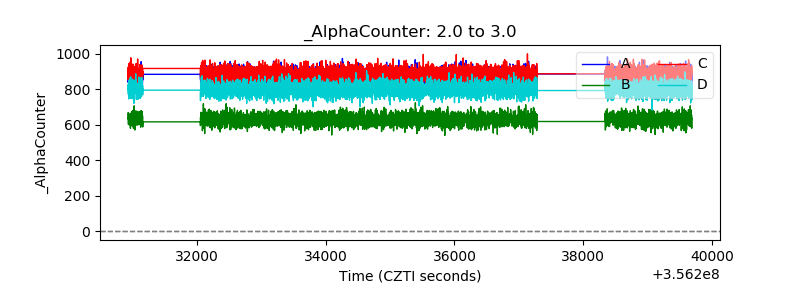 |
| _CPM_Rate | 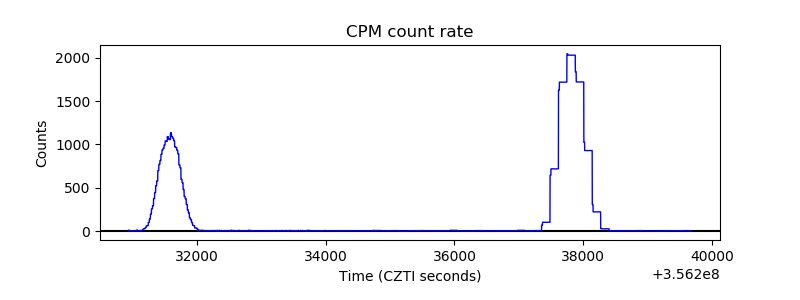 |
| CZT Counter | 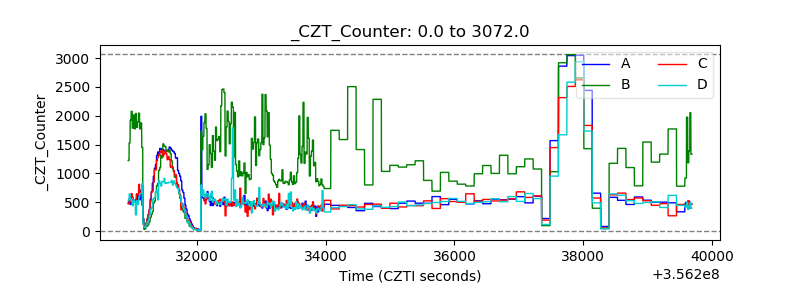 |
| +2.5 Volts monitor |  |
| +5 Volts monitor |  |
| _ROLL_ROT | 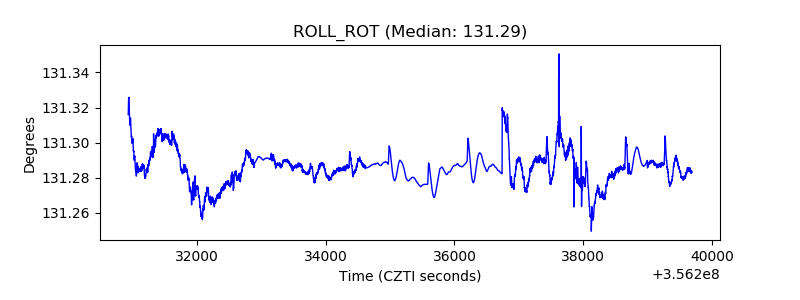 |
| _Roll_DEC | 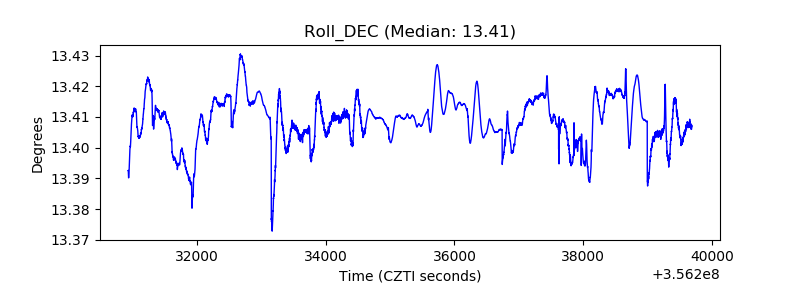 |
| _Roll_RA | 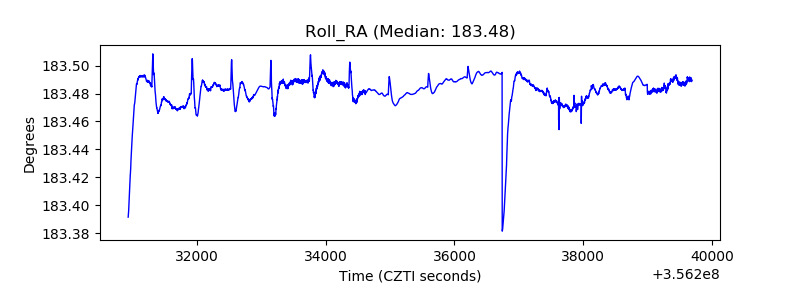 |
| Veto Counter | 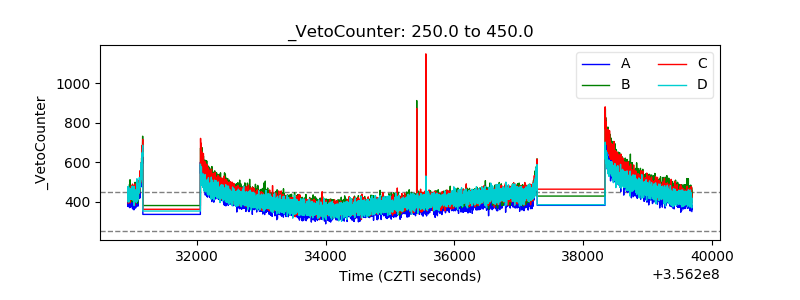 |