| Param | Original file | Final file |
|---|---|---|
| Filename | modeM0/AS1A10_071T01_9000004310_30004cztM0_level2.evt | modeM0/AS1A10_071T01_9000004310_30004cztM0_level2_quad_clean.evt |
| Size (bytes) | 698,760,000 | 76,144,320 |
| Size | 666.4 MB | 72.6 MB |
| Events in quadrant A | 3,249,064 | 498,486 |
| Events in quadrant B | 10,735,942 | 415,212 |
| Events in quadrant C | 3,400,831 | 475,041 |
| Events in quadrant D | 3,343,010 | 469,323 |
| Mode SS | |||
|---|---|---|---|
| Quadrant | BADHDUFLAG | Total packets | Discarded packets |
| A | 0 | 130 | 0 |
| B | 0 | 130 | 0 |
| C | 0 | 130 | 0 |
| D | 0 | 130 | 0 |
| Mode M0 | |||
|---|---|---|---|
| Quadrant | BADHDUFLAG | Total packets | Discarded packets |
| A | 0 | 13422 | 2 |
| B | 0 | 36320 | 2 |
| C | 0 | 13793 | 2 |
| D | 0 | 13959 | 2 |
| Mode M9 | |||
|---|---|---|---|
| Quadrant | BADHDUFLAG | Total packets | Discarded packets |
| A | 0 | 20 | 0 |
| B | 0 | 21 | 0 |
| C | 0 | 21 | 0 |
| D | 0 | 21 | 0 |
| Quadrant | Total seconds | Saturated seconds | Saturation percentage |
|---|---|---|---|
| A | 6406 | 31 | 0.483921% |
| B | 6406 | 2575 | 40.196691% |
| C | 6405 | 112 | 1.748634% |
| D | 6405 | 32 | 0.499610% |
Noise dominated data is calculated using 1-second bins in cleaned event files. If a bin has >2000 counts, and if more than 50% of those come from <1% of pixels, then it is considered to be noise-dominated and hence unusable.
| Quadrant | # 1 sec bins | Bins with >0 counts | Bins with >2000 counts | High rate bins dominated by noise | Noise dominated (total time) | Noise dominated (detector-on time) | Marked lightcurve |
|---|---|---|---|---|---|---|---|
| A | 7566 | 6407 | 7 | 7 | 0.09% | 0.11% | 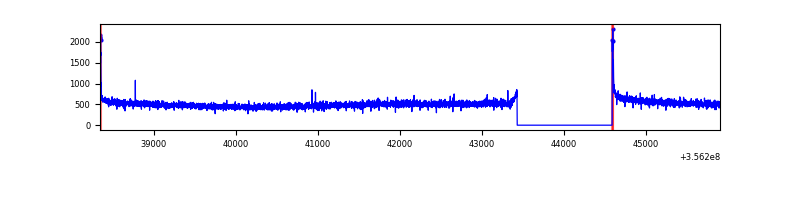 |
| B | 7566 | 6407 | 1607 | 1607 | 21.24% | 25.08% | 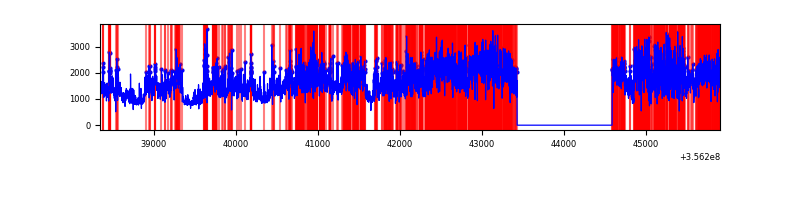 |
| C | 7565 | 6406 | 0 | 0 | 0.00% | 0.00% | 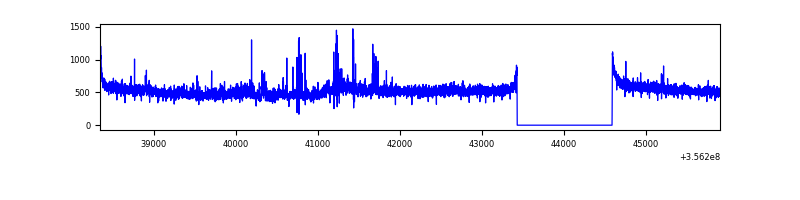 |
| D | 7565 | 6406 | 30 | 30 | 0.40% | 0.47% |  |
Top three noisy pixels from each quadrant. If the there are fewer than three noisy pixels in the level2.evt file, extra rows are filled as -1
| Pixel properties | Quadrant properties | ||||||
|---|---|---|---|---|---|---|---|
| Quadrant | DetID | PixID | Counts | Sigma | Mean | Median | Sigma |
| A | 8 | 192 | 31892 | 188.13 | 833 | 819 | 165.2 |
| A | 13 | 254 | 11497 | 64.65 | 833 | 819 | 165.2 |
| A | 3 | 137 | 8012 | 43.55 | 833 | 819 | 165.2 |
| B | 6 | 36 | 6233200 | 44267.01 | 737 | 719 | 140.8 |
| B | 6 | 159 | 1598567 | 11348.92 | 737 | 719 | 140.8 |
| B | 12 | 111 | 17059 | 116.06 | 737 | 719 | 140.8 |
| C | 14 | 238 | 155508 | 839.24 | 785 | 791 | 184.4 |
| C | 3 | 233 | 135747 | 732.05 | 785 | 791 | 184.4 |
| C | 14 | 254 | 40024 | 212.81 | 785 | 791 | 184.4 |
| D | 8 | 195 | 162478 | 864.18 | 790 | 774 | 187.1 |
| D | 10 | 199 | 109488 | 580.99 | 790 | 774 | 187.1 |
| D | 2 | 250 | 22943 | 118.48 | 790 | 774 | 187.1 |
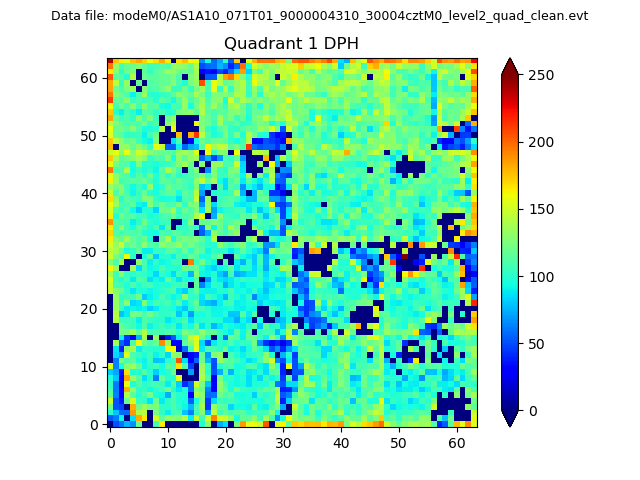
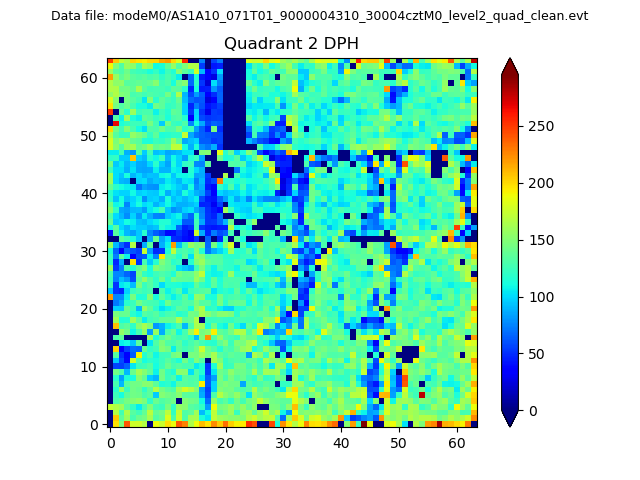
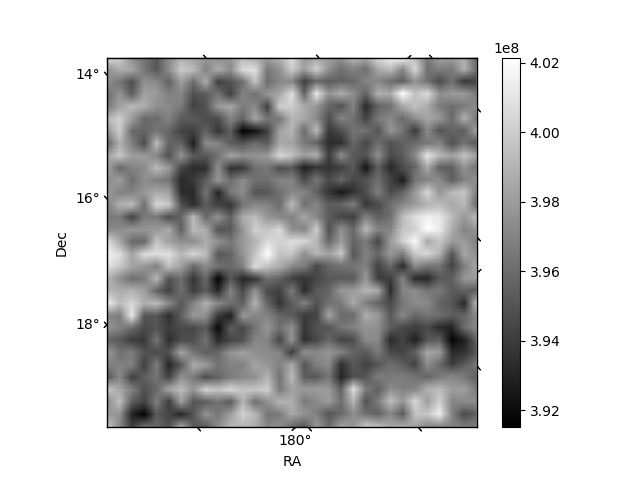
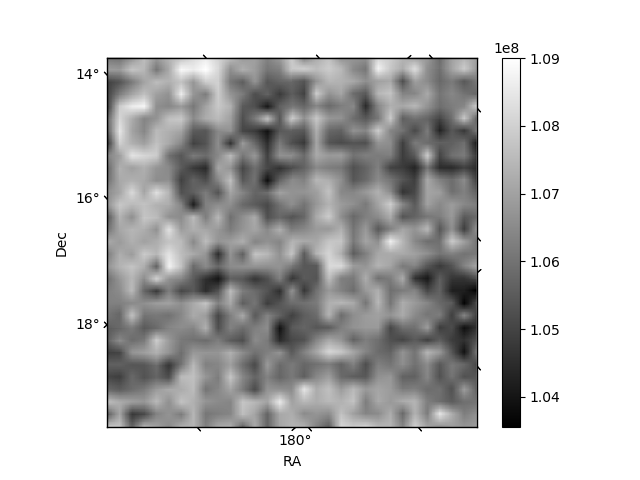
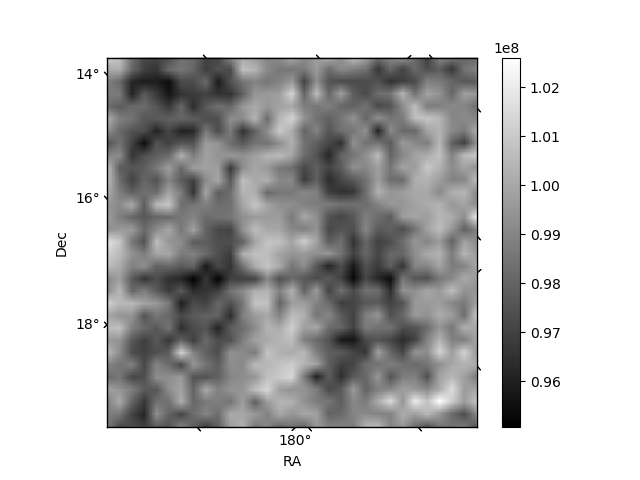
Histogram calculated using DETX and DETY for each event in the final _common_clean file
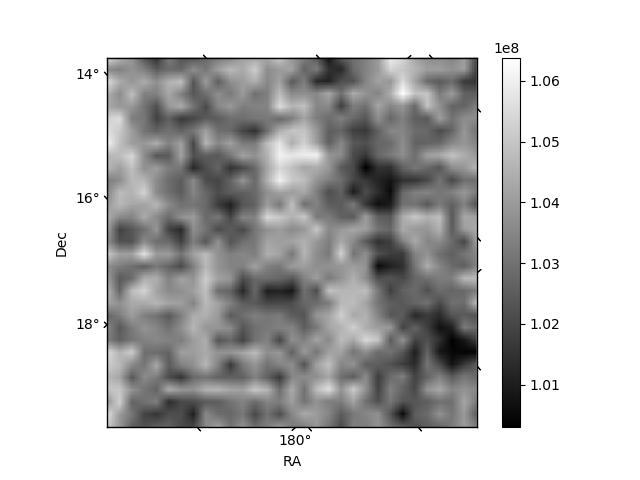
| Quadrant A | 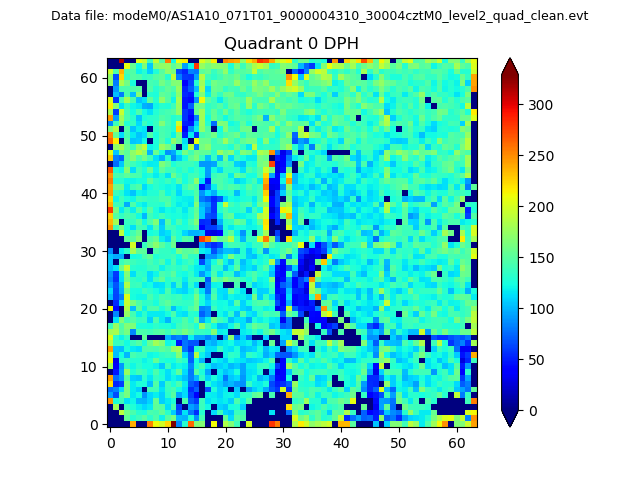 |
 |
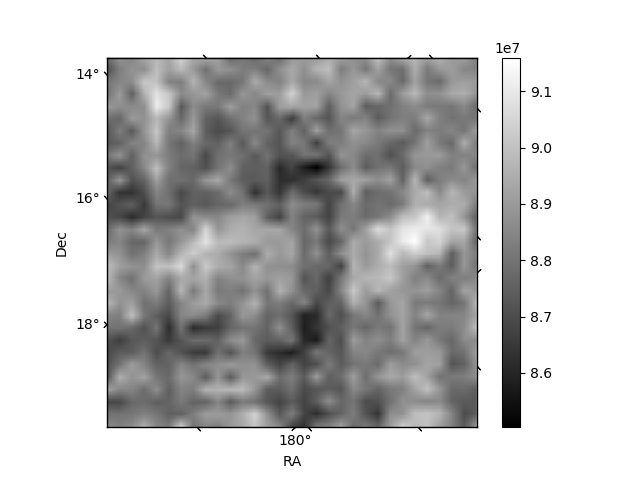
Quadrant B |
|---|---|---|---|
| Quadrant D | 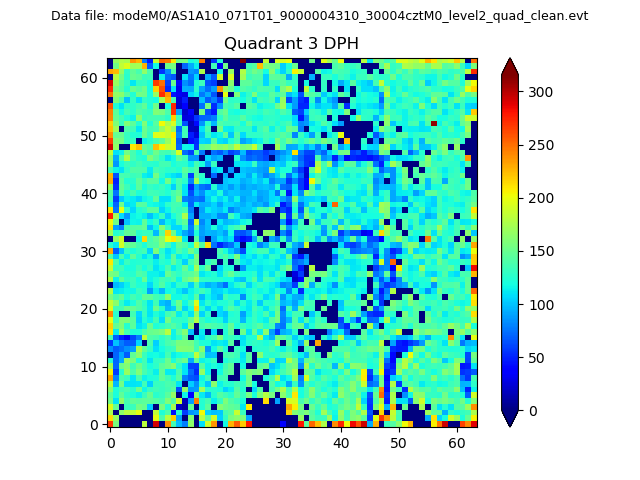 |
 |
Quadrant C |
| Plot type | Count rate plots | Images |
|---|---|---|
| Comparison with Poisson distribution Blue bars denote a histogram of data divided into 1 sec bins. Red curve is a Poisson curve with rate = median count rate of data. |
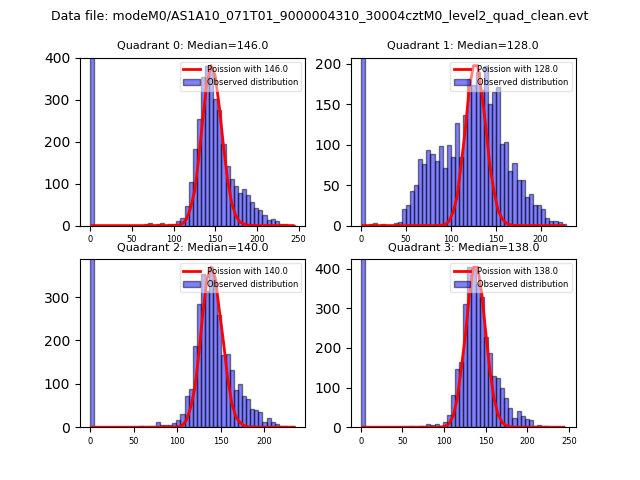 |
 |
| Quadrant-wise count rates Data is divided into 100 sec bins |
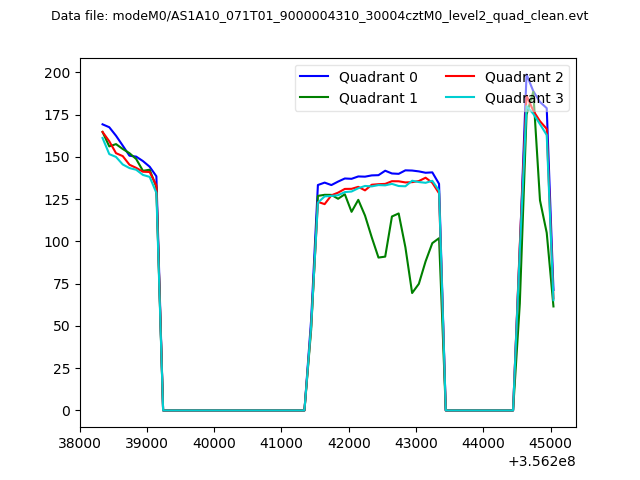 |
|
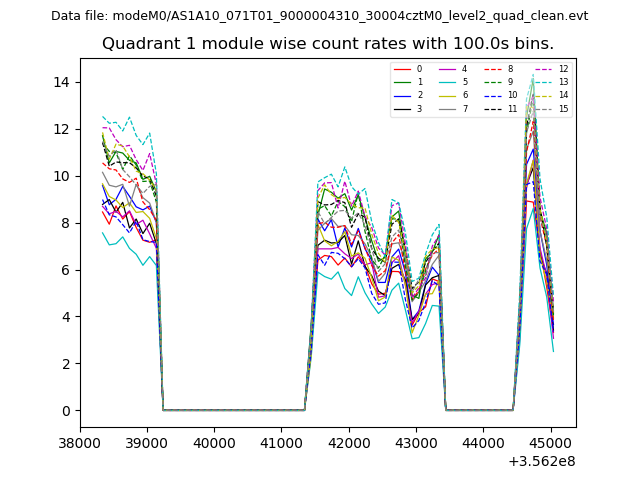
| Module-wise count rates for Quadrant A Data is divided into 100 sec bins |
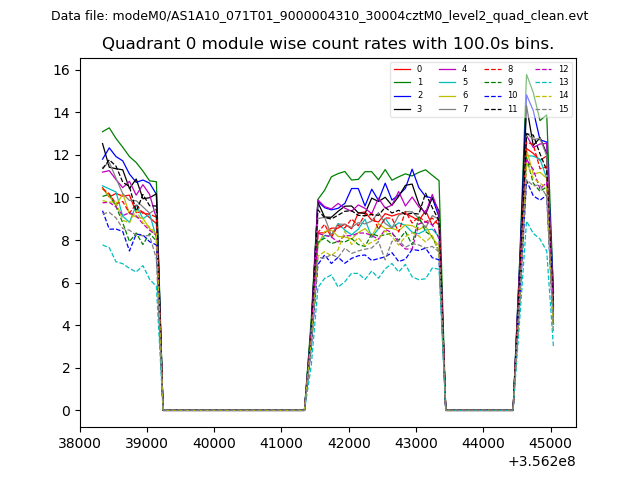 |
 |
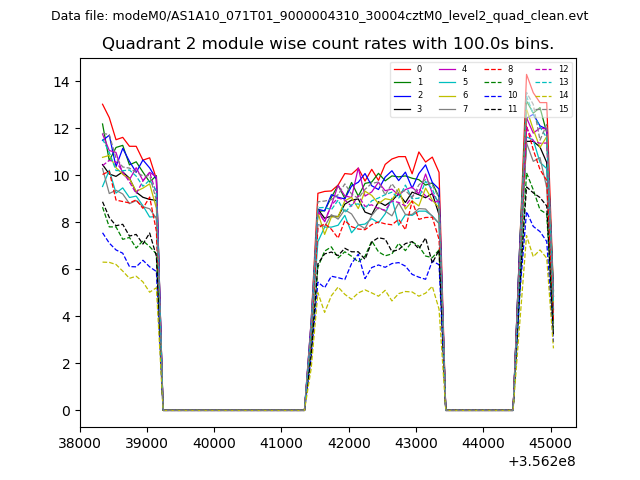
| Module-wise count rates for Quadrant B Data is divided into 100 sec bins |
 |
 |
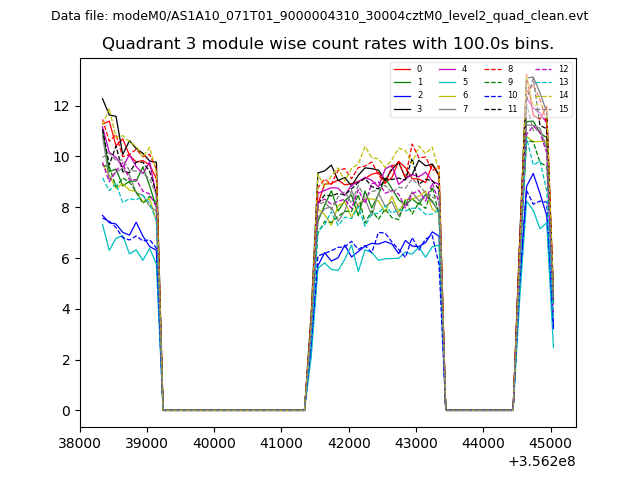
| Module-wise count rates for Quadrant C Data is divided into 100 sec bins |
 |
 |
| Module-wise count rates for Quadrant D Data is divided into 100 sec bins |
 |
 |
| Parameter | Plot |
|---|---|
| CZT HV Monitor | 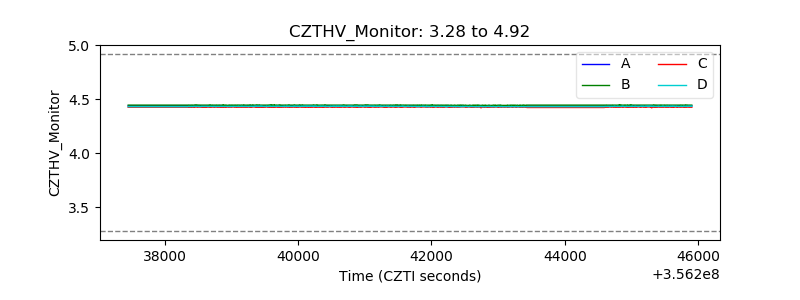 |
| D_VDD | 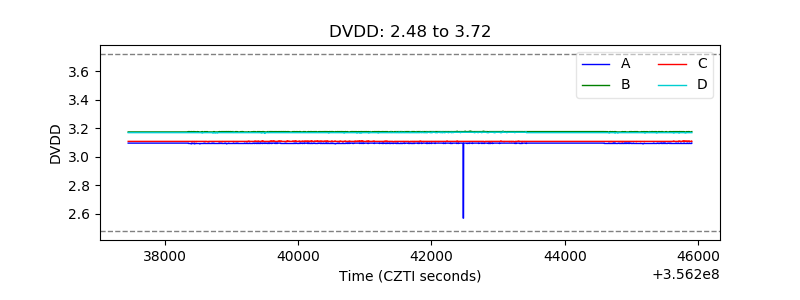 |
| Temperature 1 |  |
| Veto HV Monitor | 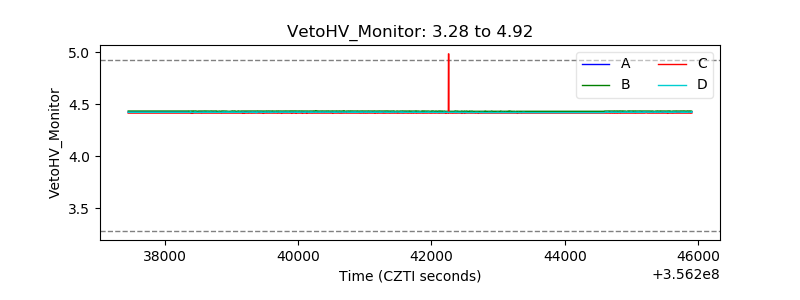 |
| Veto LLD |  |
| Alpha Counter | 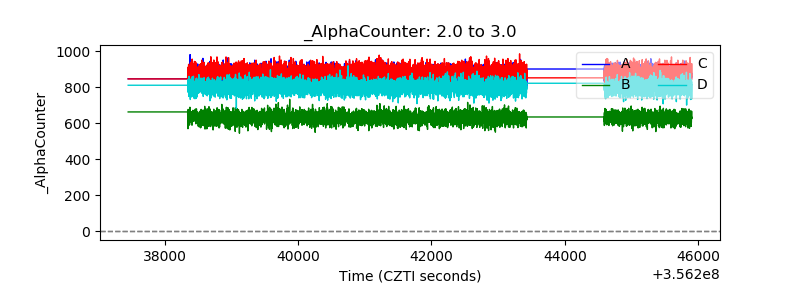 |
| _CPM_Rate | 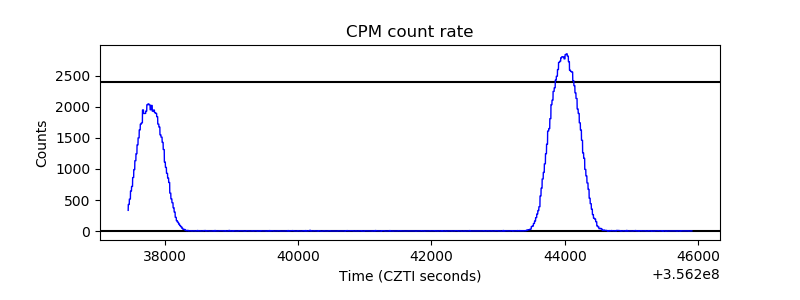 |
| CZT Counter | 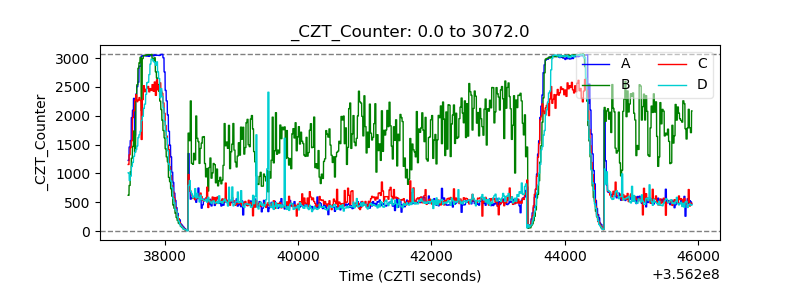 |
| +2.5 Volts monitor |  |
| +5 Volts monitor |  |
| _ROLL_ROT | 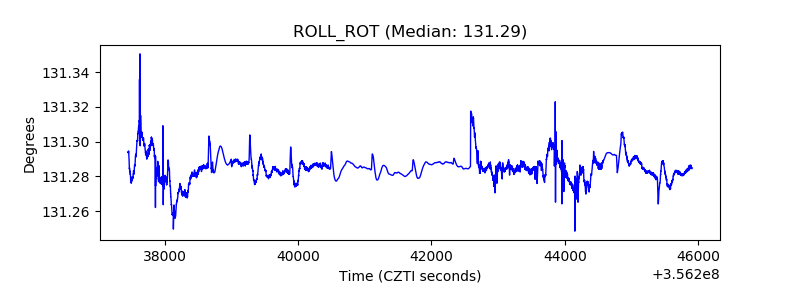 |
| _Roll_DEC | 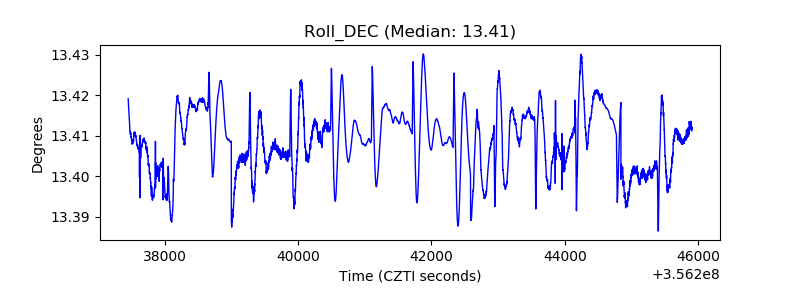 |
| _Roll_RA | 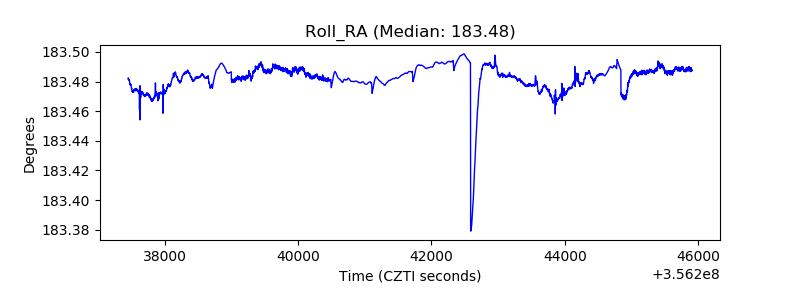 |
| Veto Counter | 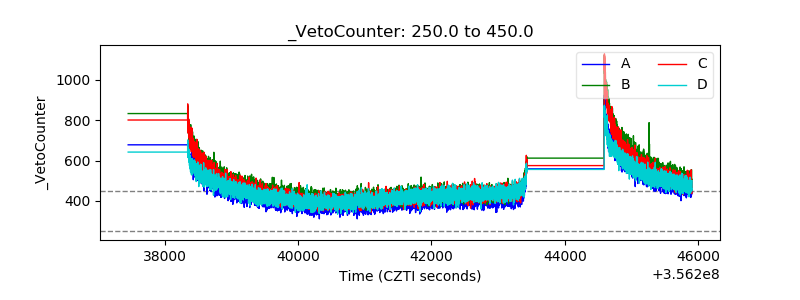 |