| Param | Original file | Final file |
|---|---|---|
| Filename | modeM0/AS1A10_071T01_9000004310_30006cztM0_level2.evt | modeM0/AS1A10_071T01_9000004310_30006cztM0_level2_quad_clean.evt |
| Size (bytes) | 630,339,840 | 67,250,880 |
| Size | 601.1 MB | 64.1 MB |
| Events in quadrant A | 3,588,776 | 411,432 |
| Events in quadrant B | 7,381,919 | 406,604 |
| Events in quadrant C | 3,603,393 | 390,728 |
| Events in quadrant D | 4,090,666 | 388,138 |
| Mode SS | |||
|---|---|---|---|
| Quadrant | BADHDUFLAG | Total packets | Discarded packets |
| A | 0 | 128 | 0 |
| B | 0 | 128 | 0 |
| C | 0 | 128 | 0 |
| D | 0 | 128 | 0 |
| Mode M0 | |||
|---|---|---|---|
| Quadrant | BADHDUFLAG | Total packets | Discarded packets |
| A | 0 | 14361 | 2 |
| B | 0 | 26276 | 7 |
| C | 0 | 14508 | 2 |
| D | 0 | 15952 | 2 |
| Mode M9 | |||
|---|---|---|---|
| Quadrant | BADHDUFLAG | Total packets | Discarded packets |
| A | 0 | 16 | 0 |
| B | 0 | 17 | 0 |
| C | 0 | 17 | 0 |
| D | 0 | 17 | 0 |
| Quadrant | Total seconds | Saturated seconds | Saturation percentage |
|---|---|---|---|
| A | 6292 | 99 | 1.573427% |
| B | 6291 | 718 | 11.413130% |
| C | 6291 | 139 | 2.209506% |
| D | 6291 | 239 | 3.799078% |
Noise dominated data is calculated using 1-second bins in cleaned event files. If a bin has >2000 counts, and if more than 50% of those come from <1% of pixels, then it is considered to be noise-dominated and hence unusable.
| Quadrant | # 1 sec bins | Bins with >0 counts | Bins with >2000 counts | High rate bins dominated by noise | Noise dominated (total time) | Noise dominated (detector-on time) | Marked lightcurve |
|---|---|---|---|---|---|---|---|
| A | 7567 | 6293 | 1 | 1 | 0.01% | 0.02% |  |
| B | 7566 | 6292 | 195 | 195 | 2.58% | 3.10% |  |
| C | 7566 | 6292 | 0 | 0 | 0.00% | 0.00% | 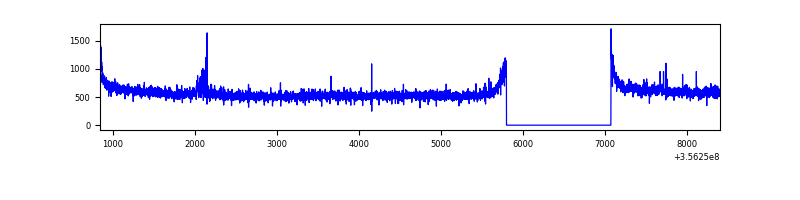 |
| D | 7566 | 6292 | 176 | 176 | 2.33% | 2.80% | 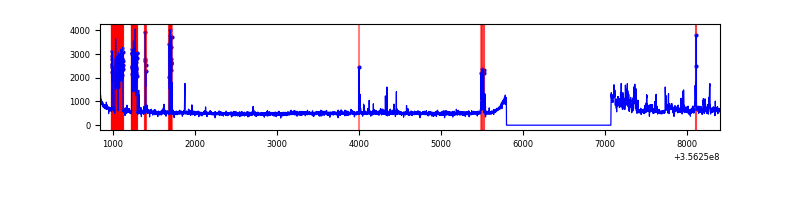 |
Top three noisy pixels from each quadrant. If the there are fewer than three noisy pixels in the level2.evt file, extra rows are filled as -1
| Pixel properties | Quadrant properties | ||||||
|---|---|---|---|---|---|---|---|
| Quadrant | DetID | PixID | Counts | Sigma | Mean | Median | Sigma |
| A | 8 | 192 | 31462 | 168.16 | 919 | 903 | 181.7 |
| A | 13 | 254 | 11183 | 56.57 | 919 | 903 | 181.7 |
| A | 3 | 1 | 8895 | 43.98 | 919 | 903 | 181.7 |
| B | 6 | 36 | 2230674 | 13436.14 | 887 | 868 | 166.0 |
| B | 6 | 159 | 1648811 | 9930.01 | 887 | 868 | 166.0 |
| B | 12 | 111 | 19636 | 113.09 | 887 | 868 | 166.0 |
| C | 14 | 238 | 143897 | 718.53 | 858 | 866 | 199.1 |
| C | 3 | 233 | 99637 | 496.19 | 858 | 866 | 199.1 |
| C | 2 | 114 | 14714 | 69.57 | 858 | 866 | 199.1 |
| D | 11 | 135 | 421467 | 2077.79 | 857 | 840 | 202.4 |
| D | 7 | 80 | 277751 | 1367.87 | 857 | 840 | 202.4 |
| D | 8 | 195 | 80568 | 393.84 | 857 | 840 | 202.4 |
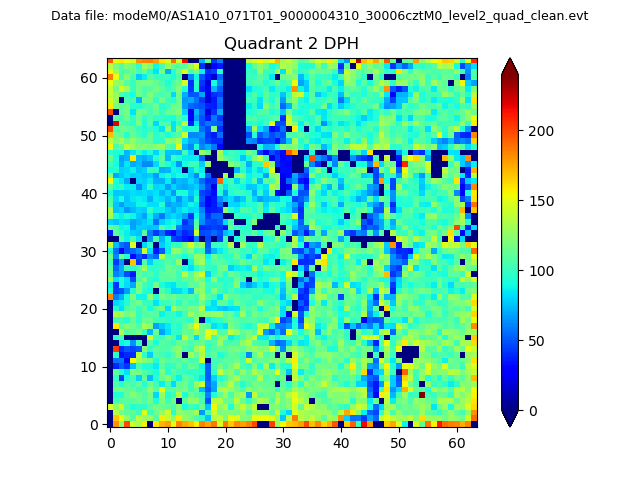
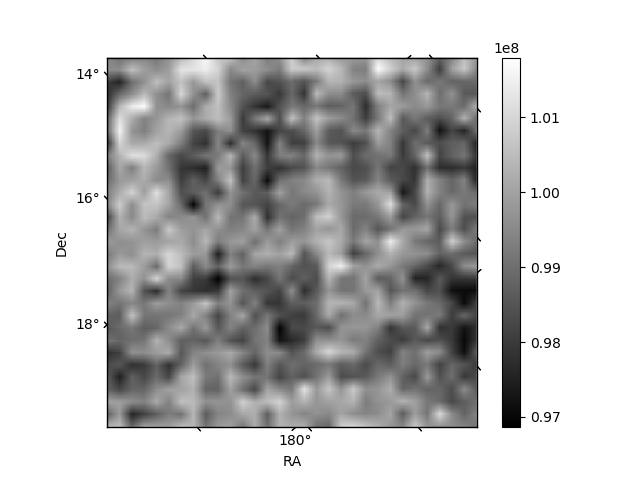
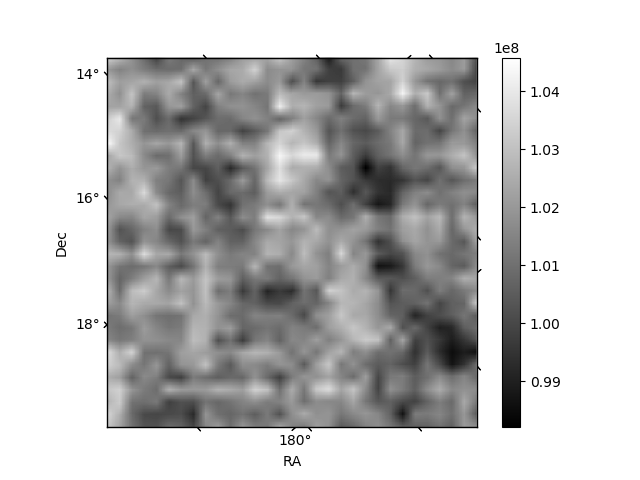
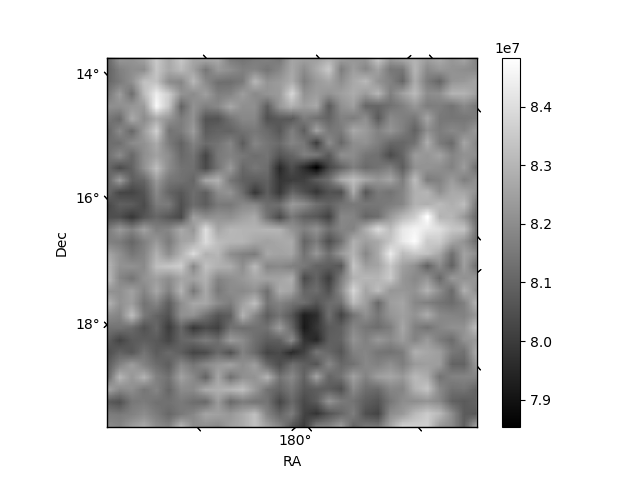
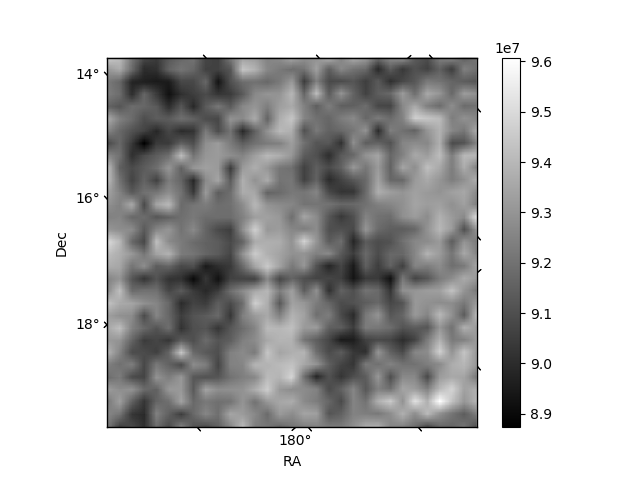
Histogram calculated using DETX and DETY for each event in the final _common_clean file
| Quadrant A | 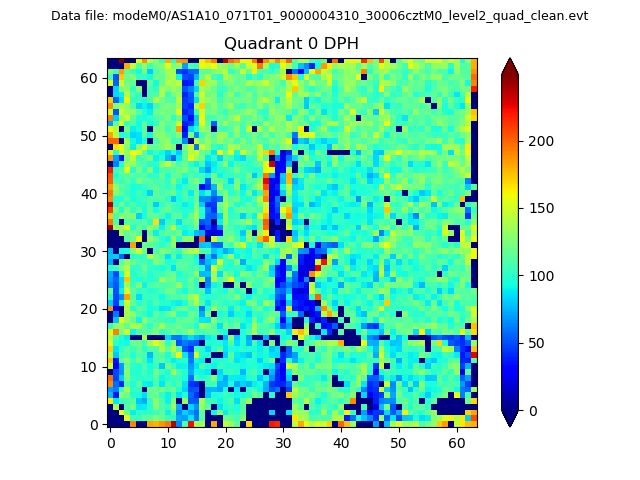 |
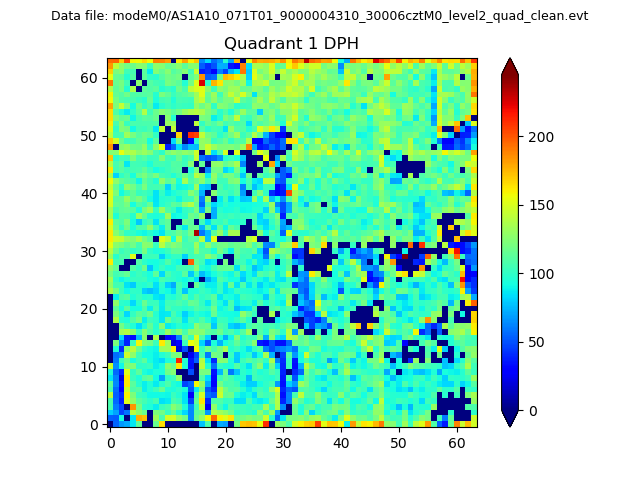 |
Quadrant B |
|---|---|---|---|
| Quadrant D | 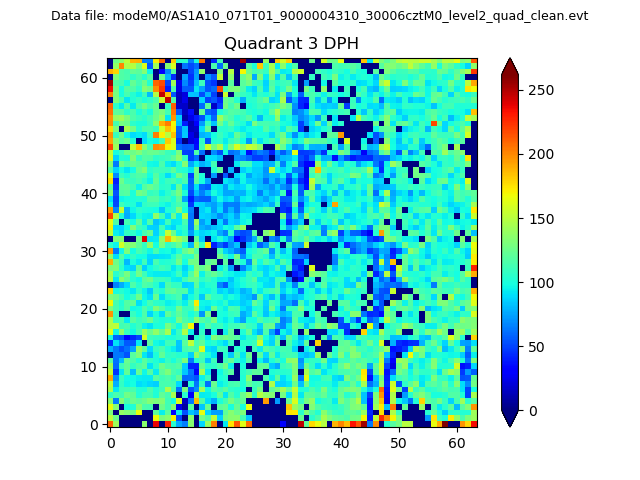 |
 |
Quadrant C |
| Plot type | Count rate plots | Images |
|---|---|---|
| Comparison with Poisson distribution Blue bars denote a histogram of data divided into 1 sec bins. Red curve is a Poisson curve with rate = median count rate of data. |
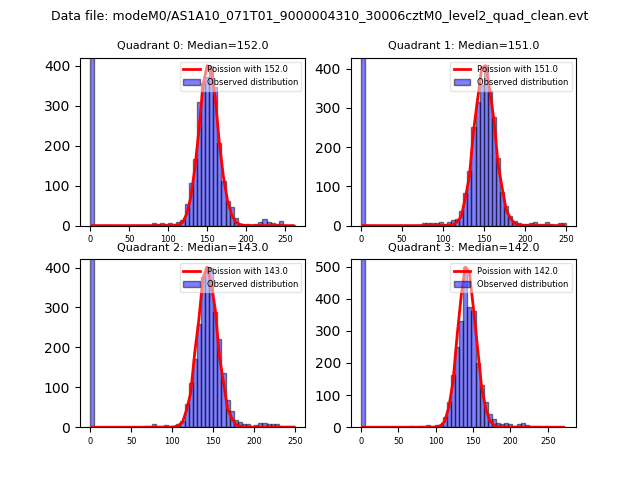 |
 |
| Quadrant-wise count rates Data is divided into 100 sec bins |
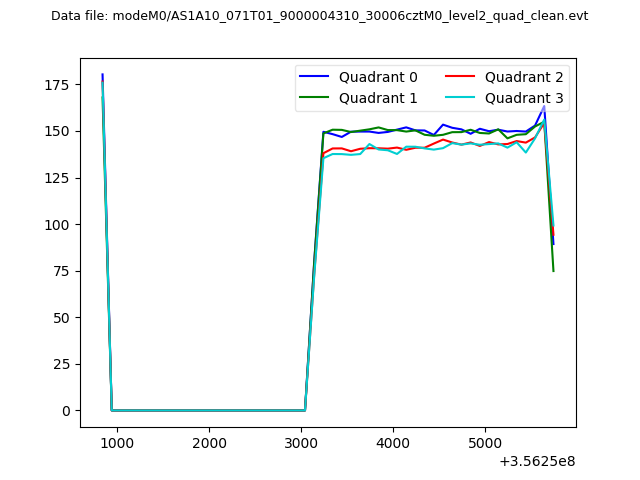 |
|
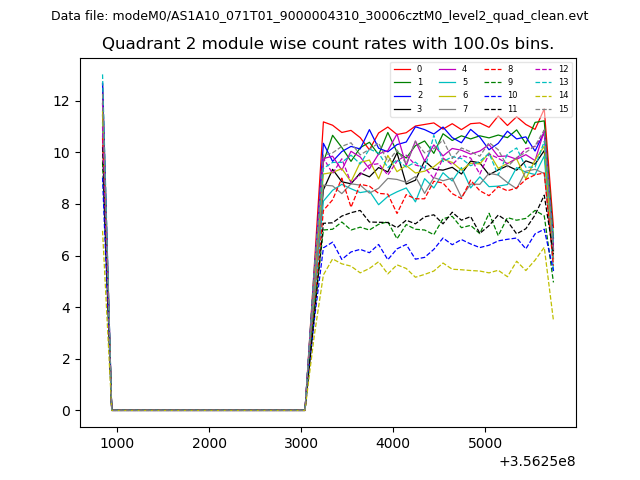
| Module-wise count rates for Quadrant A Data is divided into 100 sec bins |
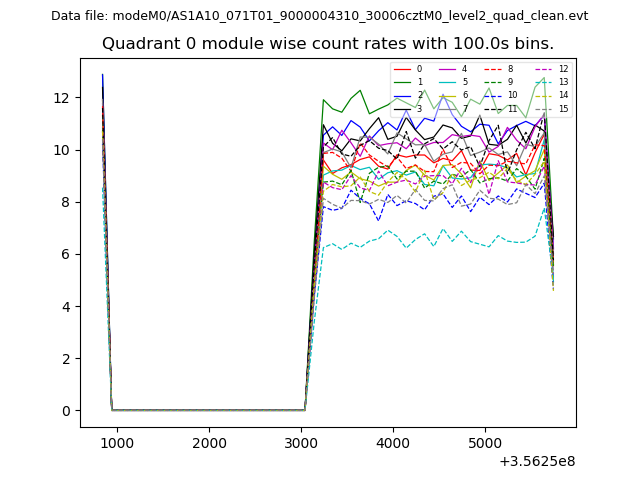 |
 |
| Module-wise count rates for Quadrant B Data is divided into 100 sec bins |
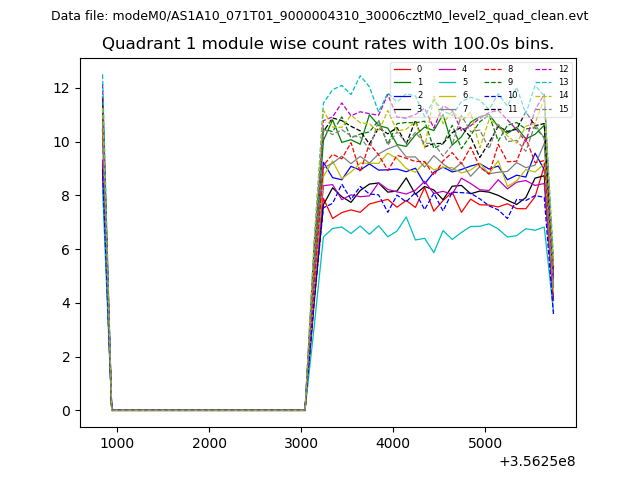 |
 |
| Module-wise count rates for Quadrant C Data is divided into 100 sec bins |
 |
 |
| Module-wise count rates for Quadrant D Data is divided into 100 sec bins |
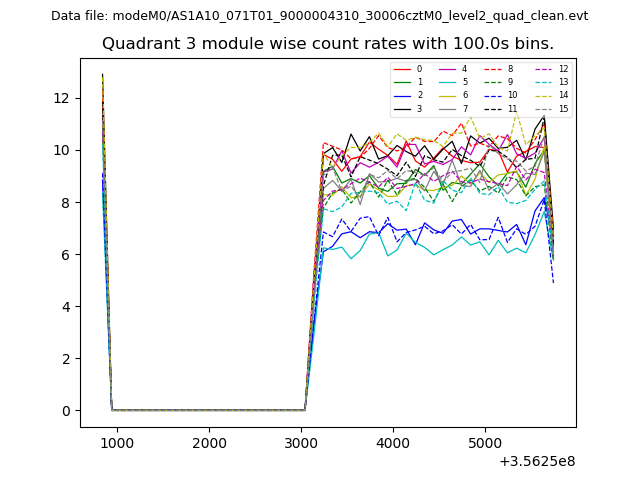 |
 |
| Parameter | Plot |
|---|---|
| CZT HV Monitor | 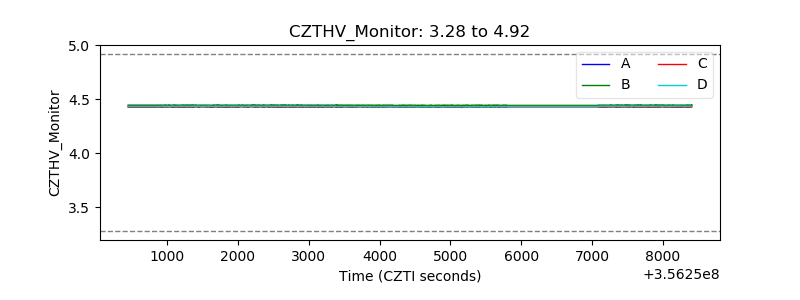 |
| D_VDD | 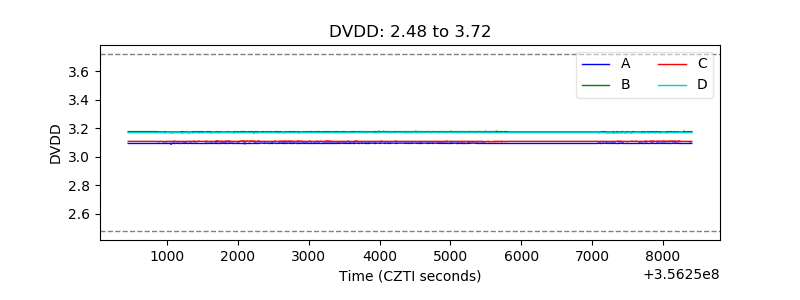 |
| Temperature 1 |  |
| Veto HV Monitor | 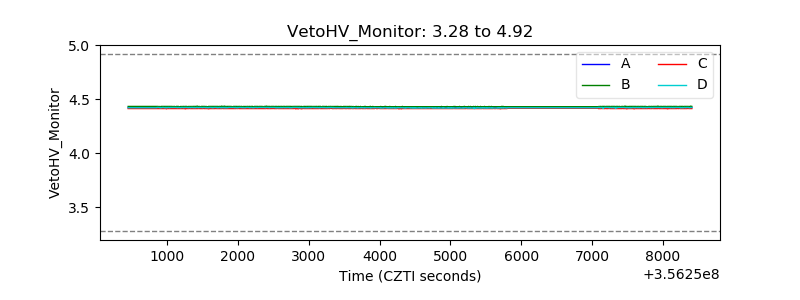 |
| Veto LLD | 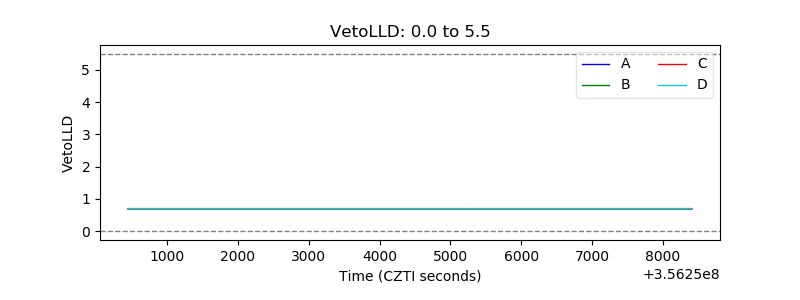 |
| Alpha Counter | 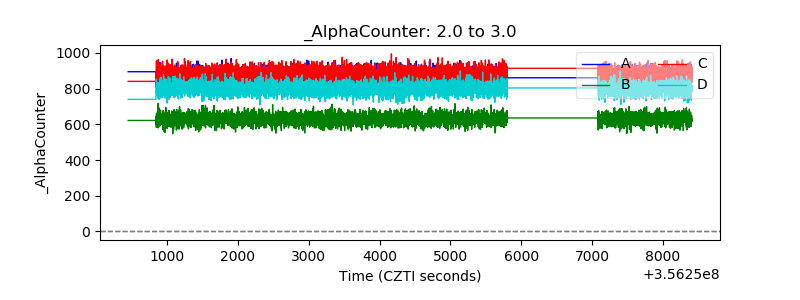 |
| _CPM_Rate | 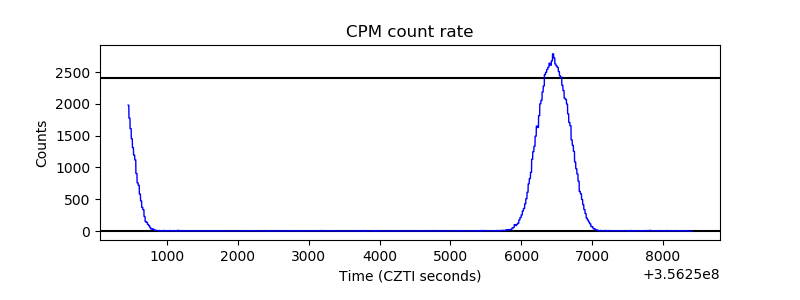 |
| CZT Counter | 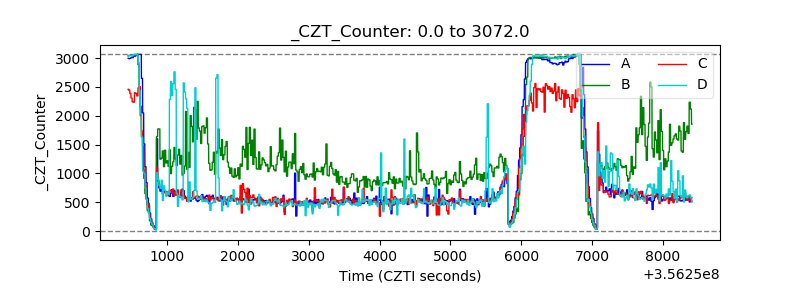 |
| +2.5 Volts monitor | 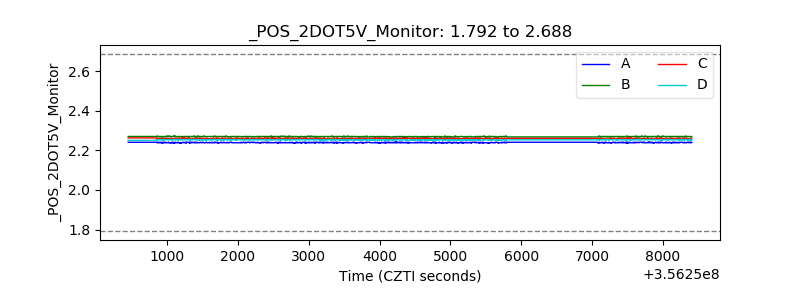 |
| +5 Volts monitor |  |
| _ROLL_ROT | 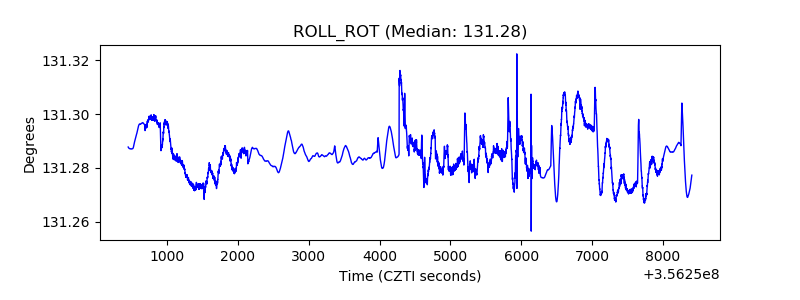 |
| _Roll_DEC | 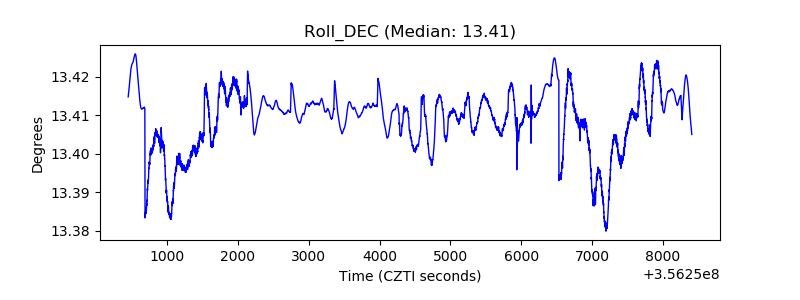 |
| _Roll_RA | 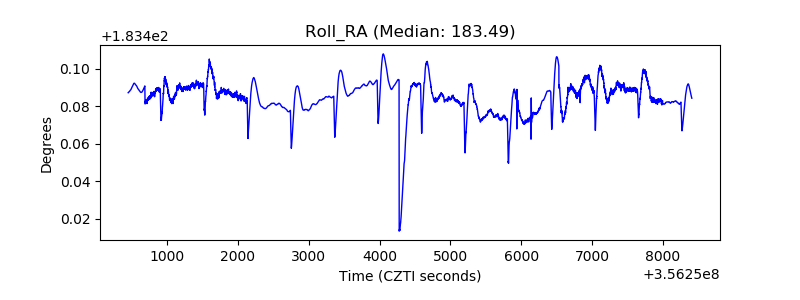 |
| Veto Counter | 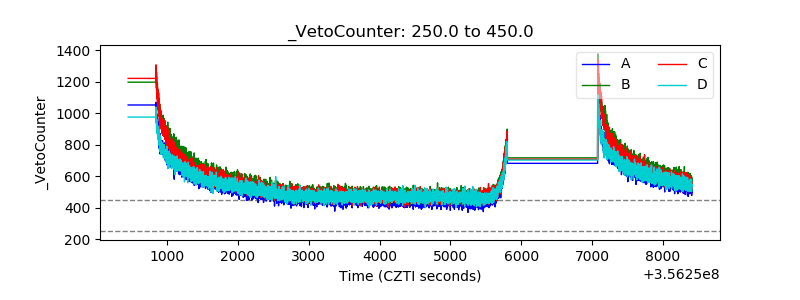 |