| Param | Original file | Final file |
|---|---|---|
| Filename | modeM0/AS1A10_071T01_9000004310_30007cztM0_level2.evt | modeM0/AS1A10_071T01_9000004310_30007cztM0_level2_quad_clean.evt |
| Size (bytes) | 720,936,000 | 71,671,680 |
| Size | 687.5 MB | 68.4 MB |
| Events in quadrant A | 3,675,561 | 457,924 |
| Events in quadrant B | 7,890,494 | 444,399 |
| Events in quadrant C | 3,992,494 | 429,834 |
| Events in quadrant D | 5,839,928 | 387,135 |
| Mode SS | |||
|---|---|---|---|
| Quadrant | BADHDUFLAG | Total packets | Discarded packets |
| A | 0 | 132 | 0 |
| B | 0 | 132 | 0 |
| C | 0 | 132 | 0 |
| D | 0 | 132 | 0 |
| Mode M0 | |||
|---|---|---|---|
| Quadrant | BADHDUFLAG | Total packets | Discarded packets |
| A | 0 | 14702 | 2 |
| B | 0 | 28029 | 2 |
| C | 0 | 16384 | 2 |
| D | 0 | 21711 | 2 |
| Mode M9 | |||
|---|---|---|---|
| Quadrant | BADHDUFLAG | Total packets | Discarded packets |
| A | 0 | 17 | 0 |
| B | 0 | 18 | 0 |
| C | 0 | 18 | 0 |
| D | 0 | 18 | 0 |
| Quadrant | Total seconds | Saturated seconds | Saturation percentage |
|---|---|---|---|
| A | 6455 | 94 | 1.456235% |
| B | 6455 | 693 | 10.735864% |
| C | 6455 | 146 | 2.261813% |
| D | 6455 | 649 | 10.054222% |
Noise dominated data is calculated using 1-second bins in cleaned event files. If a bin has >2000 counts, and if more than 50% of those come from <1% of pixels, then it is considered to be noise-dominated and hence unusable.
| Quadrant | # 1 sec bins | Bins with >0 counts | Bins with >2000 counts | High rate bins dominated by noise | Noise dominated (total time) | Noise dominated (detector-on time) | Marked lightcurve |
|---|---|---|---|---|---|---|---|
| A | 7785 | 6456 | 1 | 1 | 0.01% | 0.02% | 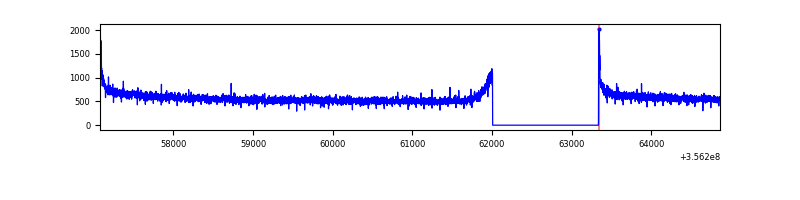 |
| B | 7785 | 6456 | 145 | 145 | 1.86% | 2.25% | 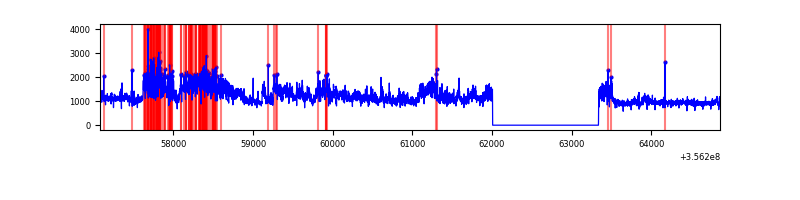 |
| C | 7785 | 6456 | 0 | 0 | 0.00% | 0.00% | 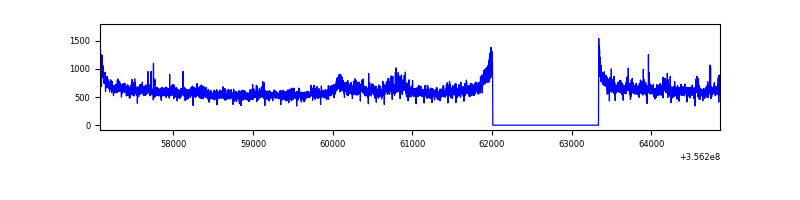 |
| D | 7785 | 6456 | 479 | 479 | 6.15% | 7.42% | 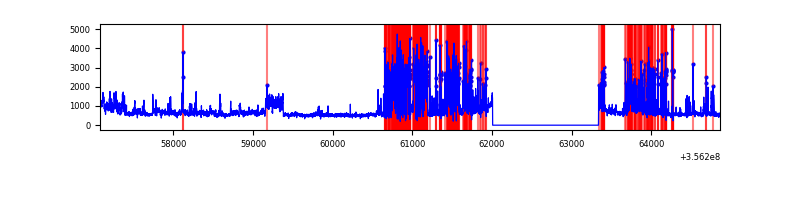 |
Top three noisy pixels from each quadrant. If the there are fewer than three noisy pixels in the level2.evt file, extra rows are filled as -1
| Pixel properties | Quadrant properties | ||||||
|---|---|---|---|---|---|---|---|
| Quadrant | DetID | PixID | Counts | Sigma | Mean | Median | Sigma |
| A | 8 | 192 | 30245 | 157.08 | 944 | 930 | 186.6 |
| A | 13 | 254 | 10897 | 53.41 | 944 | 930 | 186.6 |
| A | 3 | 137 | 8647 | 41.35 | 944 | 930 | 186.6 |
| B | 6 | 36 | 2555679 | 14976.47 | 912 | 894 | 170.6 |
| B | 6 | 159 | 1728703 | 10128.63 | 912 | 894 | 170.6 |
| B | 12 | 111 | 20546 | 115.2 | 912 | 894 | 170.6 |
| C | 3 | 233 | 393846 | 1931.84 | 882 | 891 | 203.4 |
| C | 14 | 238 | 145415 | 710.51 | 882 | 891 | 203.4 |
| C | 2 | 114 | 15100 | 69.85 | 882 | 891 | 203.4 |
| D | 7 | 80 | 2349201 | 11648.24 | 856 | 839 | 201.6 |
| D | 8 | 195 | 175260 | 865.15 | 856 | 839 | 201.6 |
| D | 11 | 135 | 55112 | 269.2 | 856 | 839 | 201.6 |
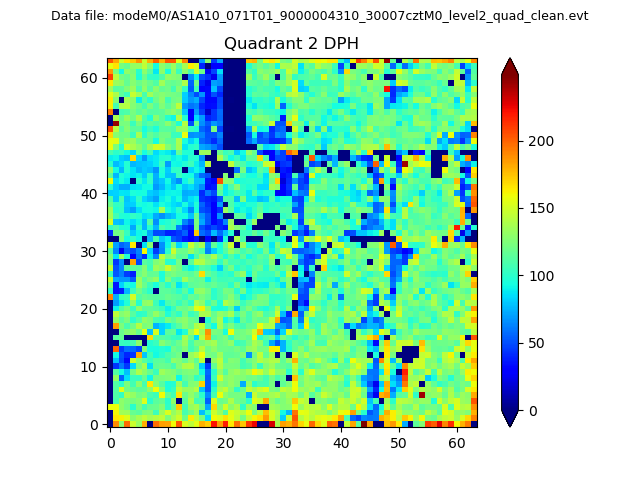
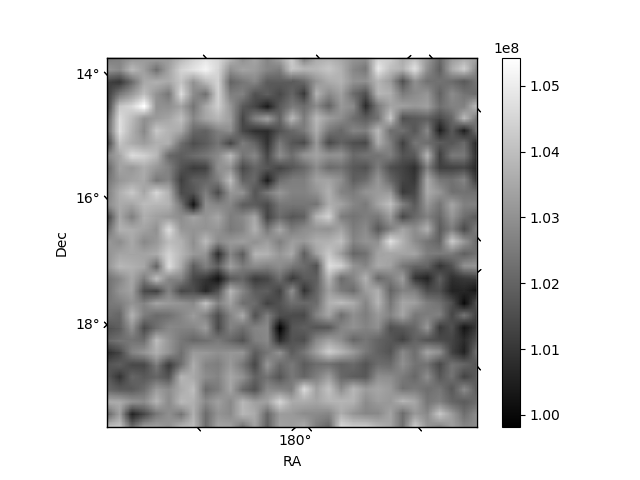
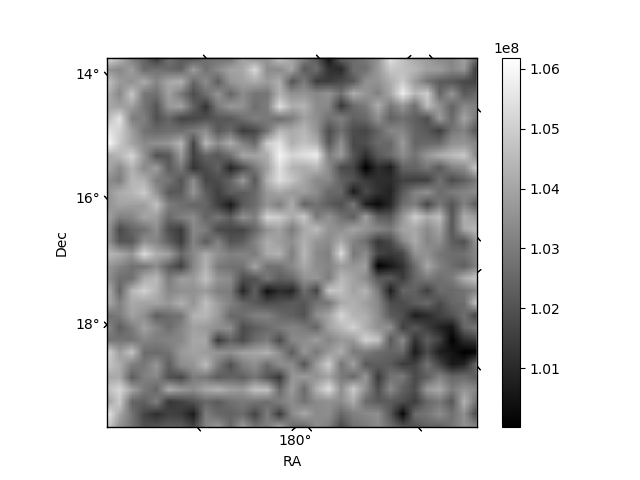
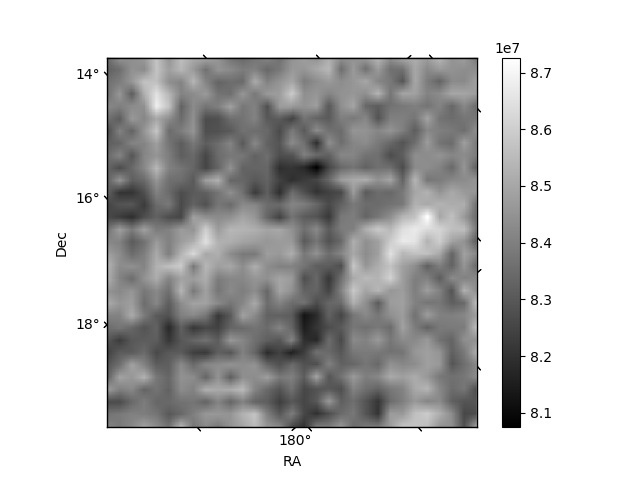
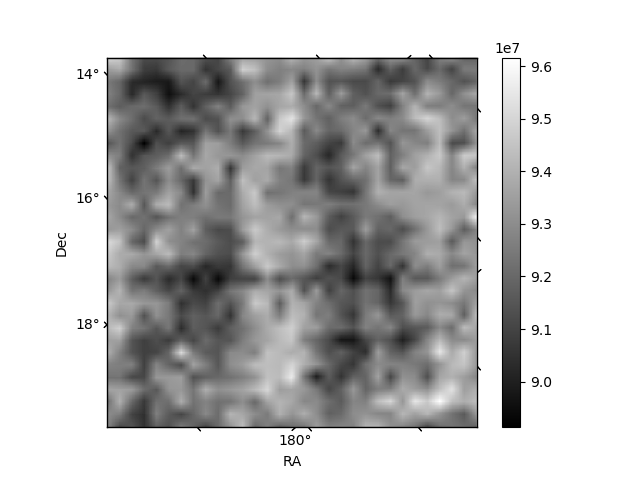
Histogram calculated using DETX and DETY for each event in the final _common_clean file
| Quadrant A | 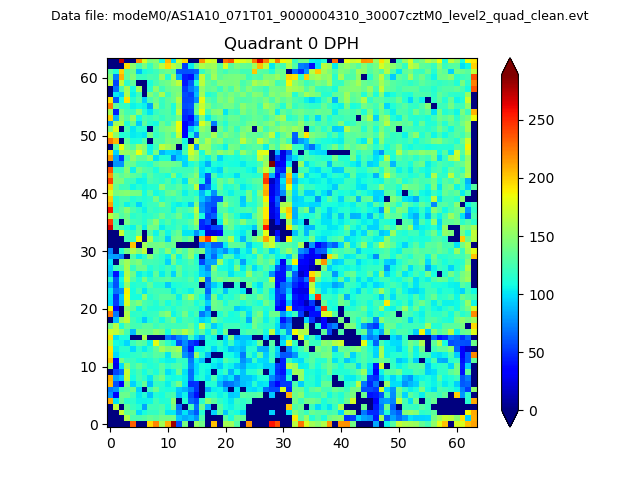 |
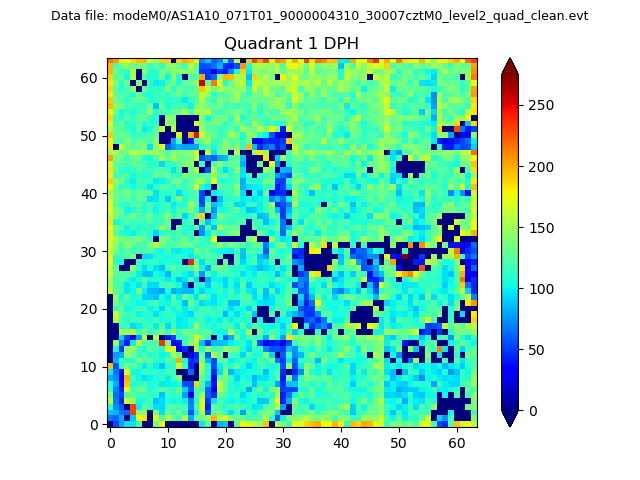 |
Quadrant B |
|---|---|---|---|
| Quadrant D | 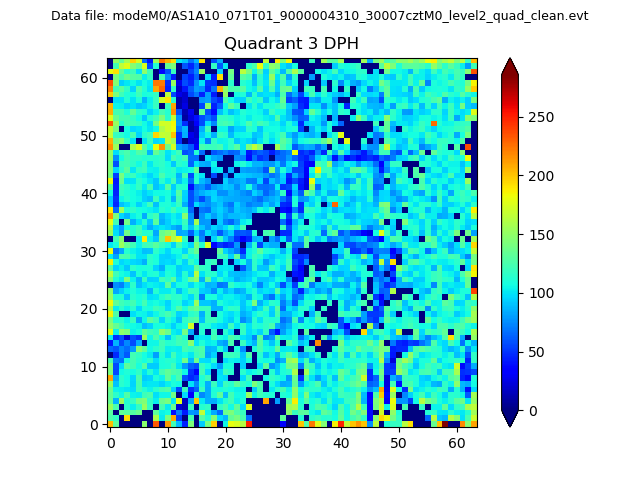 |
 |
Quadrant C |
| Plot type | Count rate plots | Images |
|---|---|---|
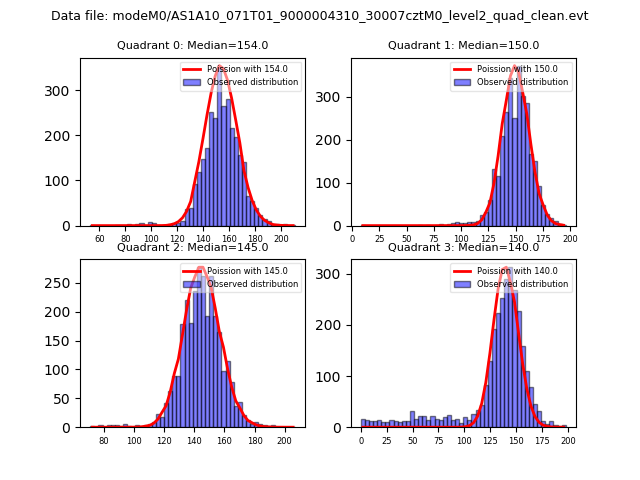
| Comparison with Poisson distribution Blue bars denote a histogram of data divided into 1 sec bins. Red curve is a Poisson curve with rate = median count rate of data. |
 |
 |
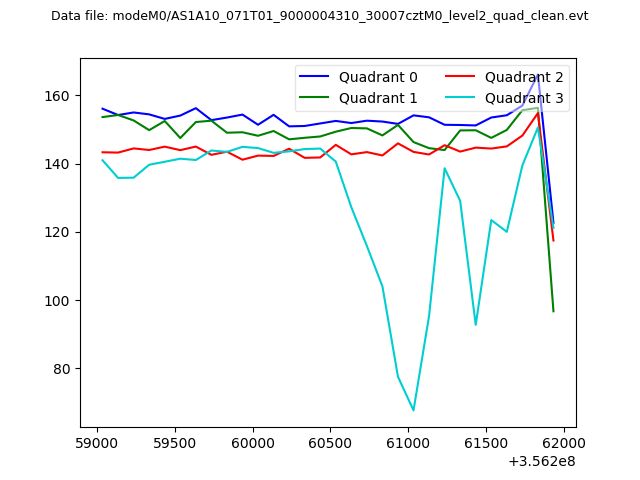
| Quadrant-wise count rates Data is divided into 100 sec bins |
 |
|
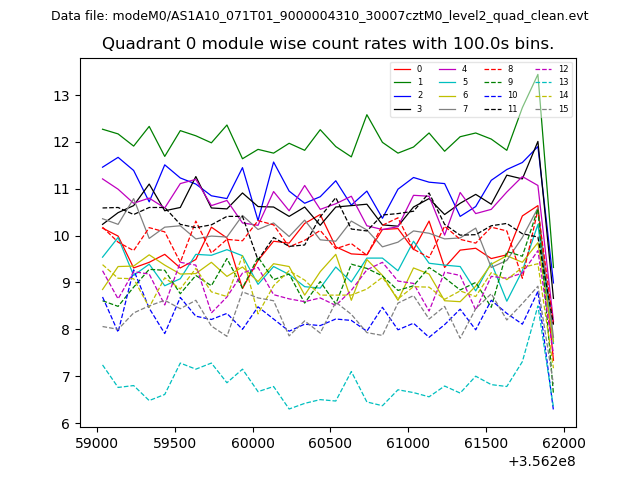
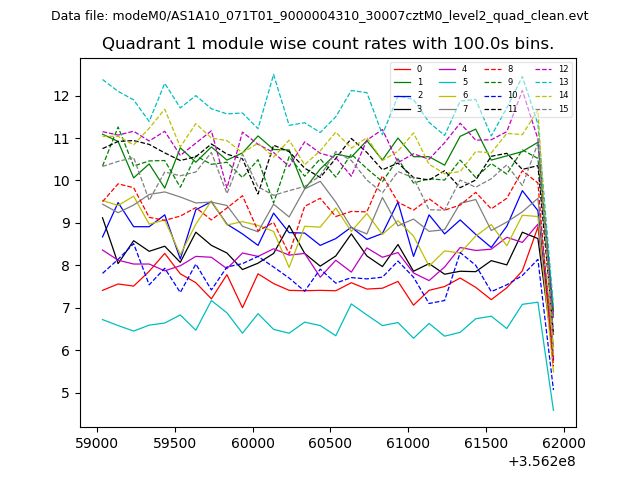
| Module-wise count rates for Quadrant A Data is divided into 100 sec bins |
 |
 |
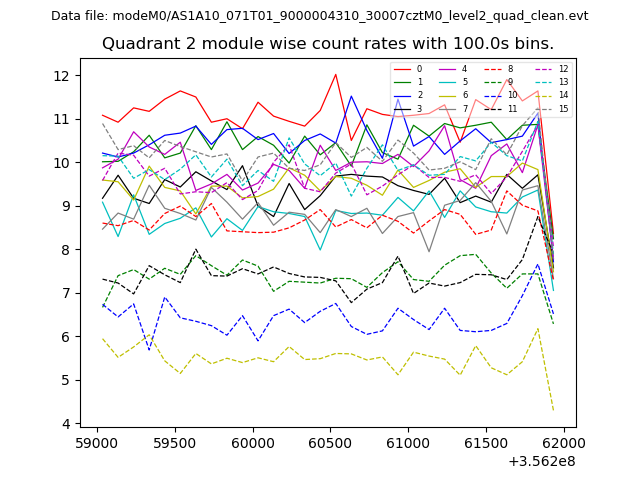
| Module-wise count rates for Quadrant B Data is divided into 100 sec bins |
 |
 |
| Module-wise count rates for Quadrant C Data is divided into 100 sec bins |
 |
 |
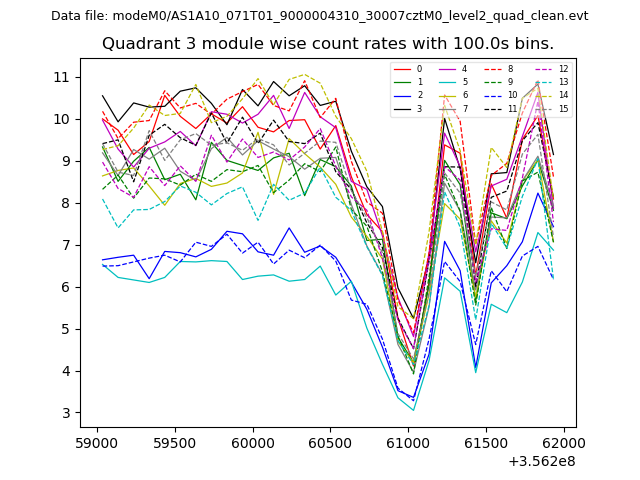
| Module-wise count rates for Quadrant D Data is divided into 100 sec bins |
 |
 |
| Parameter | Plot |
|---|---|
| CZT HV Monitor | 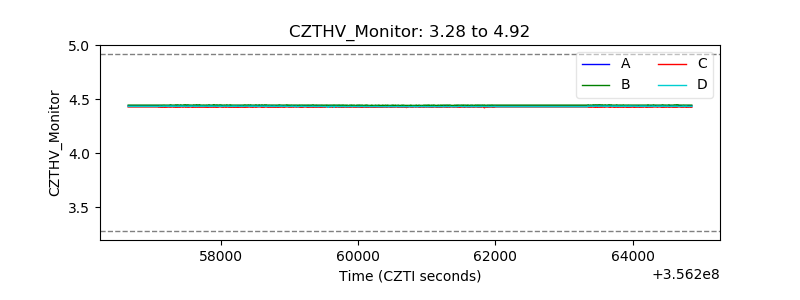 |
| D_VDD | 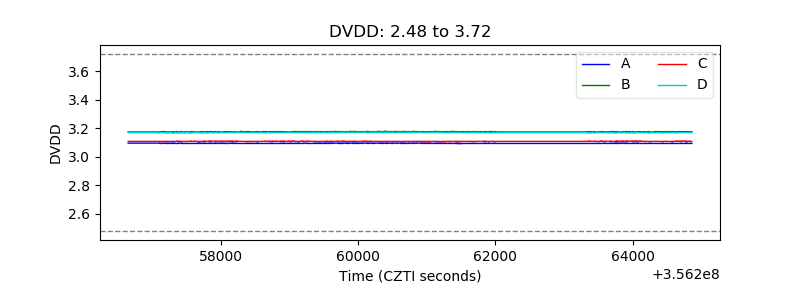 |
| Temperature 1 | 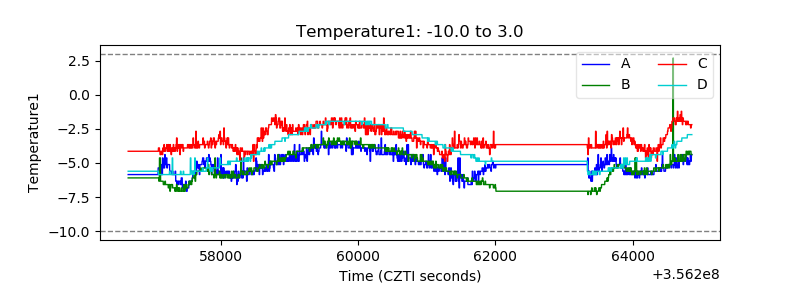 |
| Veto HV Monitor | 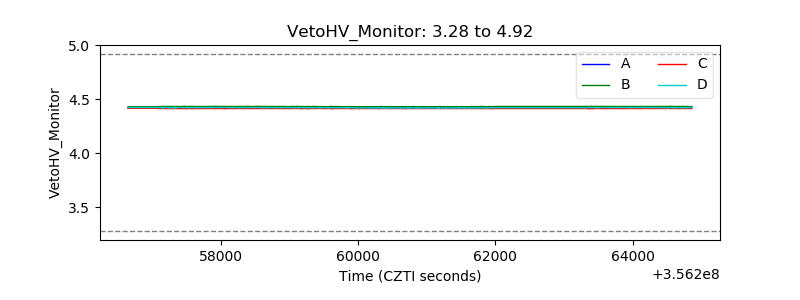 |
| Veto LLD | 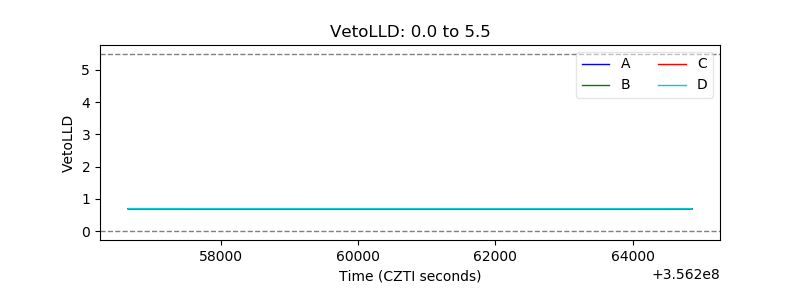 |
| Alpha Counter | 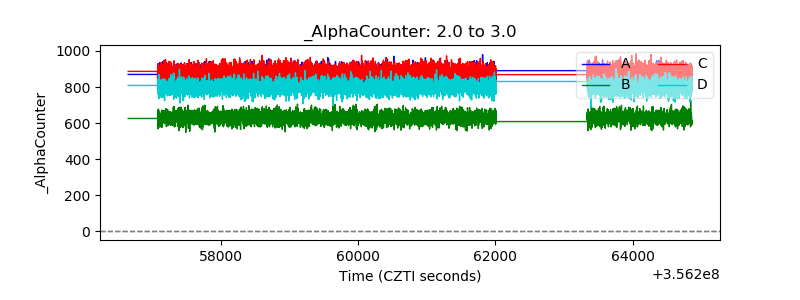 |
| _CPM_Rate | 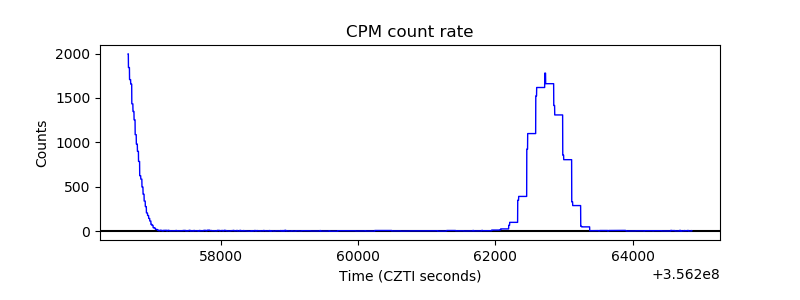 |
| CZT Counter | 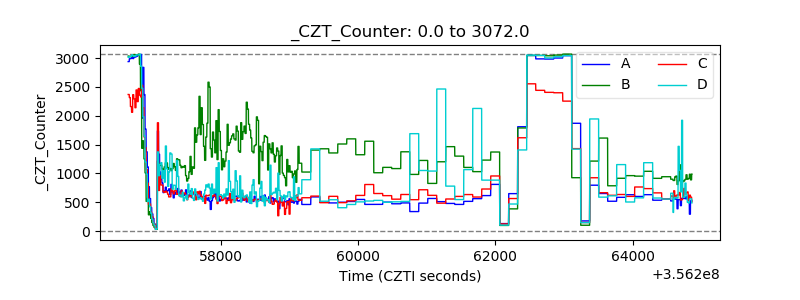 |
| +2.5 Volts monitor |  |
| +5 Volts monitor |  |
| _ROLL_ROT | 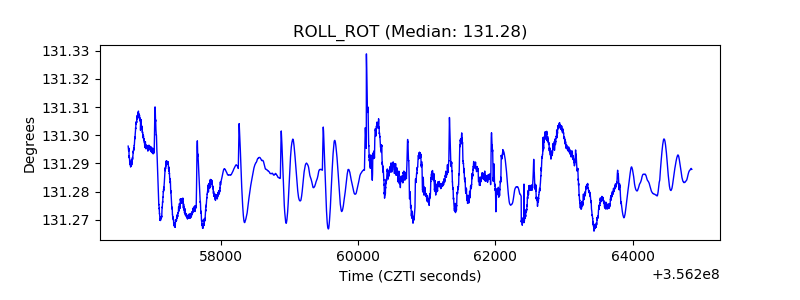 |
| _Roll_DEC | 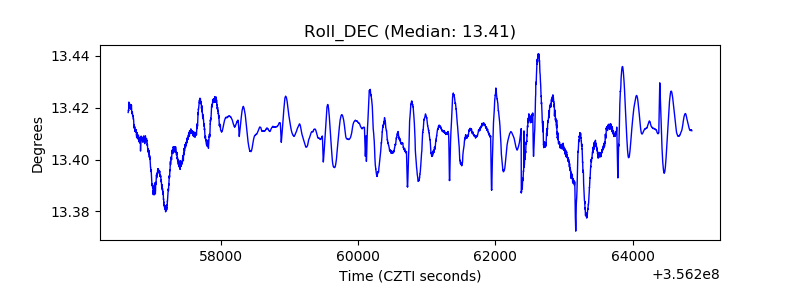 |
| _Roll_RA | 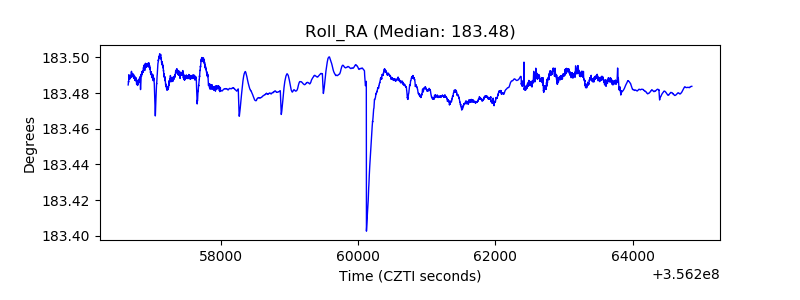 |
| Veto Counter | 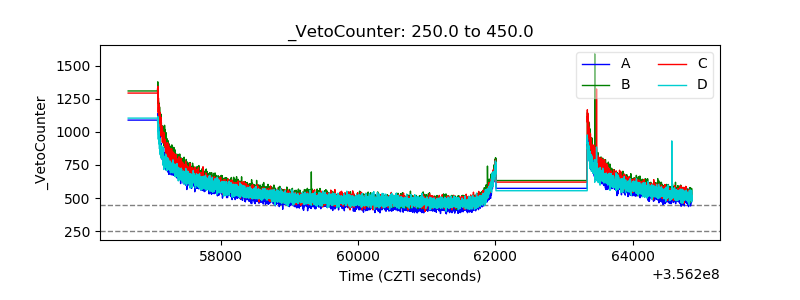 |