| Param | Original file | Final file |
|---|---|---|
| Filename | modeM0/AS1A10_071T01_9000004310_30008cztM0_level2.evt | modeM0/AS1A10_071T01_9000004310_30008cztM0_level2_quad_clean.evt |
| Size (bytes) | 347,774,400 | 35,876,160 |
| Size | 331.7 MB | 34.2 MB |
| Events in quadrant A | 1,719,141 | 238,254 |
| Events in quadrant B | 3,570,060 | 213,176 |
| Events in quadrant C | 1,861,260 | 221,728 |
| Events in quadrant D | 3,170,649 | 191,567 |
| Mode SS | |||
|---|---|---|---|
| Quadrant | BADHDUFLAG | Total packets | Discarded packets |
| A | 0 | 62 | 0 |
| B | 0 | 62 | 0 |
| C | 0 | 62 | 0 |
| D | 0 | 62 | 0 |
| Mode M0 | |||
|---|---|---|---|
| Quadrant | BADHDUFLAG | Total packets | Discarded packets |
| A | 0 | 6857 | 1 |
| B | 0 | 12660 | 1 |
| C | 0 | 7595 | 1 |
| D | 0 | 11539 | 1 |
| Mode M9 | |||
|---|---|---|---|
| Quadrant | BADHDUFLAG | Total packets | Discarded packets |
| A | 0 | 7 | 0 |
| B | 0 | 8 | 0 |
| C | 0 | 8 | 0 |
| D | 0 | 8 | 0 |
| Quadrant | Total seconds | Saturated seconds | Saturation percentage |
|---|---|---|---|
| A | 3105 | 22 | 0.708535% |
| B | 3105 | 406 | 13.075684% |
| C | 3105 | 58 | 1.867955% |
| D | 3105 | 455 | 14.653784% |
Noise dominated data is calculated using 1-second bins in cleaned event files. If a bin has >2000 counts, and if more than 50% of those come from <1% of pixels, then it is considered to be noise-dominated and hence unusable.
| Quadrant | # 1 sec bins | Bins with >0 counts | Bins with >2000 counts | High rate bins dominated by noise | Noise dominated (total time) | Noise dominated (detector-on time) | Marked lightcurve |
|---|---|---|---|---|---|---|---|
| A | 3105 | 3105 | 1 | 1 | 0.03% | 0.03% | 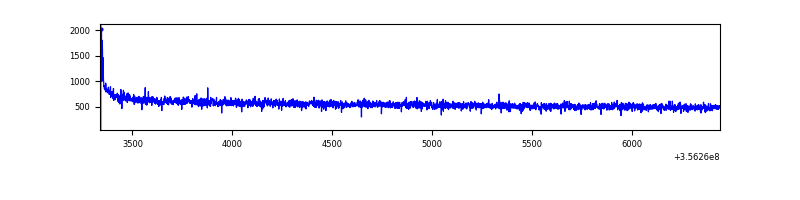 |
| B | 3105 | 3105 | 265 | 265 | 8.53% | 8.53% | 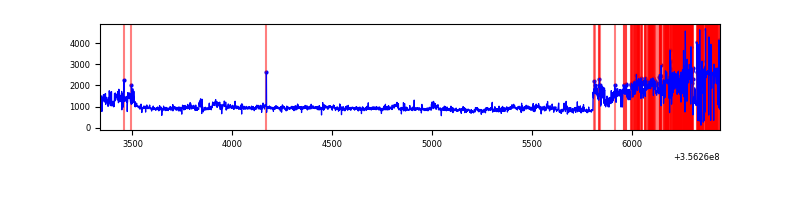 |
| C | 3105 | 3105 | 0 | 0 | 0.00% | 0.00% | 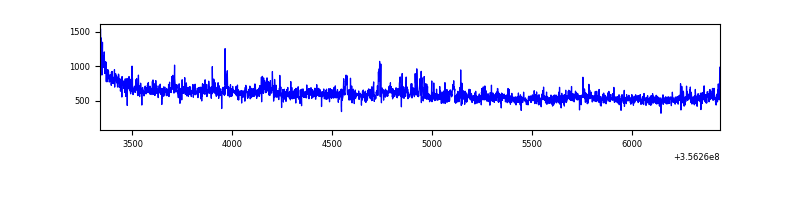 |
| D | 3104 | 3104 | 363 | 363 | 11.69% | 11.69% |  |
Top three noisy pixels from each quadrant. If the there are fewer than three noisy pixels in the level2.evt file, extra rows are filled as -1
| Pixel properties | Quadrant properties | ||||||
|---|---|---|---|---|---|---|---|
| Quadrant | DetID | PixID | Counts | Sigma | Mean | Median | Sigma |
| A | 8 | 192 | 15706 | 173.39 | 441 | 435 | 88.1 |
| A | 13 | 254 | 5429 | 56.7 | 441 | 435 | 88.1 |
| A | 3 | 137 | 3901 | 39.35 | 441 | 435 | 88.1 |
| B | 6 | 36 | 1153493 | 14572.98 | 416 | 407 | 79.1 |
| B | 6 | 159 | 775194 | 9791.94 | 416 | 407 | 79.1 |
| B | 12 | 111 | 9353 | 113.06 | 416 | 407 | 79.1 |
| C | 3 | 233 | 172652 | 1777.18 | 413 | 416 | 96.9 |
| C | 14 | 238 | 68740 | 704.99 | 413 | 416 | 96.9 |
| C | 2 | 114 | 7305 | 71.08 | 413 | 416 | 96.9 |
| D | 7 | 80 | 1500380 | 16067.31 | 390 | 383 | 93.4 |
| D | 8 | 195 | 124224 | 1326.53 | 390 | 383 | 93.4 |
| D | 11 | 135 | 54755 | 582.41 | 390 | 383 | 93.4 |
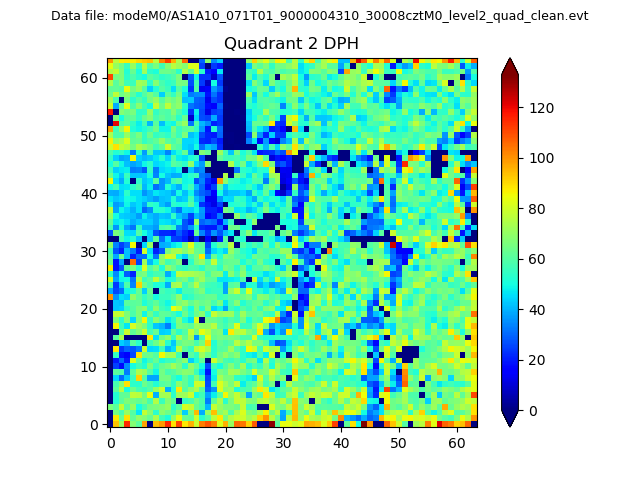
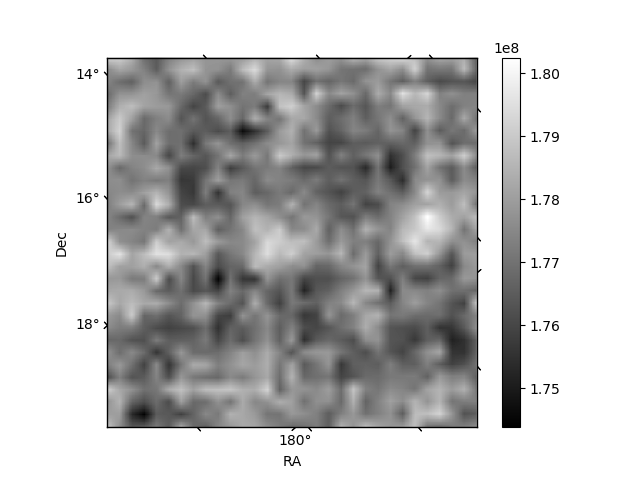
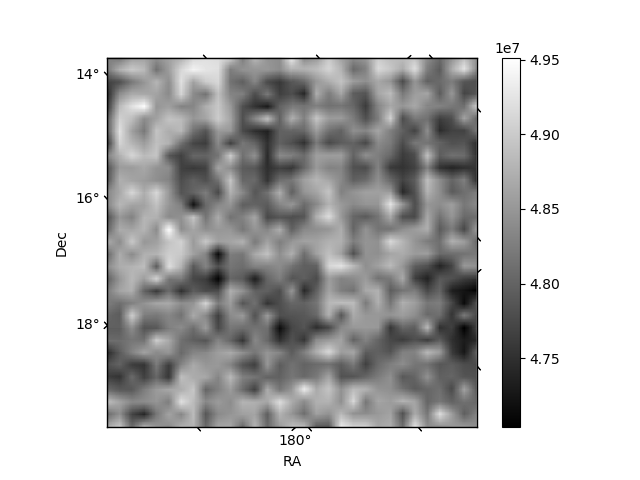
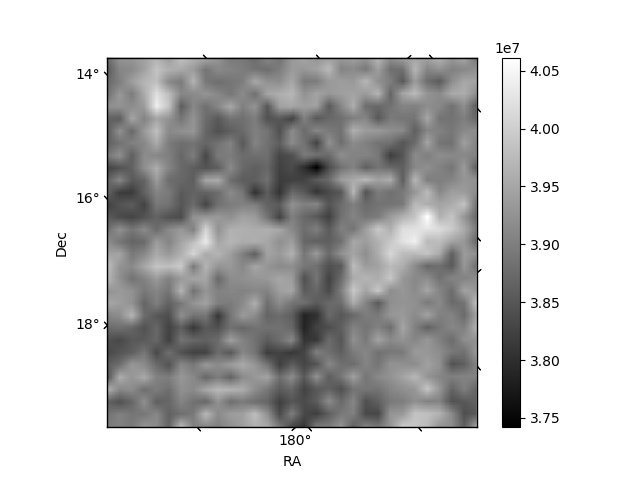
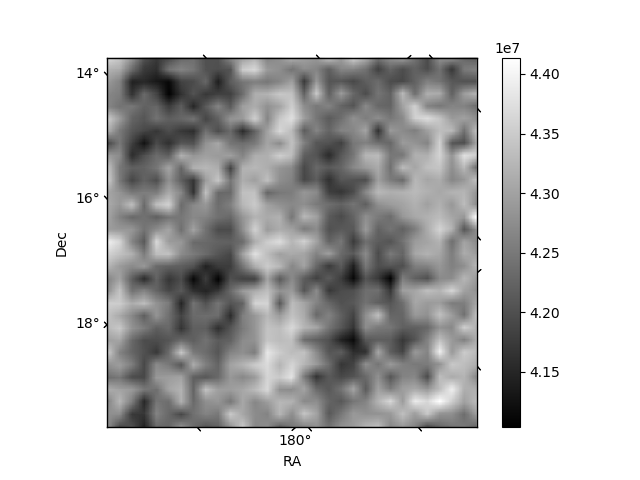
Histogram calculated using DETX and DETY for each event in the final _common_clean file
| Quadrant A |  |
 |
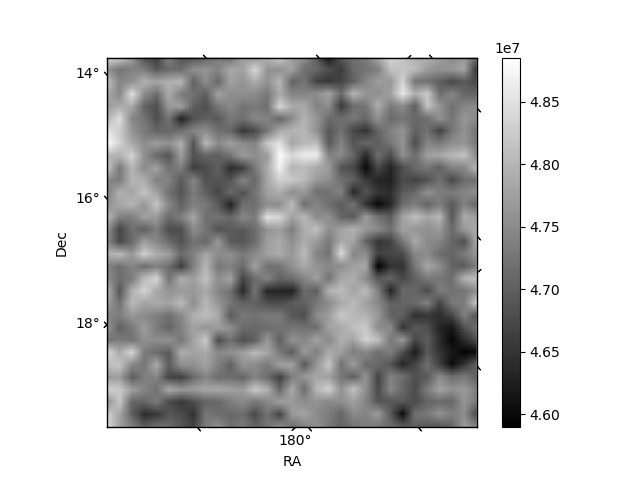
Quadrant B |
|---|---|---|---|
| Quadrant D |  |
 |
Quadrant C |
| Plot type | Count rate plots | Images |
|---|---|---|
| Comparison with Poisson distribution Blue bars denote a histogram of data divided into 1 sec bins. Red curve is a Poisson curve with rate = median count rate of data. |
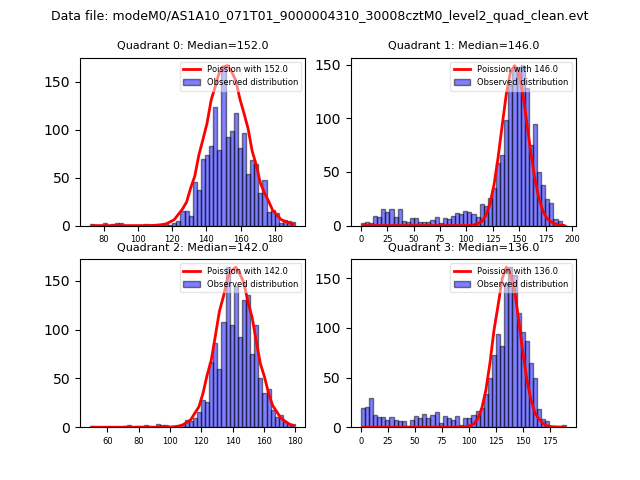 |
 |
| Quadrant-wise count rates Data is divided into 100 sec bins |
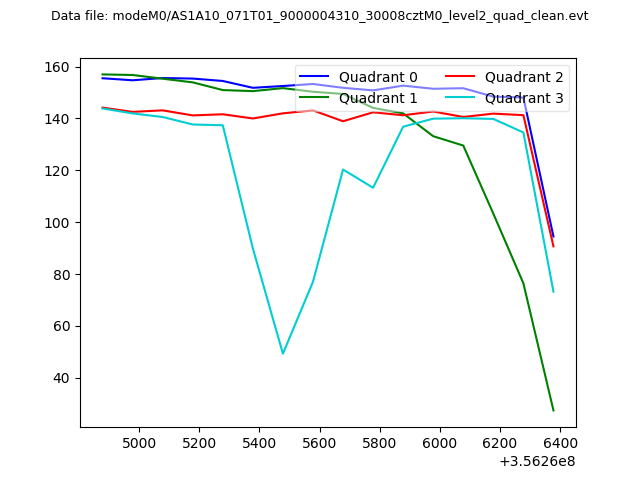 |
|
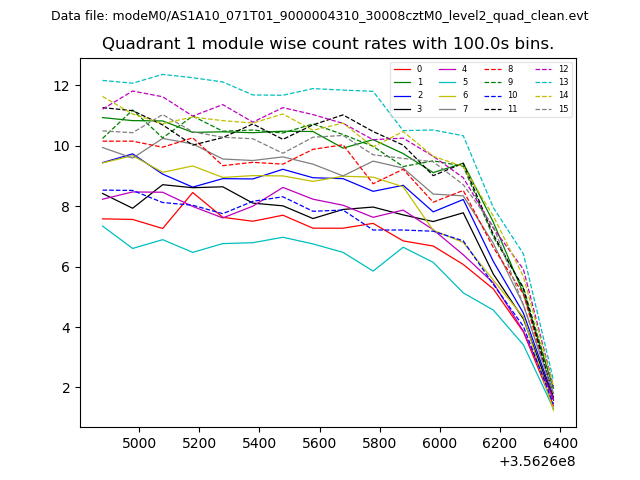
| Module-wise count rates for Quadrant A Data is divided into 100 sec bins |
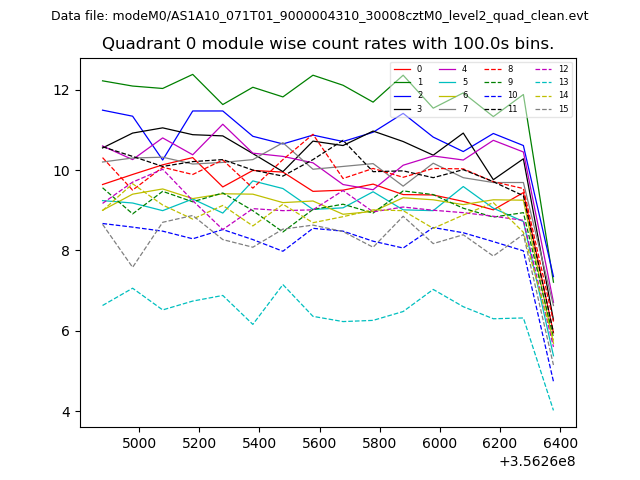 |
 |
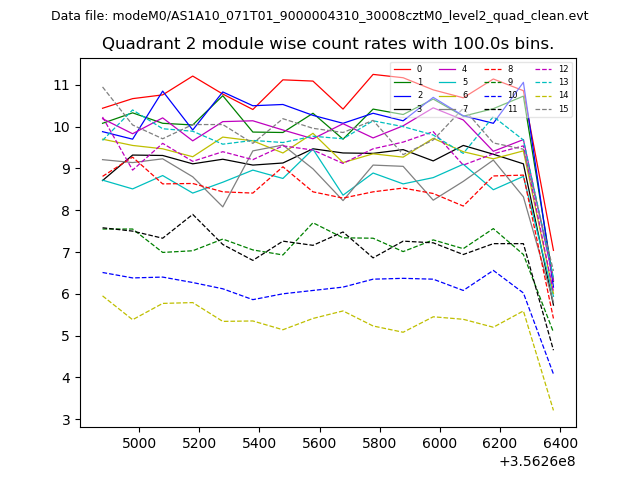
| Module-wise count rates for Quadrant B Data is divided into 100 sec bins |
 |
 |
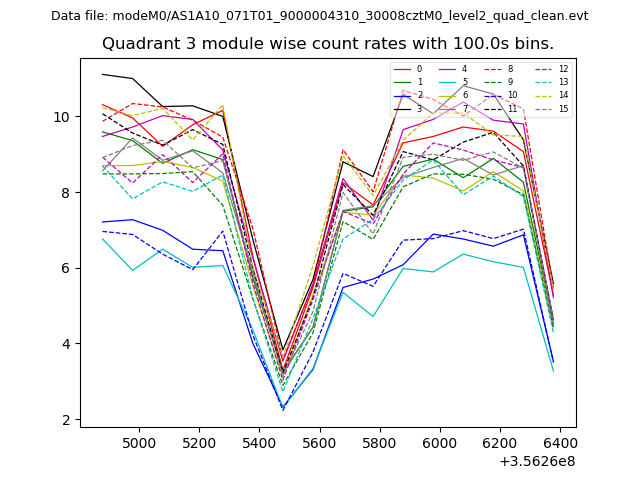
| Module-wise count rates for Quadrant C Data is divided into 100 sec bins |
 |
 |
| Module-wise count rates for Quadrant D Data is divided into 100 sec bins |
 |
 |
| Parameter | Plot |
|---|---|
| CZT HV Monitor | 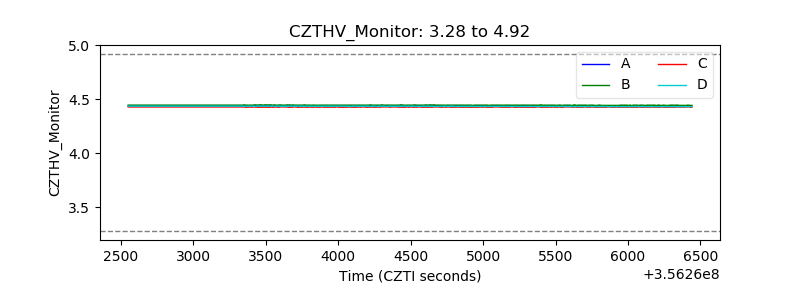 |
| D_VDD | 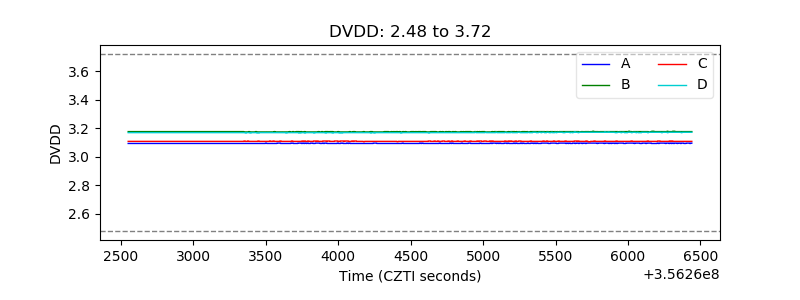 |
| Temperature 1 | 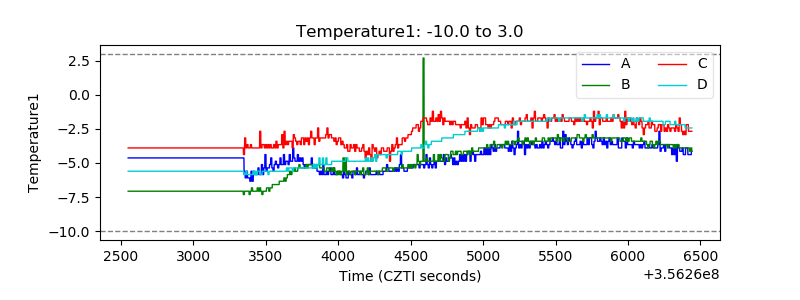 |
| Veto HV Monitor | 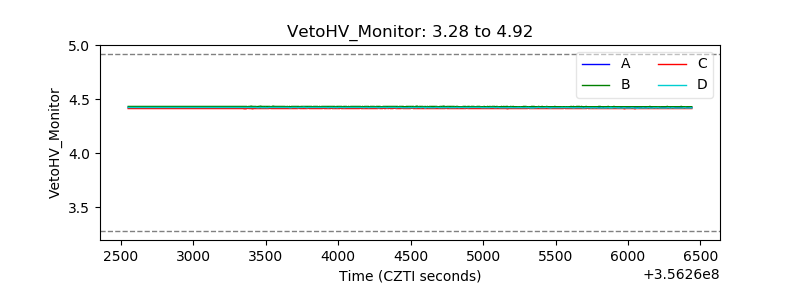 |
| Veto LLD |  |
| Alpha Counter | 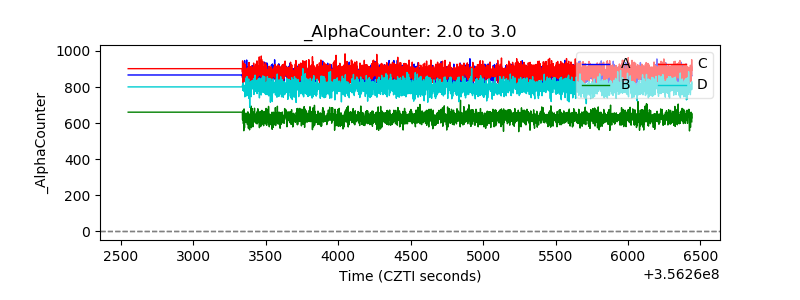 |
| _CPM_Rate | 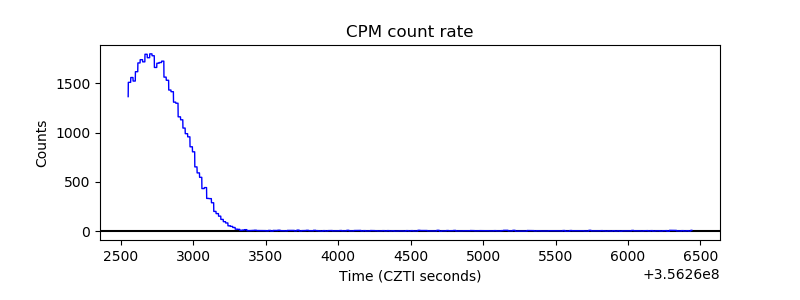 |
| CZT Counter | 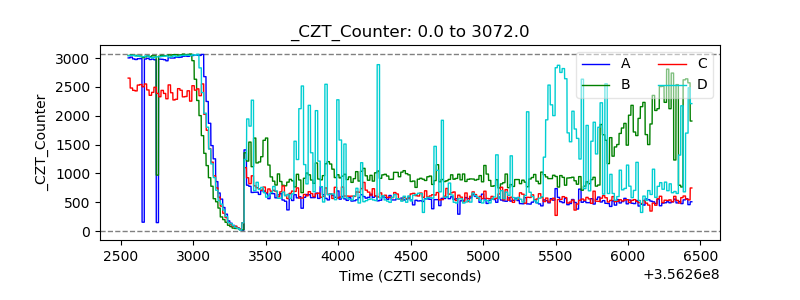 |
| +2.5 Volts monitor |  |
| +5 Volts monitor |  |
| _ROLL_ROT | 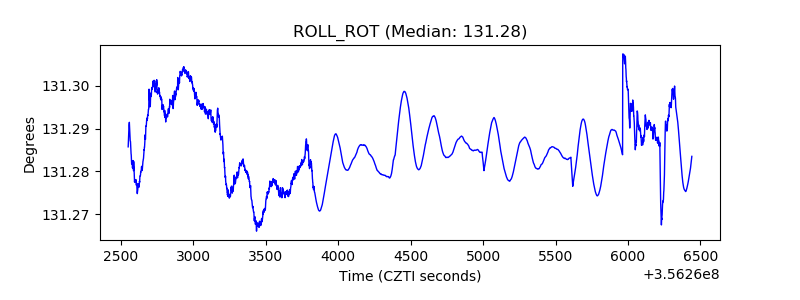 |
| _Roll_DEC | 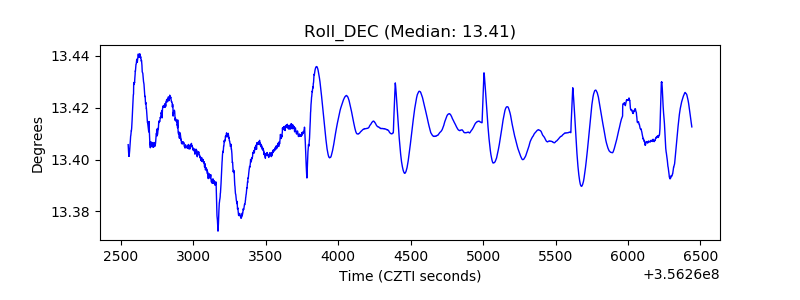 |
| _Roll_RA | 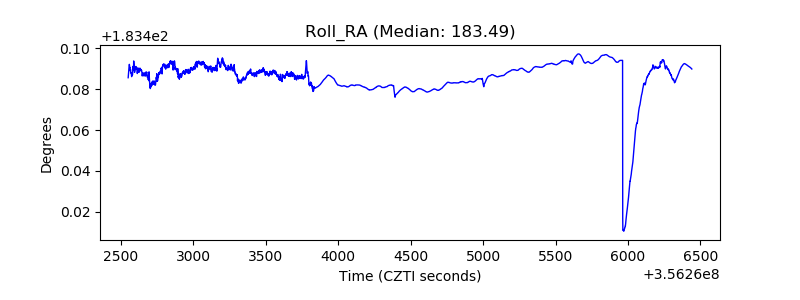 |
| Veto Counter | 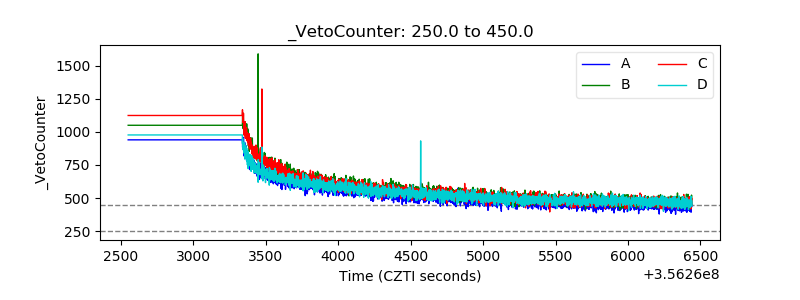 |