| Param | Original file | Final file |
|---|---|---|
| Filename | modeM0/AS1A10_071T02_9000004312_30008cztM0_level2.evt | modeM0/AS1A10_071T02_9000004312_30008cztM0_level2_quad_clean.evt |
| Size (bytes) | 395,184,960 | 42,937,920 |
| Size | 376.9 MB | 40.9 MB |
| Events in quadrant A | 1,774,714 | 306,848 |
| Events in quadrant B | 6,106,533 | 191,394 |
| Events in quadrant C | 1,828,449 | 289,381 |
| Events in quadrant D | 2,041,760 | 285,751 |
| Mode M9 | |||
|---|---|---|---|
| Quadrant | BADHDUFLAG | Total packets | Discarded packets |
| A | 0 | 12 | 0 |
| B | 0 | 12 | 0 |
| C | 0 | 12 | 0 |
| D | 0 | 12 | 0 |
| Mode SS | |||
|---|---|---|---|
| Quadrant | BADHDUFLAG | Total packets | Discarded packets |
| A | 0 | 66 | 0 |
| B | 0 | 66 | 0 |
| C | 0 | 66 | 0 |
| D | 0 | 66 | 0 |
| Mode M0 | |||
|---|---|---|---|
| Quadrant | BADHDUFLAG | Total packets | Discarded packets |
| A | 0 | 7124 | 1 |
| B | 0 | 20318 | 1 |
| C | 0 | 7308 | 1 |
| D | 0 | 7940 | 1 |
| Quadrant | Total seconds | Saturated seconds | Saturation percentage |
|---|---|---|---|
| A | 3174 | 110 | 3.465658% |
| B | 3174 | 2203 | 69.407687% |
| C | 3174 | 147 | 4.631380% |
| D | 3174 | 125 | 3.938248% |
Noise dominated data is calculated using 1-second bins in cleaned event files. If a bin has >2000 counts, and if more than 50% of those come from <1% of pixels, then it is considered to be noise-dominated and hence unusable.
| Quadrant | # 1 sec bins | Bins with >0 counts | Bins with >2000 counts | High rate bins dominated by noise | Noise dominated (total time) | Noise dominated (detector-on time) | Marked lightcurve |
|---|---|---|---|---|---|---|---|
| A | 4384 | 3175 | 0 | 0 | 0.00% | 0.00% | 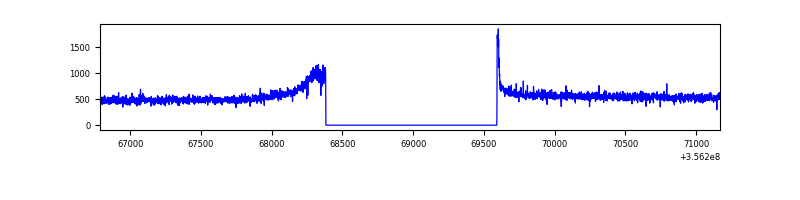 |
| B | 4383 | 3174 | 1516 | 1516 | 34.59% | 47.76% | 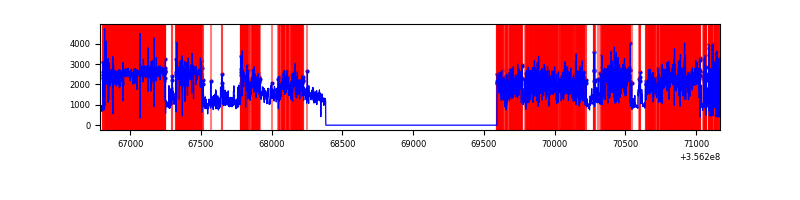 |
| C | 4384 | 3175 | 0 | 0 | 0.00% | 0.00% | 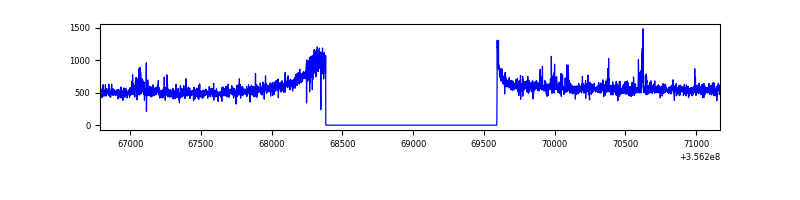 |
| D | 4384 | 3175 | 39 | 39 | 0.89% | 1.23% | 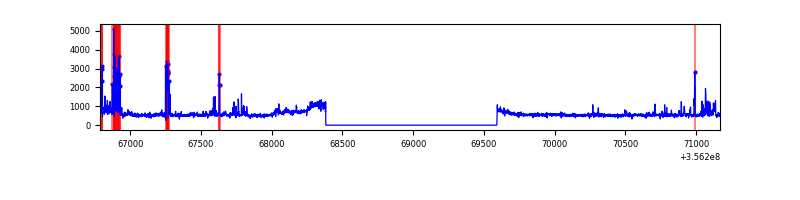 |
Top three noisy pixels from each quadrant. If the there are fewer than three noisy pixels in the level2.evt file, extra rows are filled as -1
| Pixel properties | Quadrant properties | ||||||
|---|---|---|---|---|---|---|---|
| Quadrant | DetID | PixID | Counts | Sigma | Mean | Median | Sigma |
| A | 8 | 192 | 16926 | 178.49 | 453 | 445 | 92.3 |
| A | 13 | 254 | 5681 | 56.71 | 453 | 445 | 92.3 |
| A | 5 | 203 | 4948 | 48.77 | 453 | 445 | 92.3 |
| B | 6 | 36 | 4182167 | 66347.58 | 319 | 312 | 63.0 |
| B | 6 | 159 | 664725 | 10541.3 | 319 | 312 | 63.0 |
| B | 12 | 111 | 7572 | 115.18 | 319 | 312 | 63.0 |
| C | 3 | 233 | 84521 | 833.49 | 426 | 429 | 100.9 |
| C | 14 | 238 | 72003 | 709.42 | 426 | 429 | 100.9 |
| C | 2 | 114 | 7579 | 70.87 | 426 | 429 | 100.9 |
| D | 7 | 80 | 197705 | 1864.32 | 430 | 420 | 105.8 |
| D | 8 | 195 | 137674 | 1297.03 | 430 | 420 | 105.8 |
| D | 2 | 120 | 41626 | 389.39 | 430 | 420 | 105.8 |
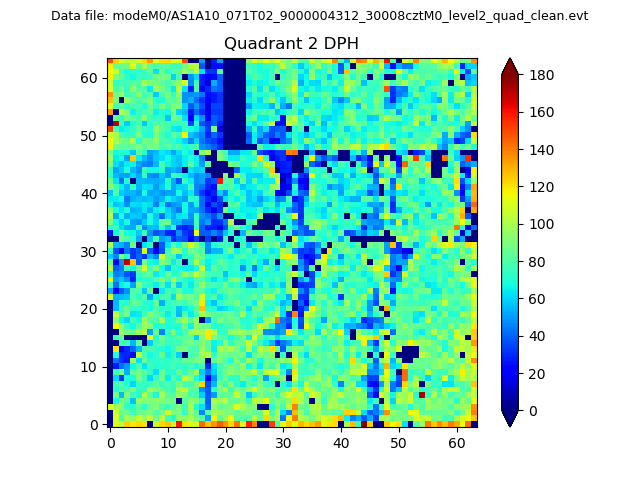
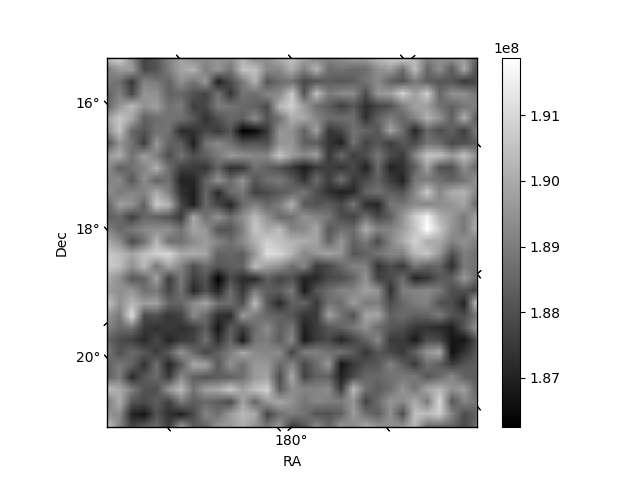
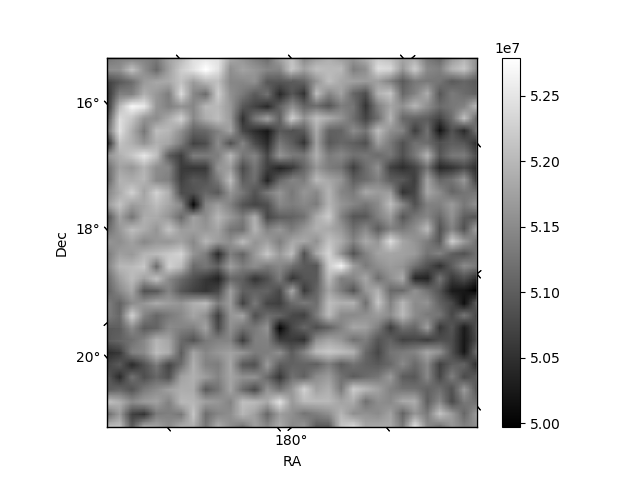
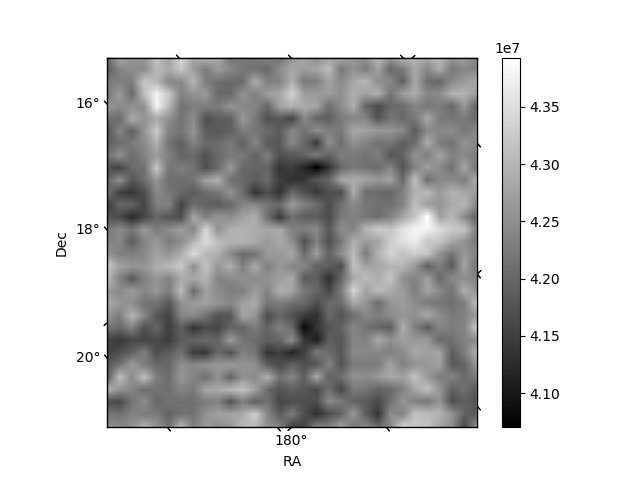
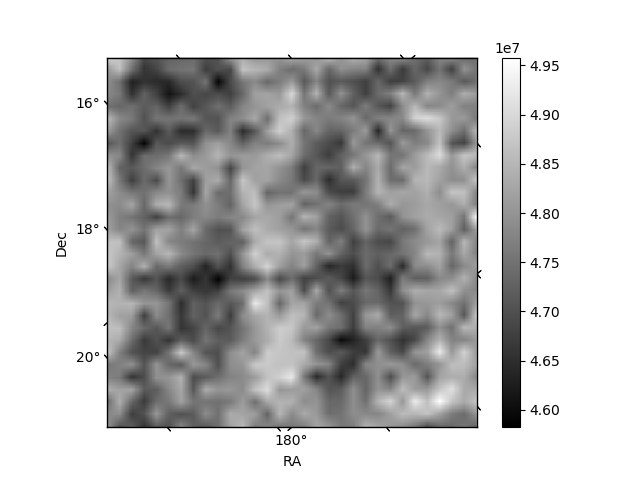
Histogram calculated using DETX and DETY for each event in the final _common_clean file
| Quadrant A | 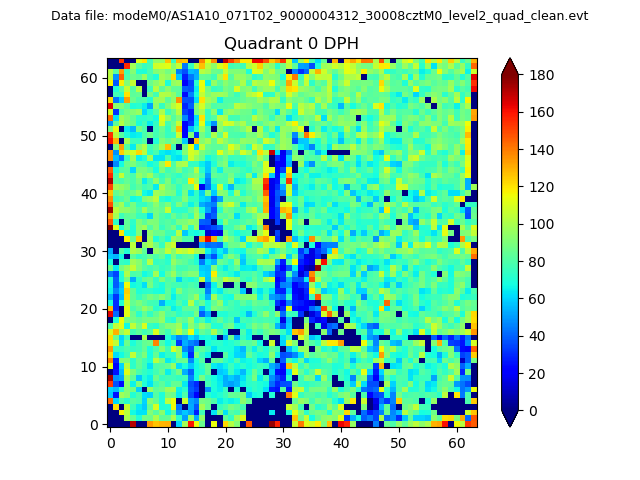 |
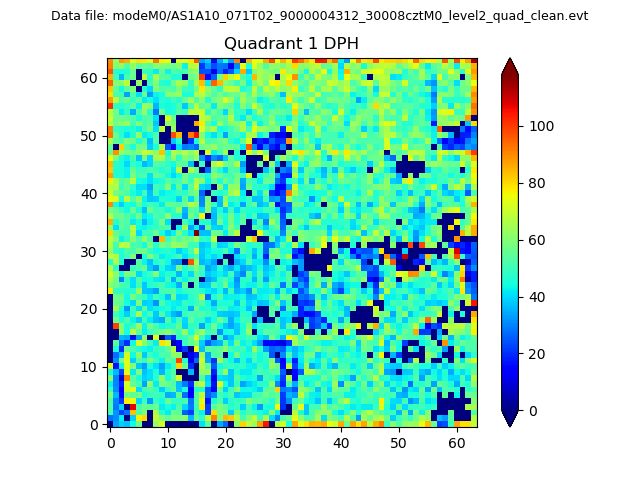 |
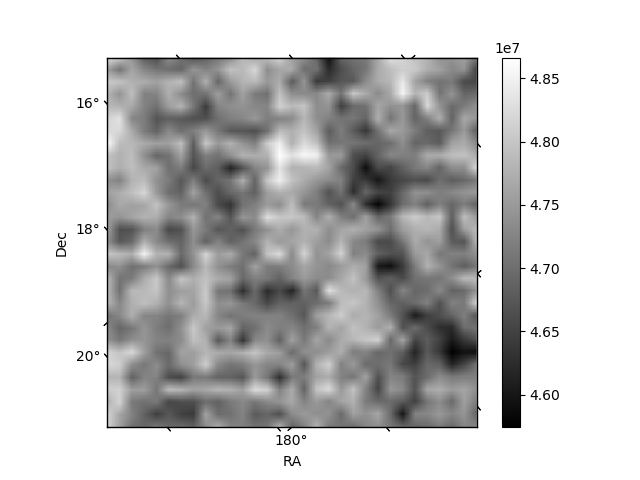
Quadrant B |
|---|---|---|---|
| Quadrant D | 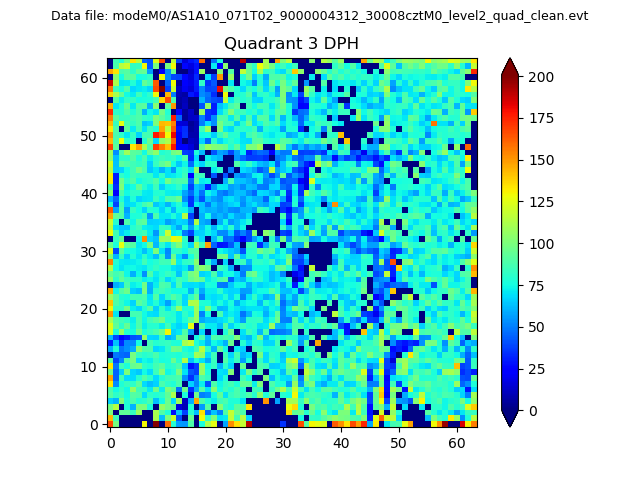 |
 |
Quadrant C |
| Plot type | Count rate plots | Images |
|---|---|---|
| Comparison with Poisson distribution Blue bars denote a histogram of data divided into 1 sec bins. Red curve is a Poisson curve with rate = median count rate of data. |
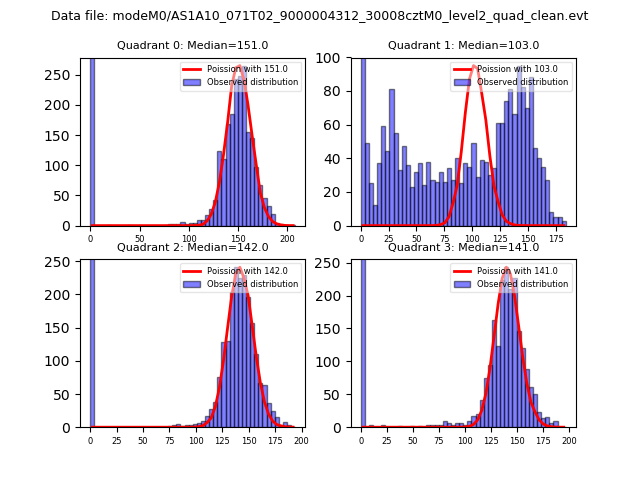 |
 |
| Quadrant-wise count rates Data is divided into 100 sec bins |
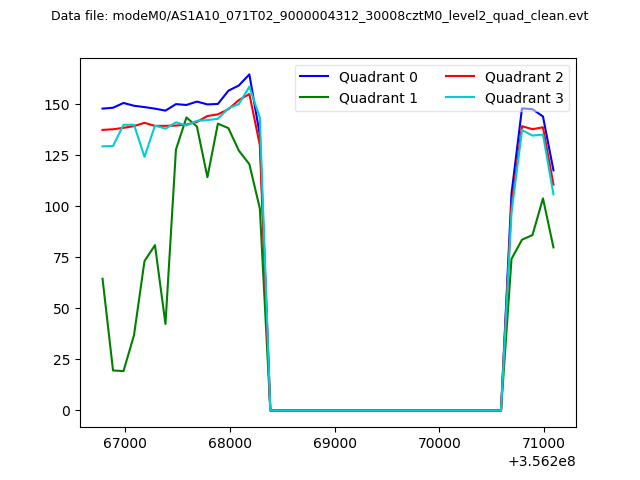 |
|
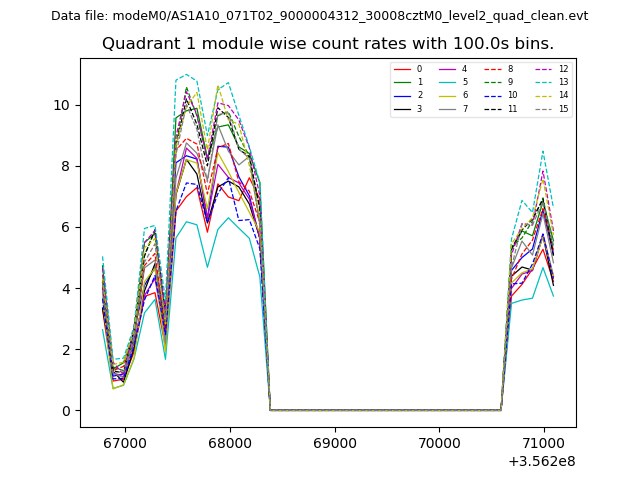
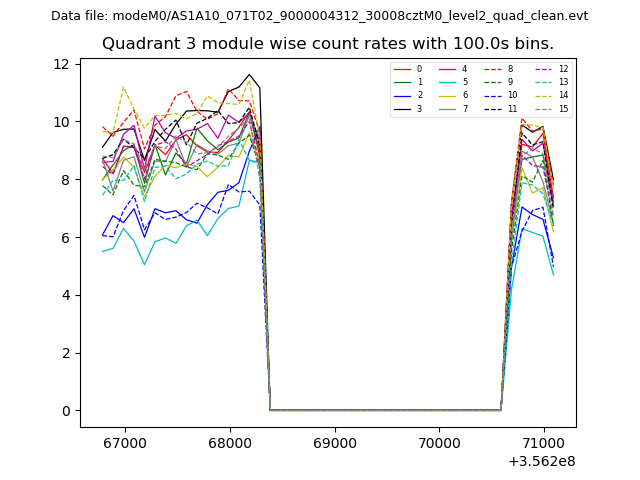
| Module-wise count rates for Quadrant A Data is divided into 100 sec bins |
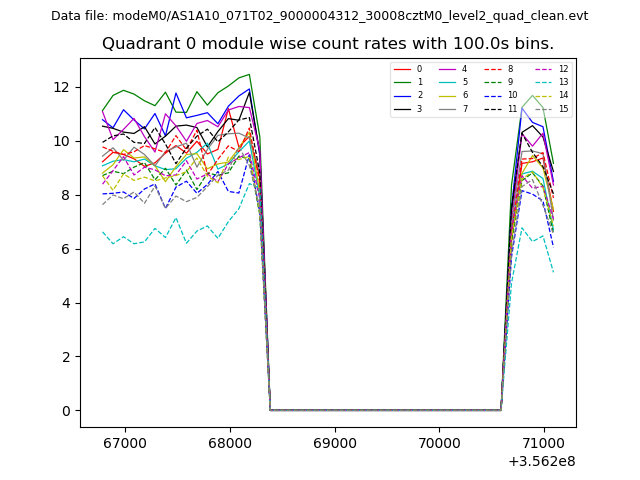 |
 |
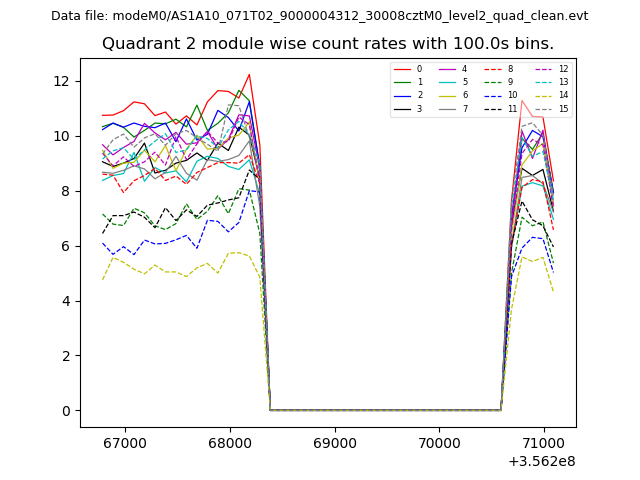
| Module-wise count rates for Quadrant B Data is divided into 100 sec bins |
 |
 |
| Module-wise count rates for Quadrant C Data is divided into 100 sec bins |
 |
 |
| Module-wise count rates for Quadrant D Data is divided into 100 sec bins |
 |
 |
| Parameter | Plot |
|---|---|
| CZT HV Monitor | 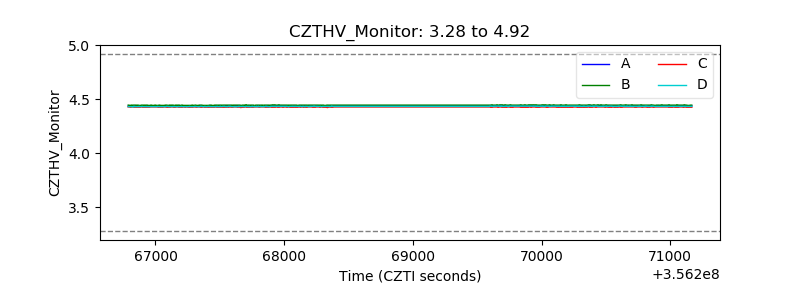 |
| D_VDD |  |
| Temperature 1 | 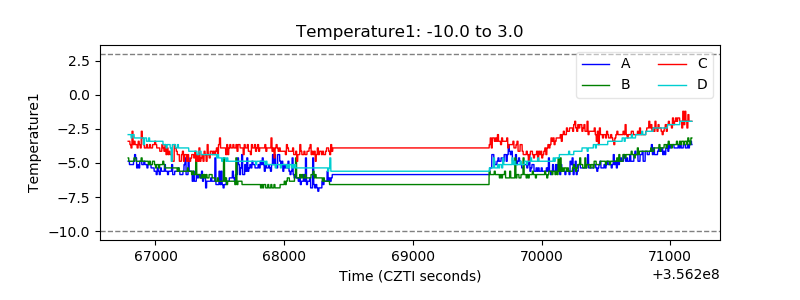 |
| Veto HV Monitor | 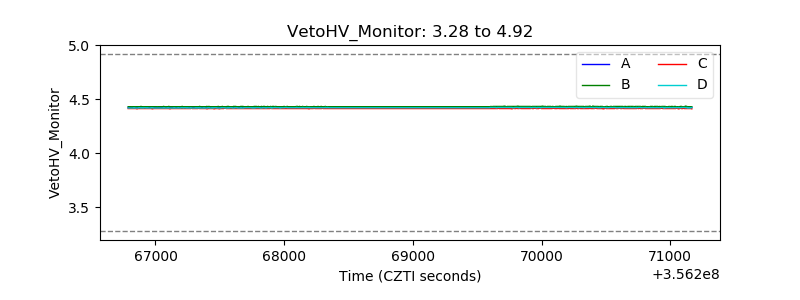 |
| Veto LLD | 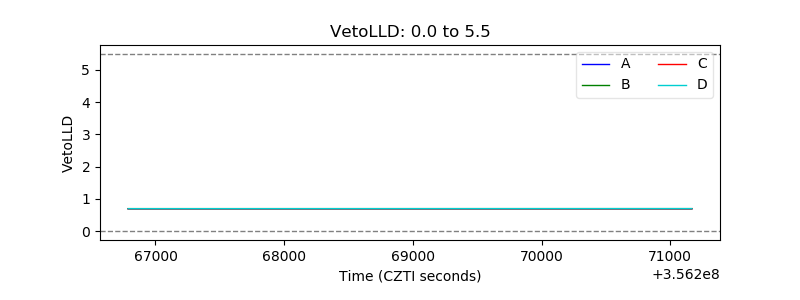 |
| Alpha Counter | 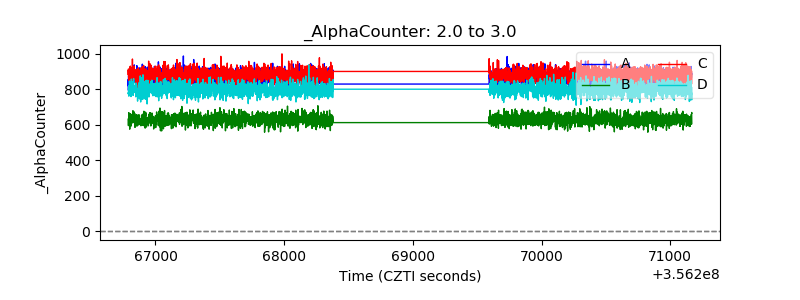 |
| _CPM_Rate | 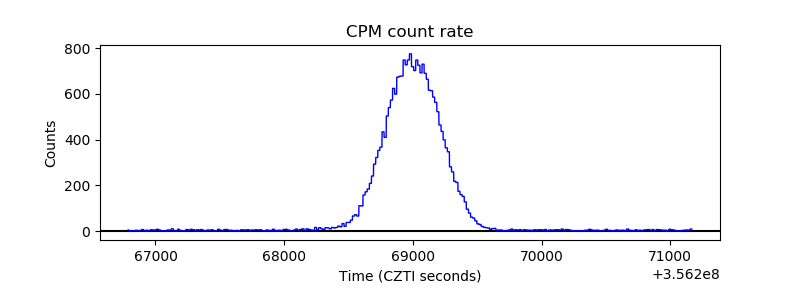 |
| CZT Counter | 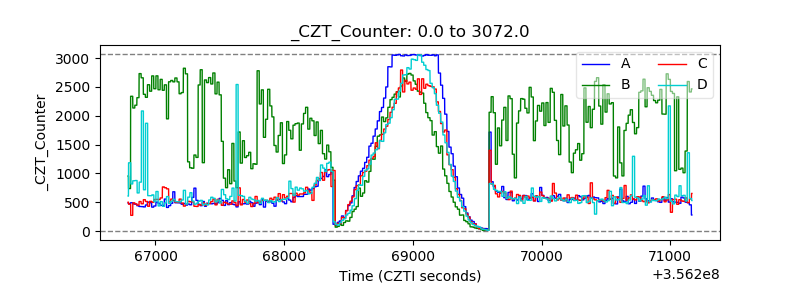 |
| +2.5 Volts monitor | 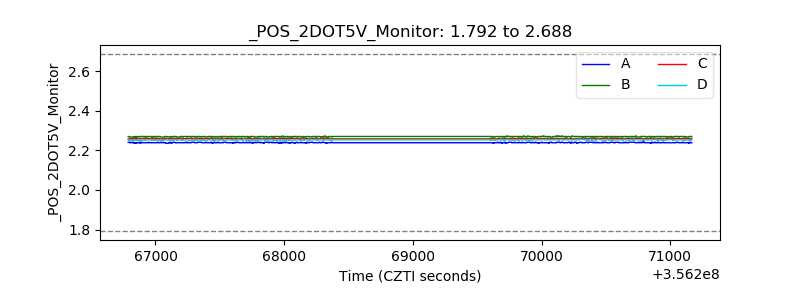 |
| +5 Volts monitor |  |
| _ROLL_ROT | 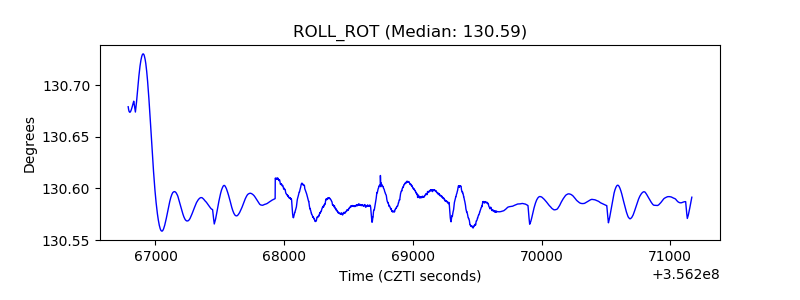 |
| _Roll_DEC | 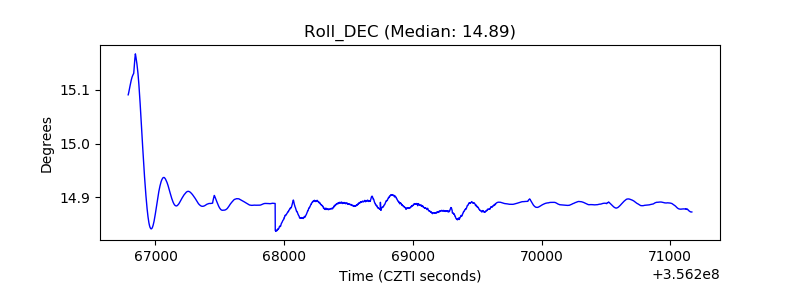 |
| _Roll_RA | 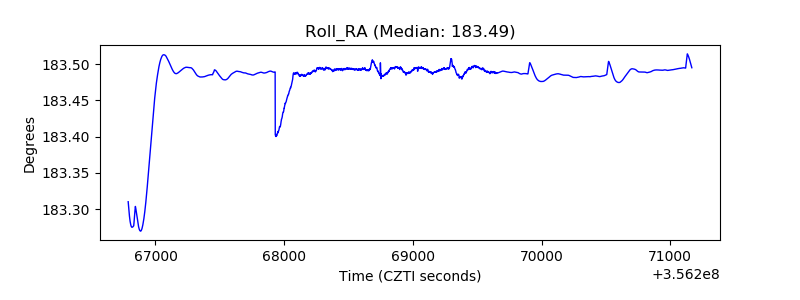 |
| Veto Counter | 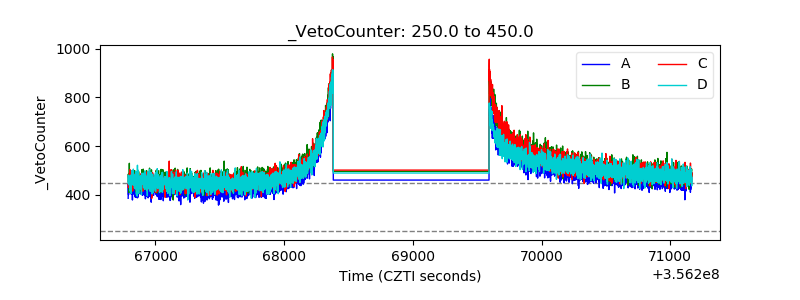 |