| Param | Original file | Final file |
|---|---|---|
| Filename | modeM0/AS1A10_071T02_9000004312_30009cztM0_level2.evt | modeM0/AS1A10_071T02_9000004312_30009cztM0_level2_quad_clean.evt |
| Size (bytes) | 841,034,880 | 89,377,920 |
| Size | 802.1 MB | 85.2 MB |
| Events in quadrant A | 3,607,323 | 627,443 |
| Events in quadrant B | 11,551,482 | 432,089 |
| Events in quadrant C | 3,820,566 | 593,838 |
| Events in quadrant D | 6,028,807 | 574,796 |
| Mode M9 | |||
|---|---|---|---|
| Quadrant | BADHDUFLAG | Total packets | Discarded packets |
| A | 0 | 19 | 0 |
| B | 0 | 20 | 0 |
| C | 0 | 20 | 0 |
| D | 0 | 20 | 0 |
| Mode SS | |||
|---|---|---|---|
| Quadrant | BADHDUFLAG | Total packets | Discarded packets |
| A | 0 | 140 | 0 |
| B | 0 | 140 | 0 |
| C | 0 | 140 | 0 |
| D | 0 | 140 | 0 |
| Mode M0 | |||
|---|---|---|---|
| Quadrant | BADHDUFLAG | Total packets | Discarded packets |
| A | 0 | 14670 | 2 |
| B | 0 | 38980 | 2 |
| C | 0 | 15500 | 2 |
| D | 0 | 22228 | 2 |
| Quadrant | Total seconds | Saturated seconds | Saturation percentage |
|---|---|---|---|
| A | 6845 | 118 | 1.723886% |
| B | 6845 | 3486 | 50.927684% |
| C | 6845 | 172 | 2.512783% |
| D | 6845 | 754 | 11.015340% |
Noise dominated data is calculated using 1-second bins in cleaned event files. If a bin has >2000 counts, and if more than 50% of those come from <1% of pixels, then it is considered to be noise-dominated and hence unusable.
| Quadrant | # 1 sec bins | Bins with >0 counts | Bins with >2000 counts | High rate bins dominated by noise | Noise dominated (total time) | Noise dominated (detector-on time) | Marked lightcurve |
|---|---|---|---|---|---|---|---|
| A | 7800 | 6847 | 0 | 0 | 0.00% | 0.00% | 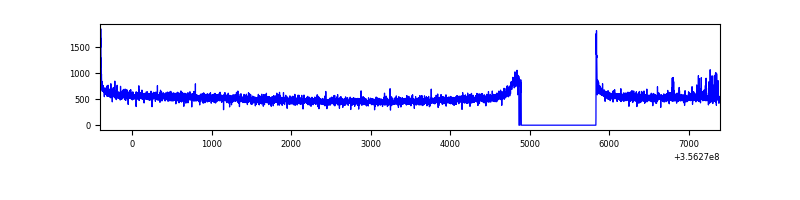 |
| B | 7800 | 6847 | 2711 | 2711 | 34.76% | 39.59% | 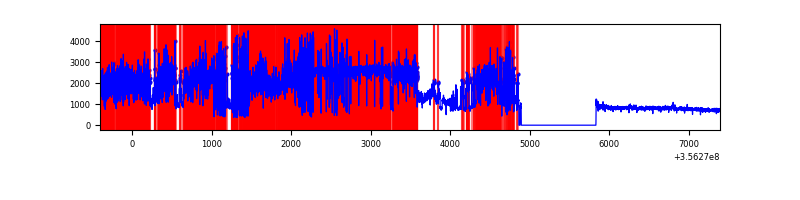 |
| C | 7800 | 6847 | 3 | 3 | 0.04% | 0.04% | 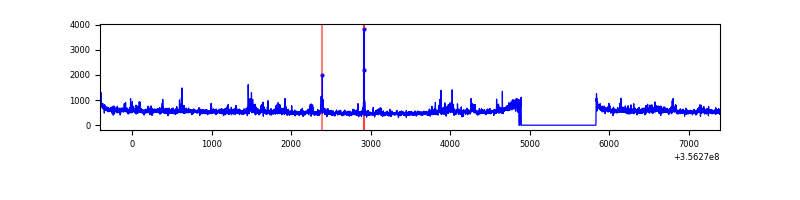 |
| D | 7800 | 6847 | 526 | 526 | 6.74% | 7.68% | 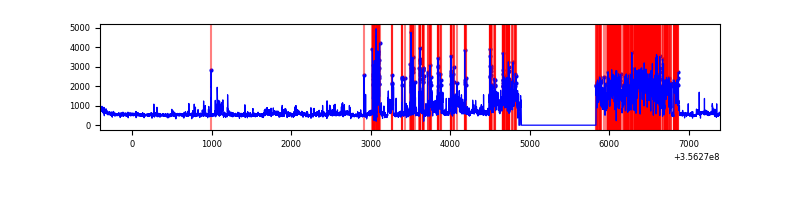 |
Top three noisy pixels from each quadrant. If the there are fewer than three noisy pixels in the level2.evt file, extra rows are filled as -1
| Pixel properties | Quadrant properties | ||||||
|---|---|---|---|---|---|---|---|
| Quadrant | DetID | PixID | Counts | Sigma | Mean | Median | Sigma |
| A | 3 | 1 | 40692 | 217.96 | 912 | 893 | 182.6 |
| A | 8 | 192 | 28670 | 152.12 | 912 | 893 | 182.6 |
| A | 5 | 203 | 19874 | 103.95 | 912 | 893 | 182.6 |
| B | 6 | 36 | 7311876 | 54061.29 | 700 | 683 | 135.2 |
| B | 6 | 159 | 1482237 | 10955.08 | 700 | 683 | 135.2 |
| B | 12 | 111 | 16197 | 114.72 | 700 | 683 | 135.2 |
| C | 3 | 233 | 299340 | 1483.33 | 862 | 869 | 201.2 |
| C | 14 | 238 | 143439 | 708.54 | 862 | 869 | 201.2 |
| C | 2 | 114 | 16042 | 75.41 | 862 | 869 | 201.2 |
| D | 7 | 80 | 2408967 | 11969.99 | 846 | 828 | 201.2 |
| D | 8 | 195 | 373806 | 1853.94 | 846 | 828 | 201.2 |
| D | 2 | 234 | 27064 | 130.41 | 846 | 828 | 201.2 |
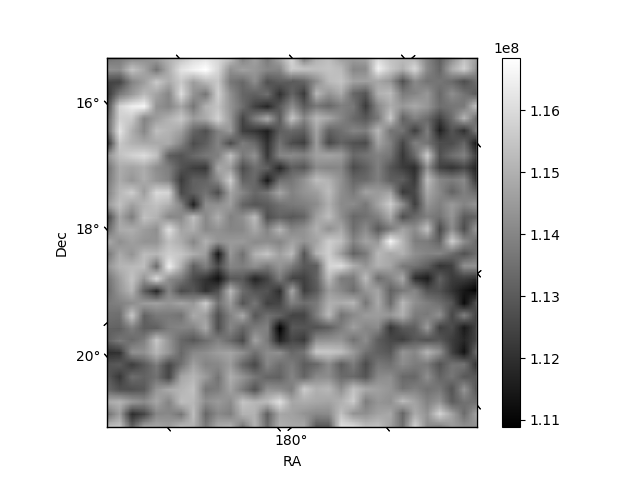
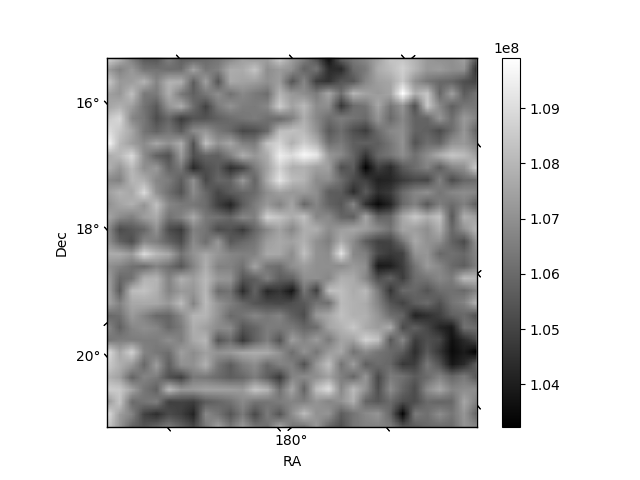
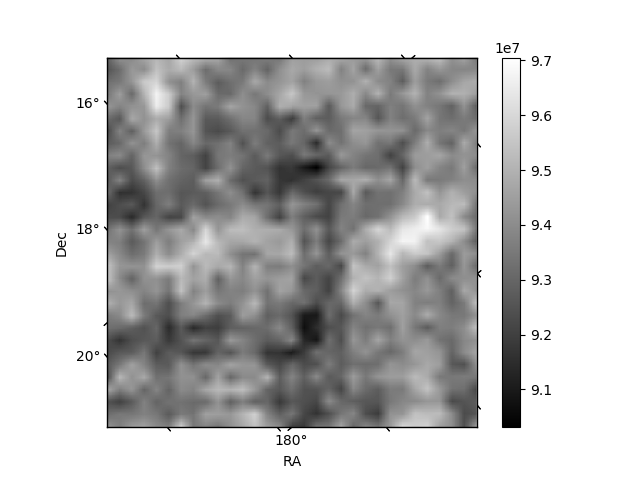
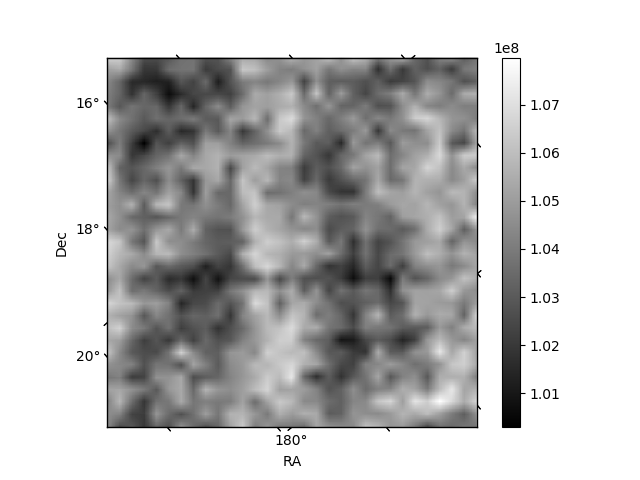
Histogram calculated using DETX and DETY for each event in the final _common_clean file
| Quadrant A | 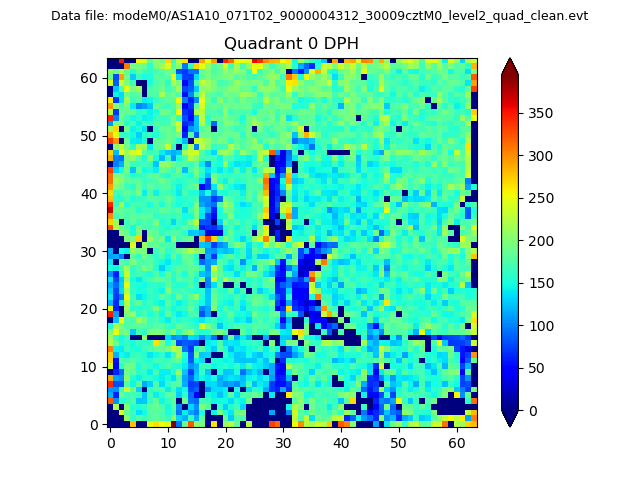 |
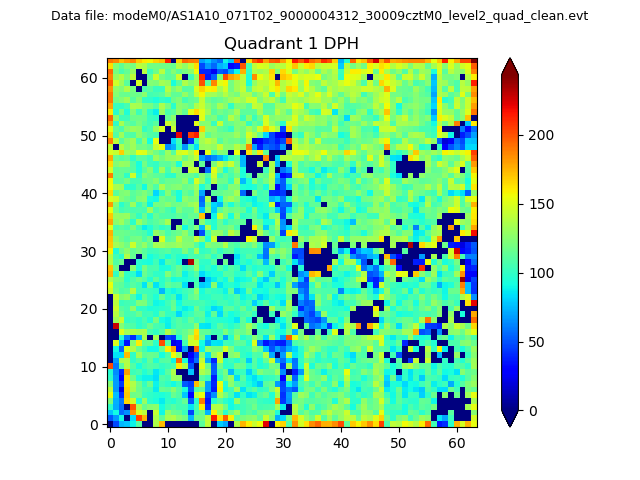 |
Quadrant B |
|---|---|---|---|
| Quadrant D | 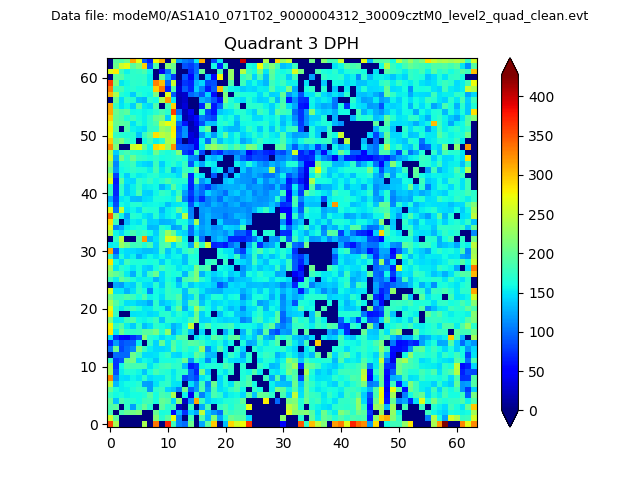 |
 |
Quadrant C |
| Plot type | Count rate plots | Images |
|---|---|---|
| Comparison with Poisson distribution Blue bars denote a histogram of data divided into 1 sec bins. Red curve is a Poisson curve with rate = median count rate of data. |
 |
 |
| Quadrant-wise count rates Data is divided into 100 sec bins |
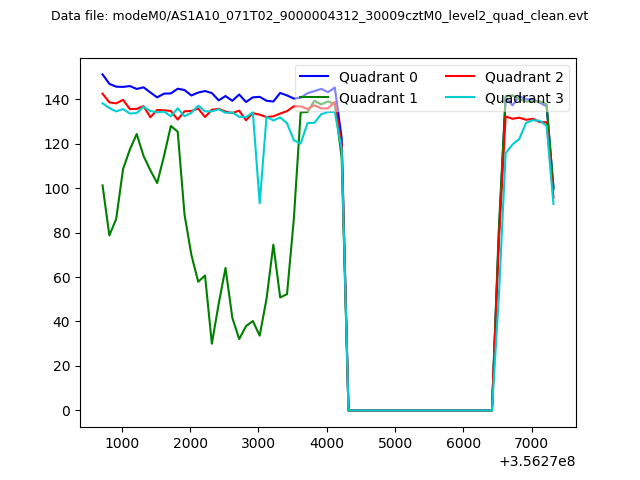 |
|
| Module-wise count rates for Quadrant A Data is divided into 100 sec bins |
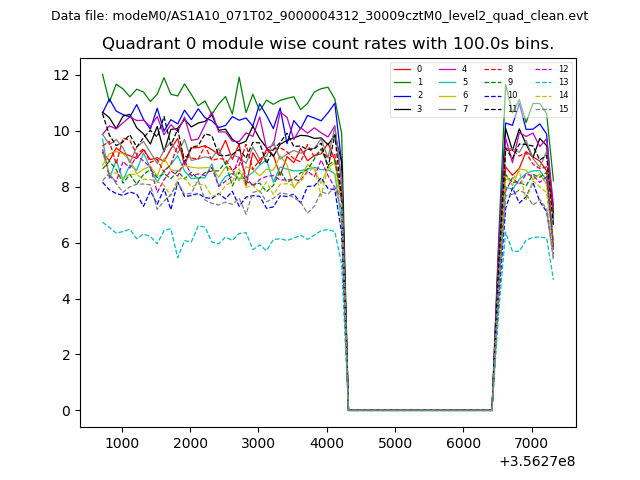 |
 |
| Module-wise count rates for Quadrant B Data is divided into 100 sec bins |
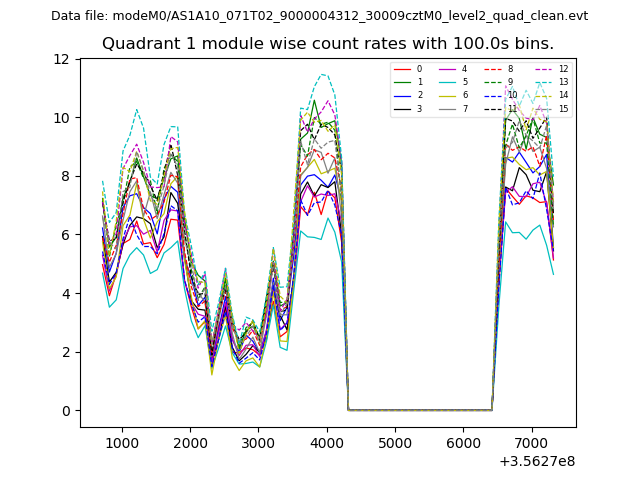 |
 |
| Module-wise count rates for Quadrant C Data is divided into 100 sec bins |
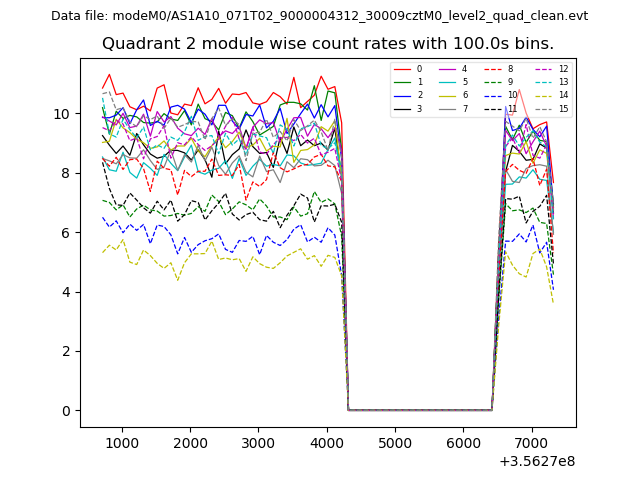 |
 |
| Module-wise count rates for Quadrant D Data is divided into 100 sec bins |
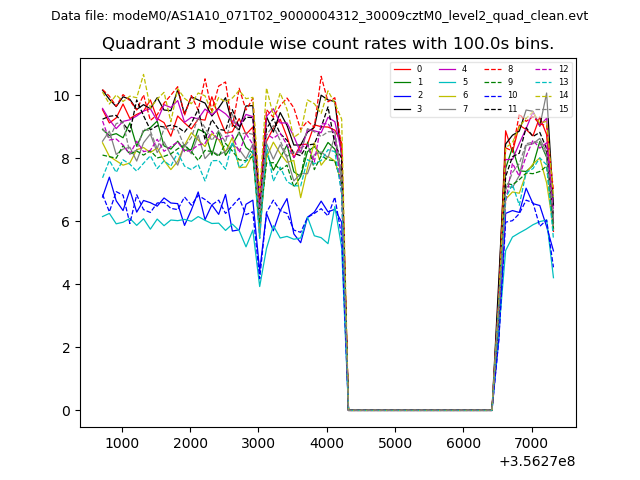 |
 |
| Parameter | Plot |
|---|---|
| CZT HV Monitor | 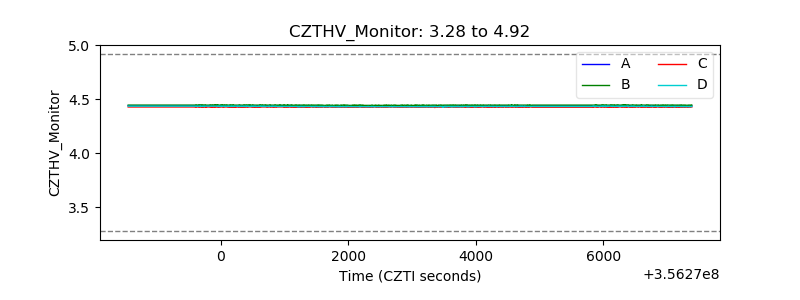 |
| D_VDD | 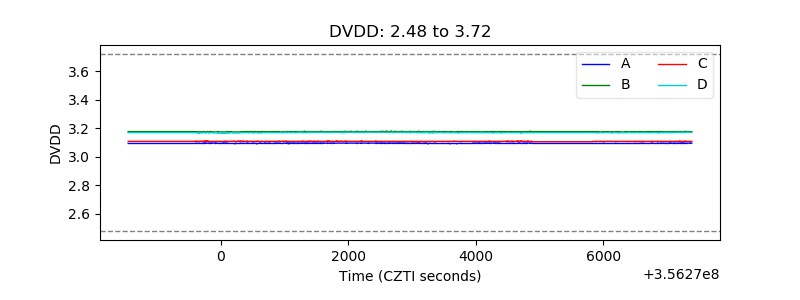 |
| Temperature 1 | 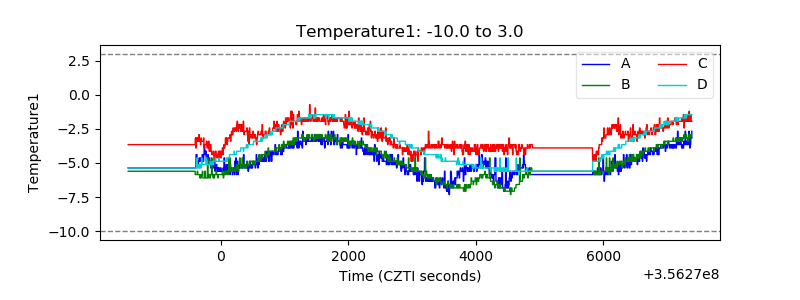 |
| Veto HV Monitor |  |
| Veto LLD | 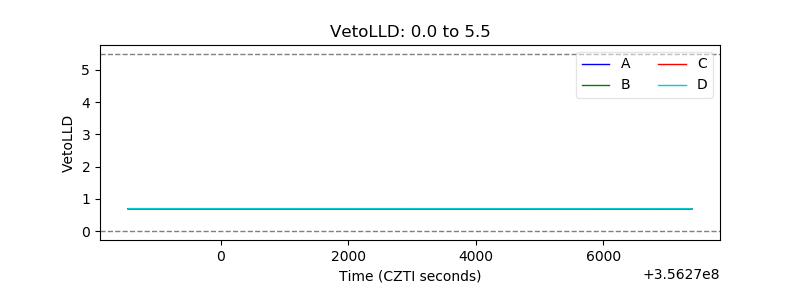 |
| Alpha Counter | 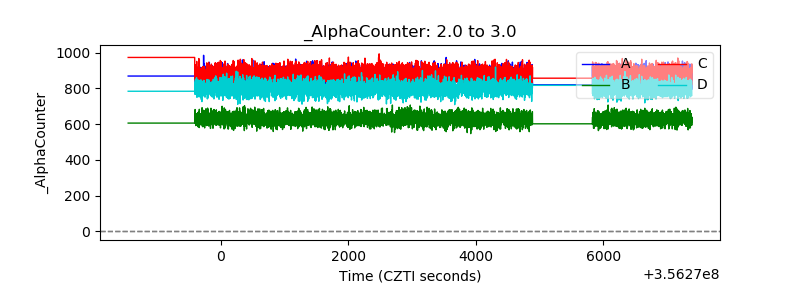 |
| _CPM_Rate | 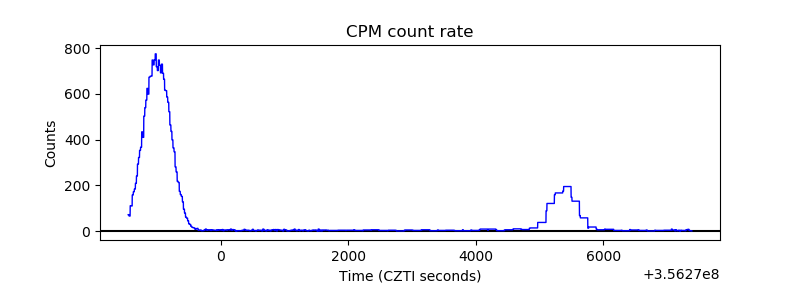 |
| CZT Counter |  |
| +2.5 Volts monitor |  |
| +5 Volts monitor |  |
| _ROLL_ROT | 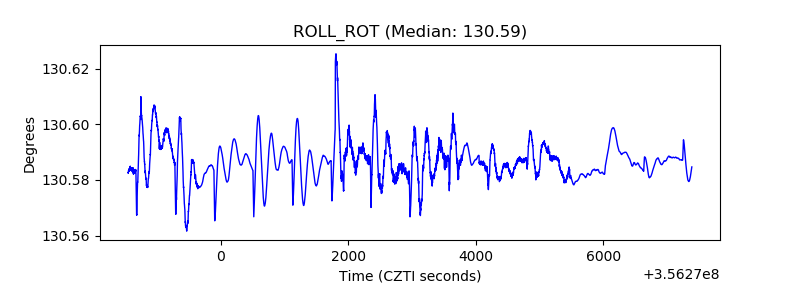 |
| _Roll_DEC | 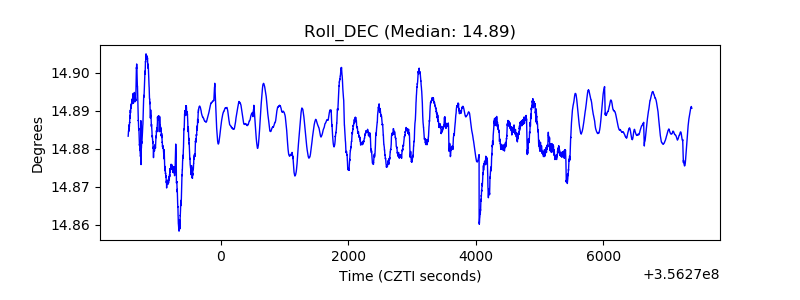 |
| _Roll_RA |  |
| Veto Counter | 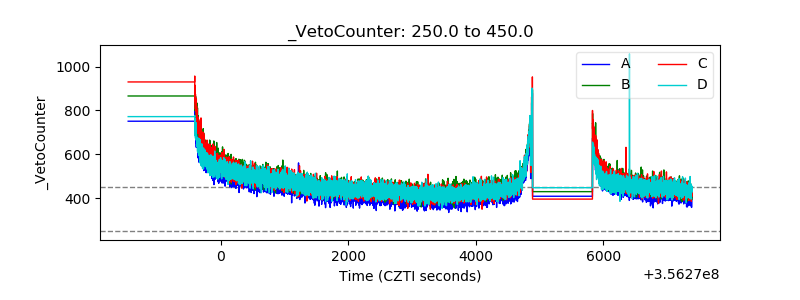 |