| Param | Original file | Final file |
|---|---|---|
| Filename | modeM0/AS1A10_071T02_9000004312_30011cztM0_level2.evt | modeM0/AS1A10_071T02_9000004312_30011cztM0_level2_quad_clean.evt |
| Size (bytes) | 567,095,040 | 101,448,000 |
| Size | 540.8 MB | 96.7 MB |
| Events in quadrant A | 3,675,894 | 659,164 |
| Events in quadrant B | 5,521,943 | 654,461 |
| Events in quadrant C | 3,846,757 | 628,081 |
| Events in quadrant D | 3,641,861 | 629,653 |
| Mode SS | |||
|---|---|---|---|
| Quadrant | BADHDUFLAG | Total packets | Discarded packets |
| A | 0 | 146 | 0 |
| B | 0 | 146 | 0 |
| C | 0 | 146 | 0 |
| D | 0 | 146 | 0 |
| Mode M0 | |||
|---|---|---|---|
| Quadrant | BADHDUFLAG | Total packets | Discarded packets |
| A | 0 | 15391 | 2 |
| B | 0 | 22019 | 2 |
| C | 0 | 15754 | 2 |
| D | 0 | 15362 | 2 |
| Quadrant | Total seconds | Saturated seconds | Saturation percentage |
|---|---|---|---|
| A | 7189 | 251 | 3.491445% |
| B | 7188 | 394 | 5.481358% |
| C | 7188 | 335 | 4.660545% |
| D | 7188 | 198 | 2.754591% |
Noise dominated data is calculated using 1-second bins in cleaned event files. If a bin has >2000 counts, and if more than 50% of those come from <1% of pixels, then it is considered to be noise-dominated and hence unusable.
| Quadrant | # 1 sec bins | Bins with >0 counts | Bins with >2000 counts | High rate bins dominated by noise | Noise dominated (total time) | Noise dominated (detector-on time) | Marked lightcurve |
|---|---|---|---|---|---|---|---|
| A | 7254 | 7191 | 1 | 1 | 0.01% | 0.01% | 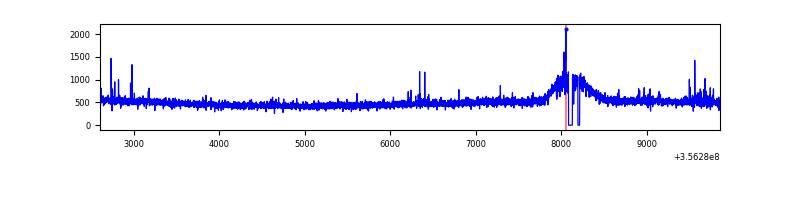 |
| B | 7253 | 7190 | 2 | 2 | 0.03% | 0.03% | 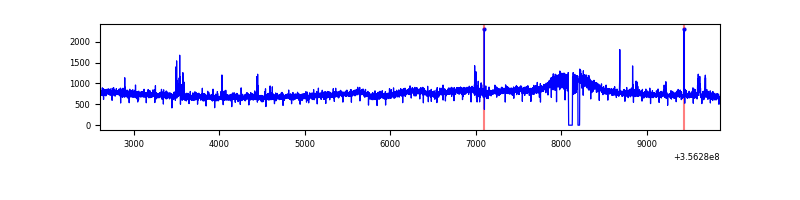 |
| C | 7253 | 7190 | 0 | 0 | 0.00% | 0.00% | 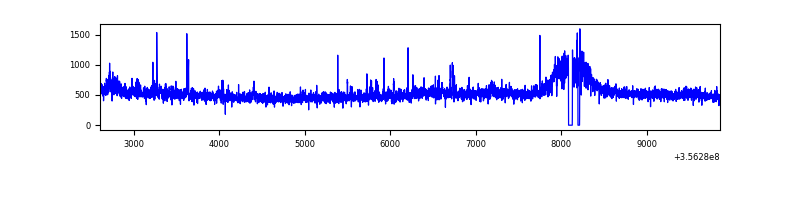 |
| D | 7253 | 7190 | 1 | 1 | 0.01% | 0.01% | 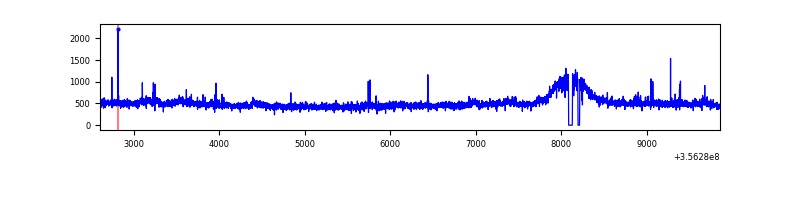 |
Top three noisy pixels from each quadrant. If the there are fewer than three noisy pixels in the level2.evt file, extra rows are filled as -1
| Pixel properties | Quadrant properties | ||||||
|---|---|---|---|---|---|---|---|
| Quadrant | DetID | PixID | Counts | Sigma | Mean | Median | Sigma |
| A | 12 | 96 | 54863 | 285.15 | 929 | 908 | 189.2 |
| A | 5 | 203 | 24604 | 125.23 | 929 | 908 | 189.2 |
| A | 13 | 254 | 12656 | 62.09 | 929 | 908 | 189.2 |
| B | 6 | 159 | 1919372 | 10838.63 | 901 | 878 | 177.0 |
| B | 0 | 183 | 37619 | 207.57 | 901 | 878 | 177.0 |
| B | 12 | 111 | 22343 | 121.27 | 901 | 878 | 177.0 |
| C | 3 | 233 | 254824 | 1206.38 | 881 | 888 | 210.5 |
| C | 14 | 238 | 140520 | 663.36 | 881 | 888 | 210.5 |
| C | 2 | 114 | 16572 | 74.51 | 881 | 888 | 210.5 |
| D | 8 | 195 | 198793 | 911.26 | 902 | 882 | 217.2 |
| D | 2 | 234 | 30163 | 134.82 | 902 | 882 | 217.2 |
| D | 2 | 250 | 18959 | 83.23 | 902 | 882 | 217.2 |
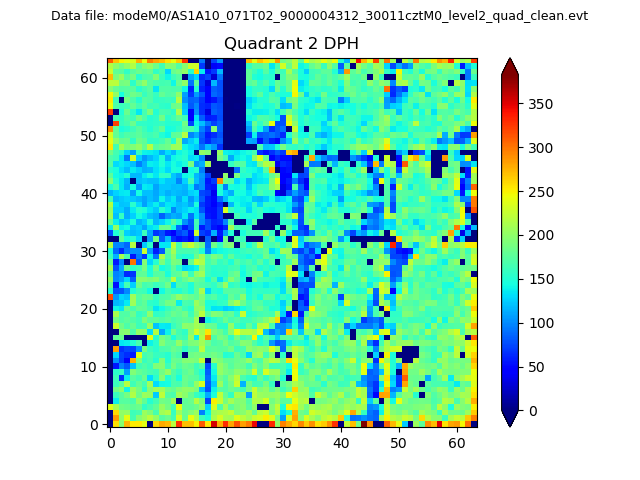
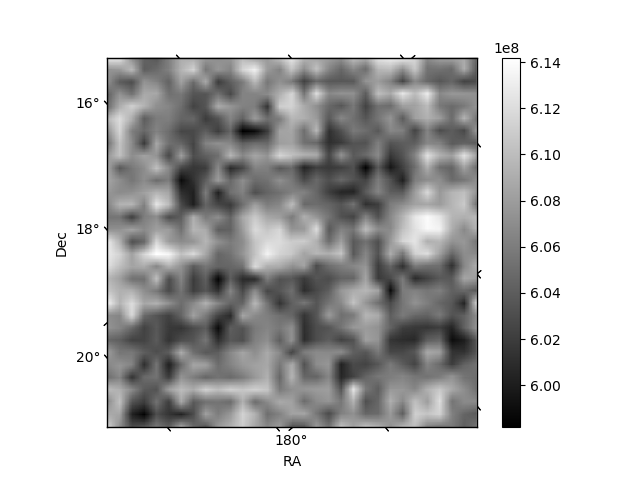
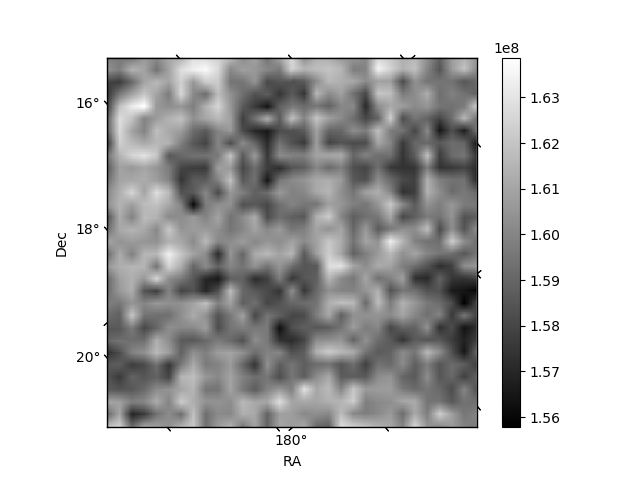
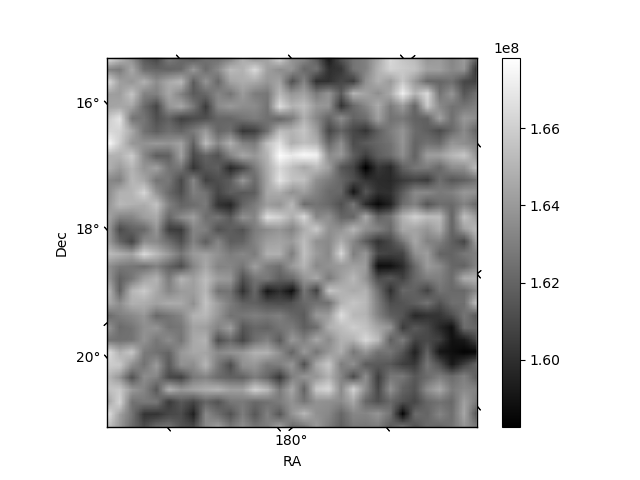
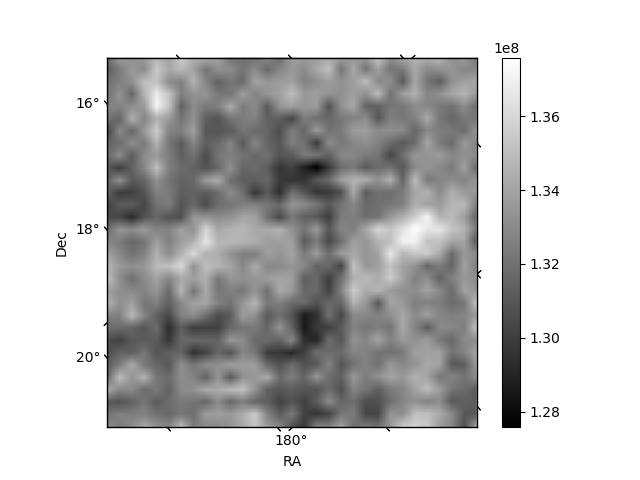
Histogram calculated using DETX and DETY for each event in the final _common_clean file
| Quadrant A | 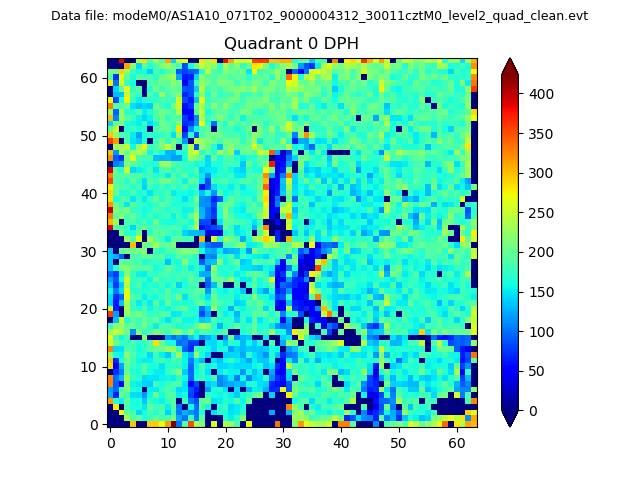 |
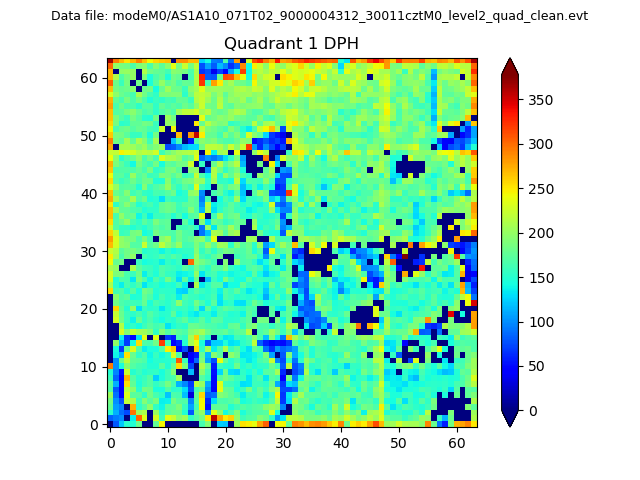 |
Quadrant B |
|---|---|---|---|
| Quadrant D | 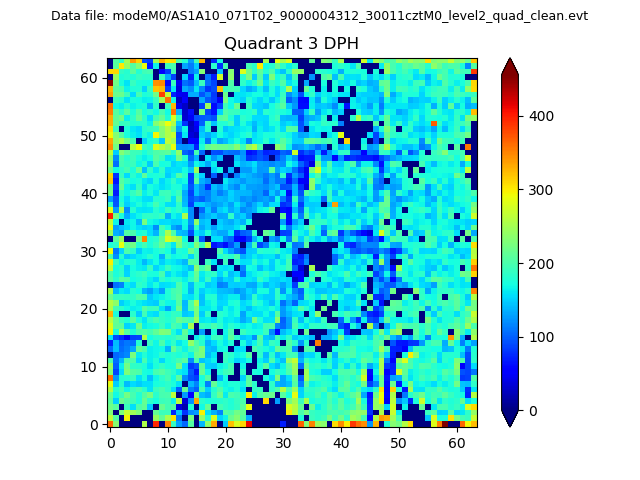 |
 |
Quadrant C |
| Plot type | Count rate plots | Images |
|---|---|---|
| Comparison with Poisson distribution Blue bars denote a histogram of data divided into 1 sec bins. Red curve is a Poisson curve with rate = median count rate of data. |
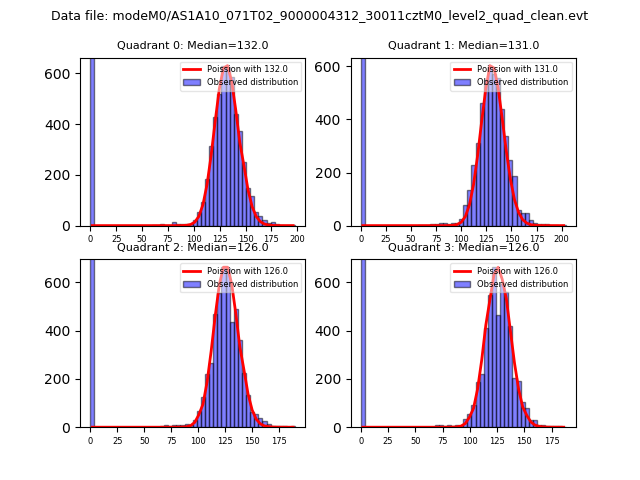 |
 |
| Quadrant-wise count rates Data is divided into 100 sec bins |
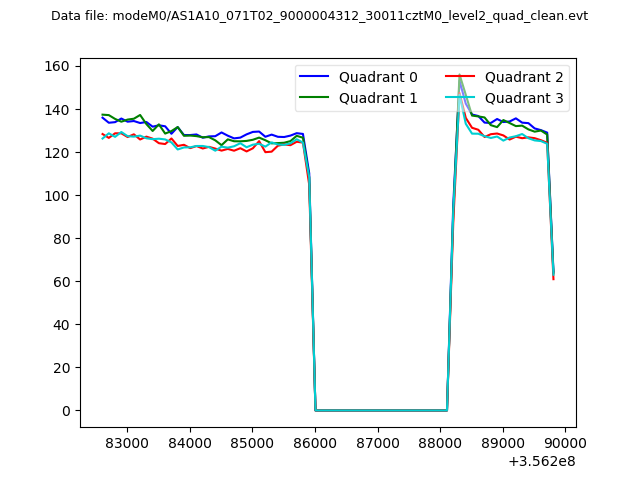 |
|
| Module-wise count rates for Quadrant A Data is divided into 100 sec bins |
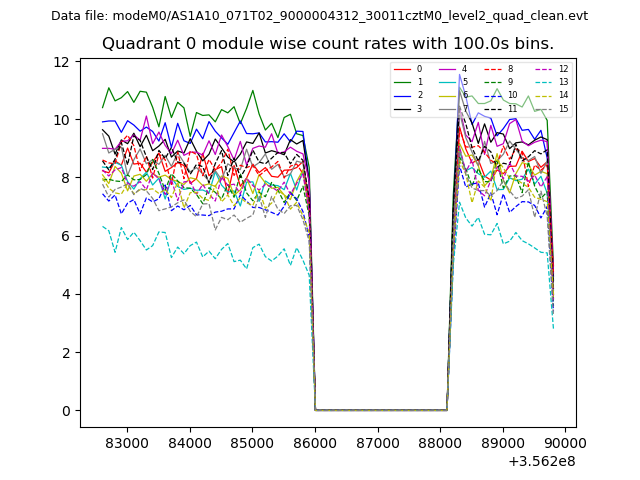 |
 |
| Module-wise count rates for Quadrant B Data is divided into 100 sec bins |
 |
 |
| Module-wise count rates for Quadrant C Data is divided into 100 sec bins |
 |
 |
| Module-wise count rates for Quadrant D Data is divided into 100 sec bins |
 |
 |
| Parameter | Plot |
|---|---|
| CZT HV Monitor | 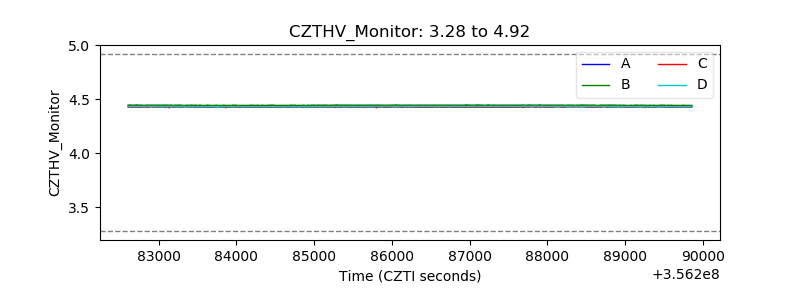 |
| D_VDD | 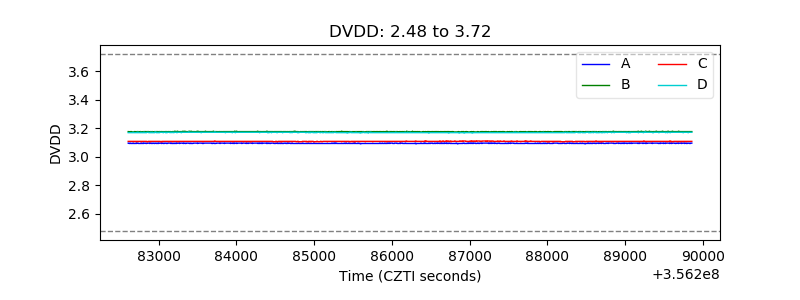 |
| Temperature 1 | 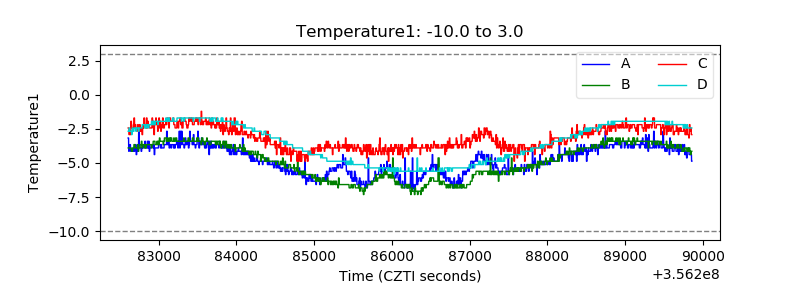 |
| Veto HV Monitor | 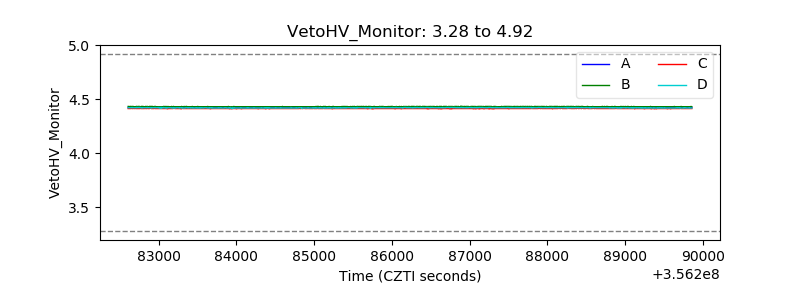 |
| Veto LLD |  |
| Alpha Counter | 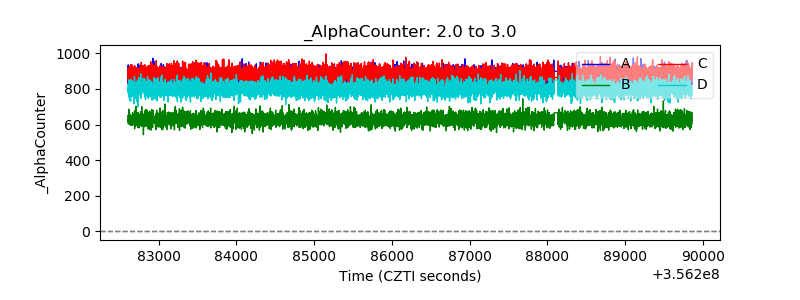 |
| _CPM_Rate | 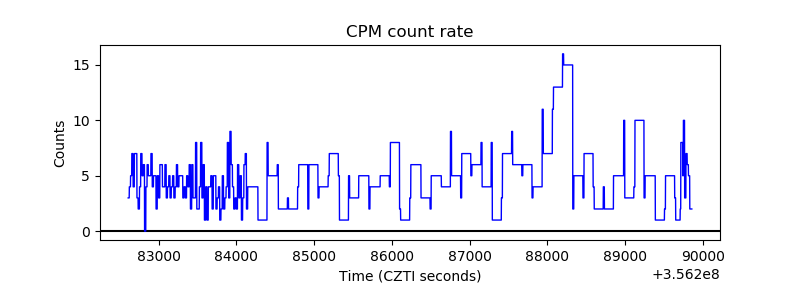 |
| CZT Counter | 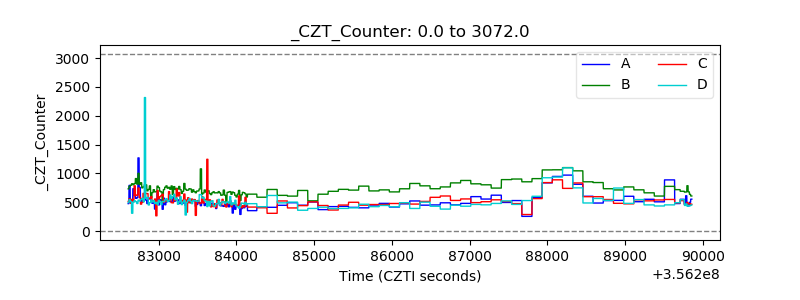 |
| +2.5 Volts monitor |  |
| +5 Volts monitor |  |
| _ROLL_ROT | 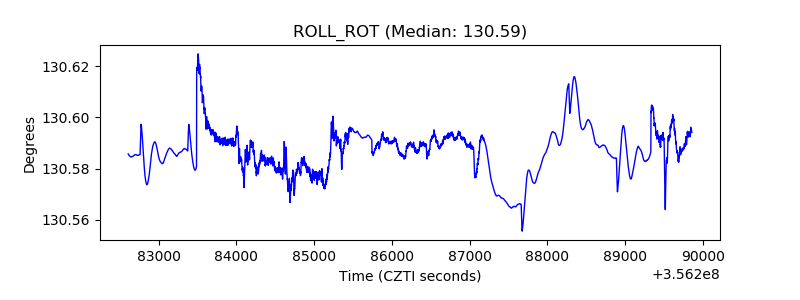 |
| _Roll_DEC | 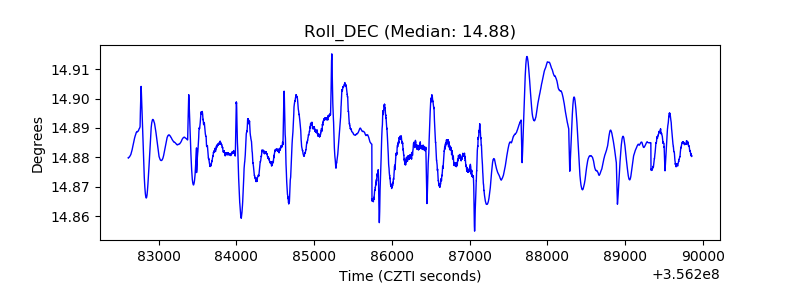 |
| _Roll_RA | 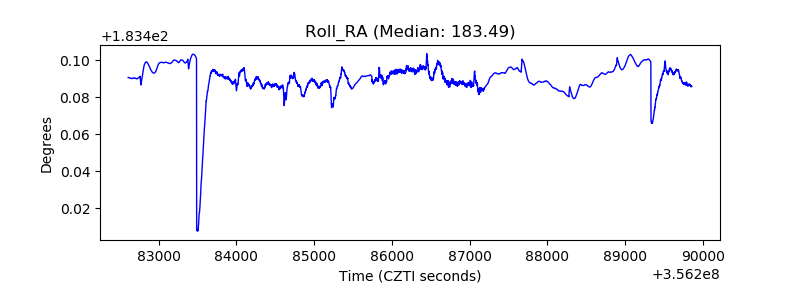 |
| Veto Counter |  |