| Param | Original file | Final file |
|---|---|---|
| Filename | modeM0/AS1A10_071T02_9000004312_30012cztM0_level2.evt | modeM0/AS1A10_071T02_9000004312_30012cztM0_level2_quad_clean.evt |
| Size (bytes) | 631,229,760 | 110,799,360 |
| Size | 602.0 MB | 105.7 MB |
| Events in quadrant A | 4,080,043 | 720,081 |
| Events in quadrant B | 6,321,490 | 709,112 |
| Events in quadrant C | 4,069,492 | 688,078 |
| Events in quadrant D | 4,109,672 | 688,183 |
| Mode M9 | |||
|---|---|---|---|
| Quadrant | BADHDUFLAG | Total packets | Discarded packets |
| A | 0 | 3 | 0 |
| B | 0 | 3 | 0 |
| C | 0 | 3 | 0 |
| D | 0 | 3 | 0 |
| Mode SS | |||
|---|---|---|---|
| Quadrant | BADHDUFLAG | Total packets | Discarded packets |
| A | 0 | 162 | 0 |
| B | 0 | 162 | 0 |
| C | 0 | 162 | 0 |
| D | 0 | 162 | 0 |
| Mode M0 | |||
|---|---|---|---|
| Quadrant | BADHDUFLAG | Total packets | Discarded packets |
| A | 0 | 17118 | 3 |
| B | 0 | 25012 | 3 |
| C | 0 | 17032 | 3 |
| D | 0 | 17334 | 3 |
| Quadrant | Total seconds | Saturated seconds | Saturation percentage |
|---|---|---|---|
| A | 7910 | 326 | 4.121365% |
| B | 7910 | 552 | 6.978508% |
| C | 7911 | 406 | 5.132095% |
| D | 7911 | 288 | 3.640501% |
Noise dominated data is calculated using 1-second bins in cleaned event files. If a bin has >2000 counts, and if more than 50% of those come from <1% of pixels, then it is considered to be noise-dominated and hence unusable.
| Quadrant | # 1 sec bins | Bins with >0 counts | Bins with >2000 counts | High rate bins dominated by noise | Noise dominated (total time) | Noise dominated (detector-on time) | Marked lightcurve |
|---|---|---|---|---|---|---|---|
| A | 8240 | 7914 | 1 | 1 | 0.01% | 0.01% | 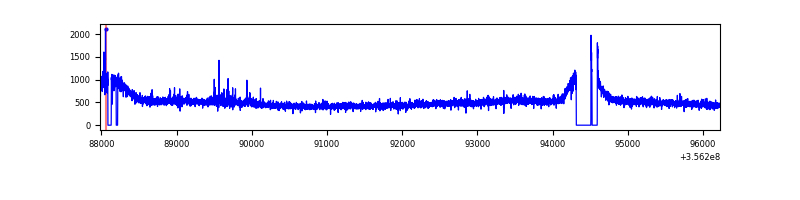 |
| B | 8240 | 7914 | 25 | 25 | 0.30% | 0.32% | 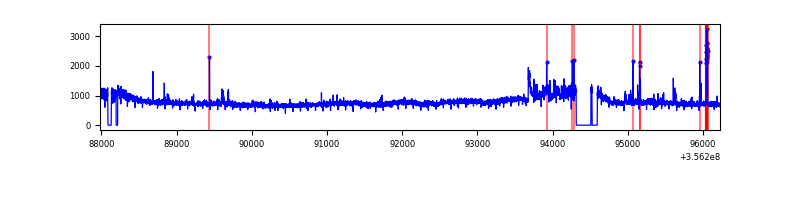 |
| C | 8241 | 7915 | 2 | 2 | 0.02% | 0.03% | 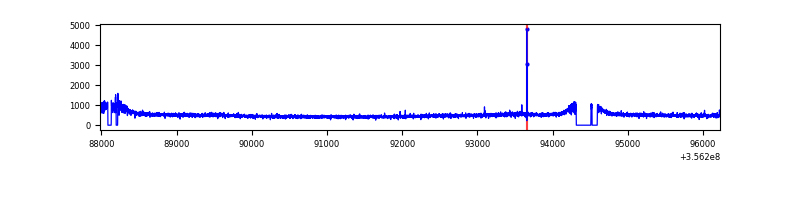 |
| D | 8241 | 7915 | 29 | 29 | 0.35% | 0.37% | 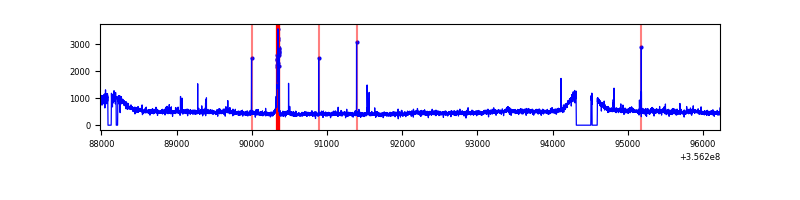 |
Top three noisy pixels from each quadrant. If the there are fewer than three noisy pixels in the level2.evt file, extra rows are filled as -1
| Pixel properties | Quadrant properties | ||||||
|---|---|---|---|---|---|---|---|
| Quadrant | DetID | PixID | Counts | Sigma | Mean | Median | Sigma |
| A | 12 | 96 | 42102 | 195.62 | 1030 | 1006 | 210.1 |
| A | 5 | 203 | 36838 | 170.56 | 1030 | 1006 | 210.1 |
| A | 8 | 192 | 18239 | 82.03 | 1030 | 1006 | 210.1 |
| B | 6 | 159 | 2081952 | 10499.46 | 999 | 969 | 198.2 |
| B | 6 | 36 | 253376 | 1273.5 | 999 | 969 | 198.2 |
| B | 12 | 111 | 24945 | 120.97 | 999 | 969 | 198.2 |
| C | 14 | 238 | 155271 | 662.16 | 981 | 989 | 233.0 |
| C | 3 | 233 | 63550 | 268.51 | 981 | 989 | 233.0 |
| C | 2 | 114 | 18542 | 75.34 | 981 | 989 | 233.0 |
| D | 8 | 195 | 158195 | 647.98 | 1005 | 980 | 242.6 |
| D | 13 | 138 | 80001 | 325.69 | 1005 | 980 | 242.6 |
| D | 2 | 234 | 33746 | 135.05 | 1005 | 980 | 242.6 |
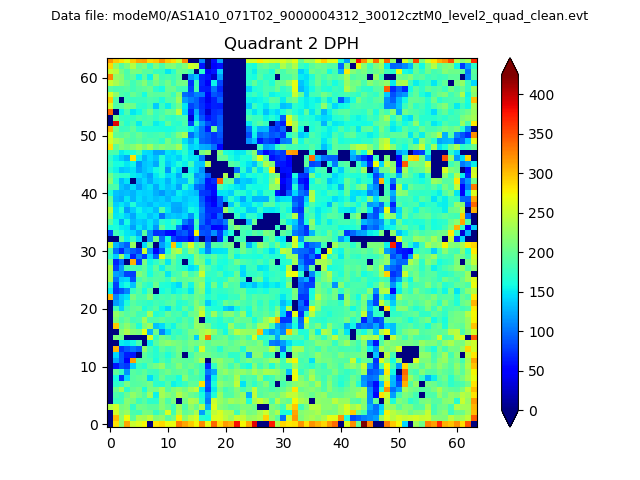
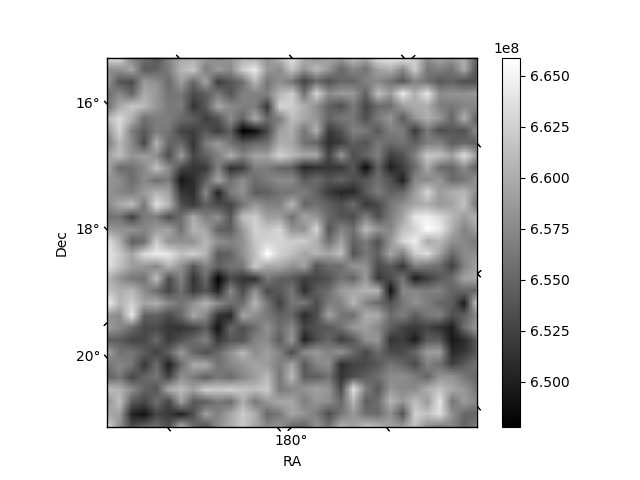
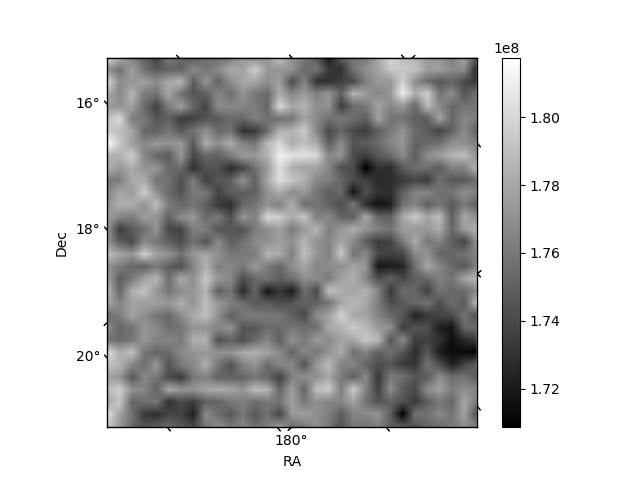
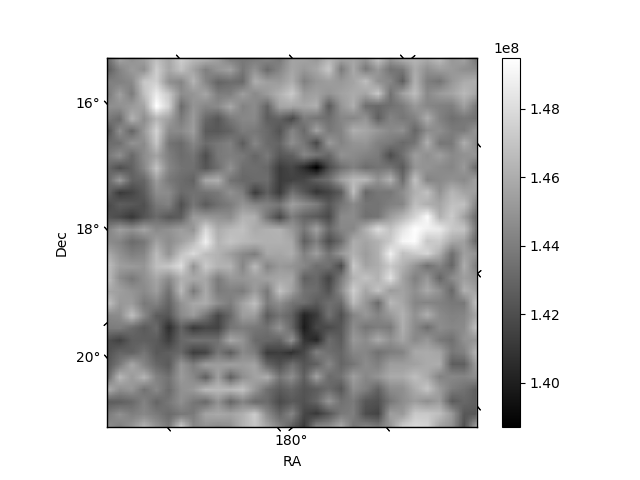
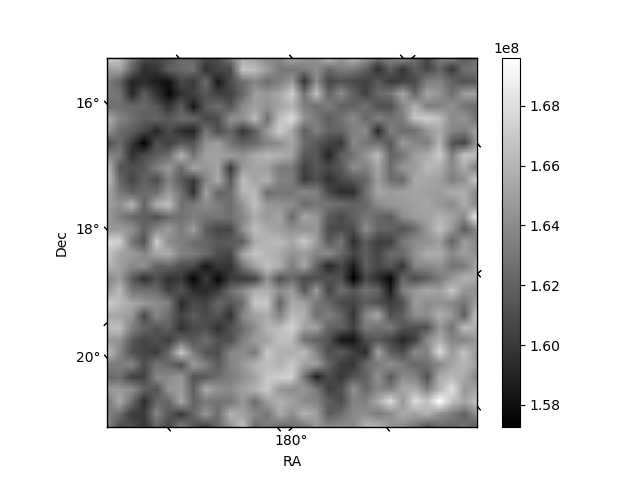
Histogram calculated using DETX and DETY for each event in the final _common_clean file
| Quadrant A | 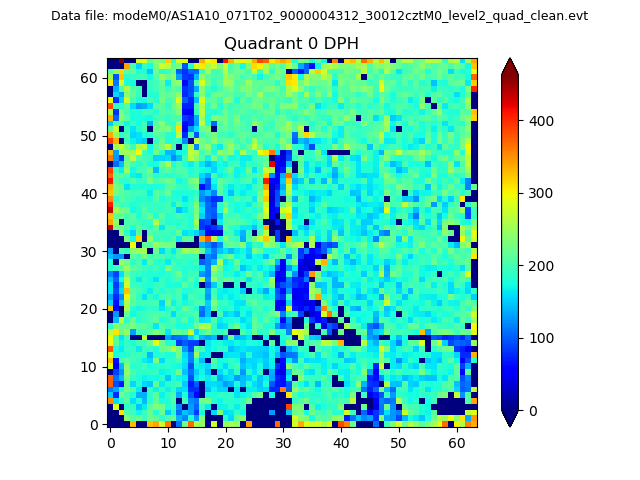 |
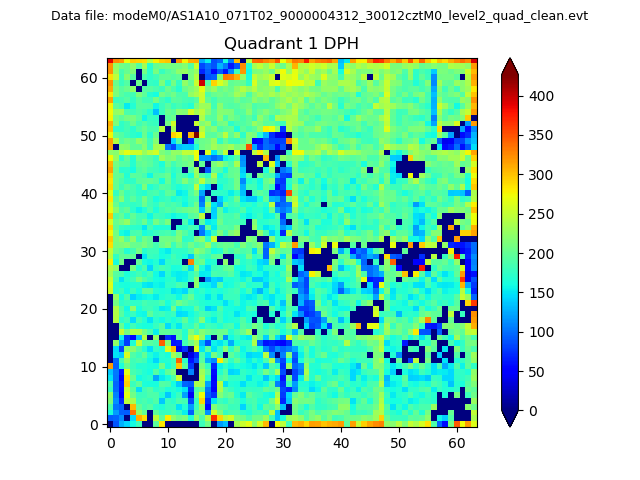 |
Quadrant B |
|---|---|---|---|
| Quadrant D | 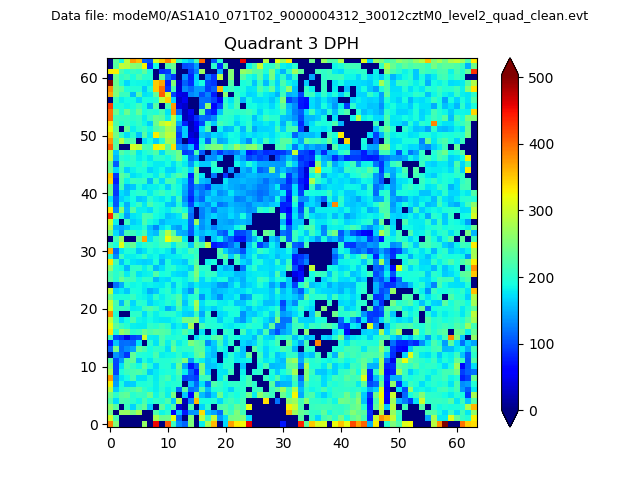 |
 |
Quadrant C |
| Plot type | Count rate plots | Images |
|---|---|---|
| Comparison with Poisson distribution Blue bars denote a histogram of data divided into 1 sec bins. Red curve is a Poisson curve with rate = median count rate of data. |
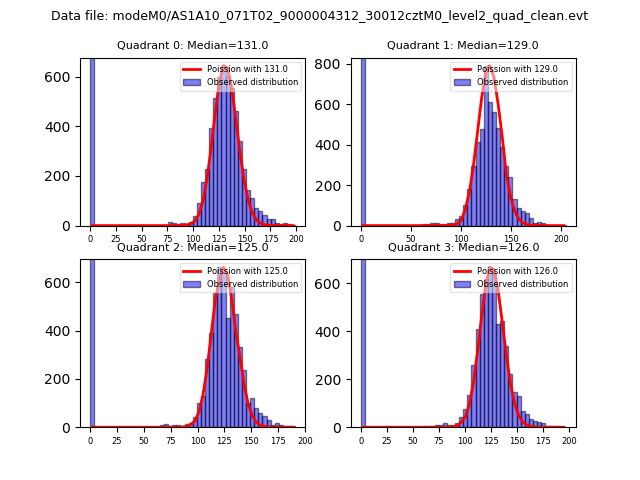 |
 |
| Quadrant-wise count rates Data is divided into 100 sec bins |
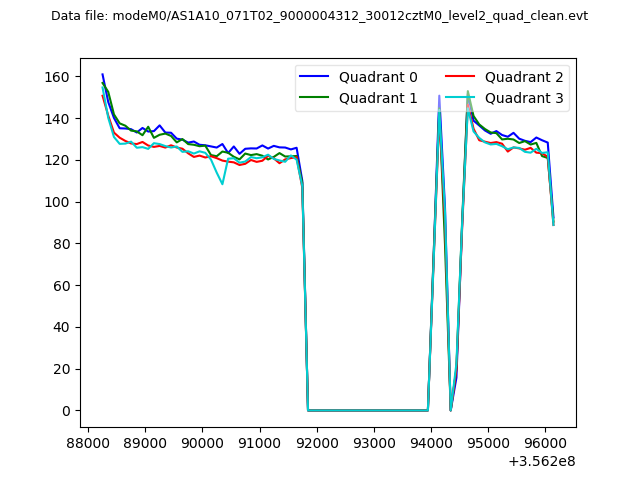 |
|
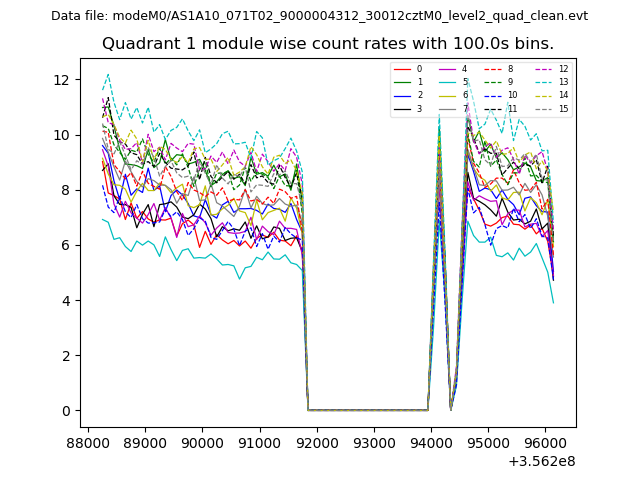
| Module-wise count rates for Quadrant A Data is divided into 100 sec bins |
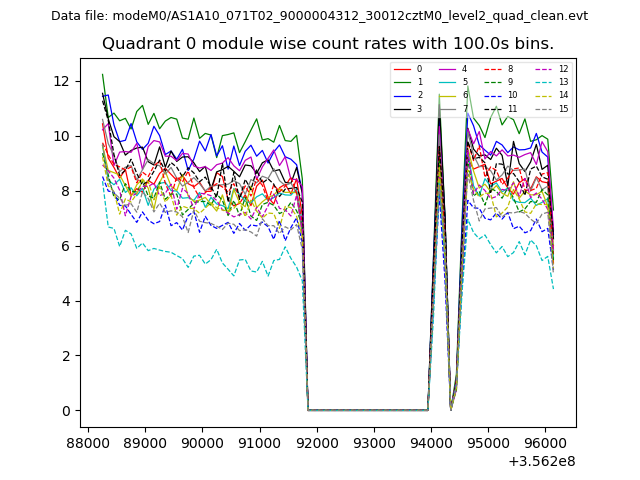 |
 |
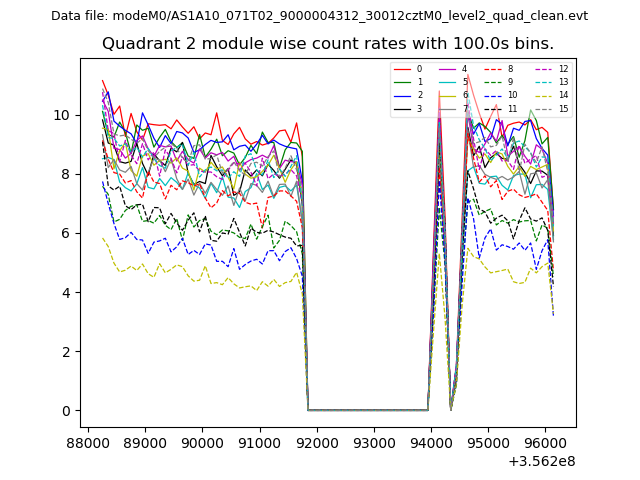
| Module-wise count rates for Quadrant B Data is divided into 100 sec bins |
 |
 |
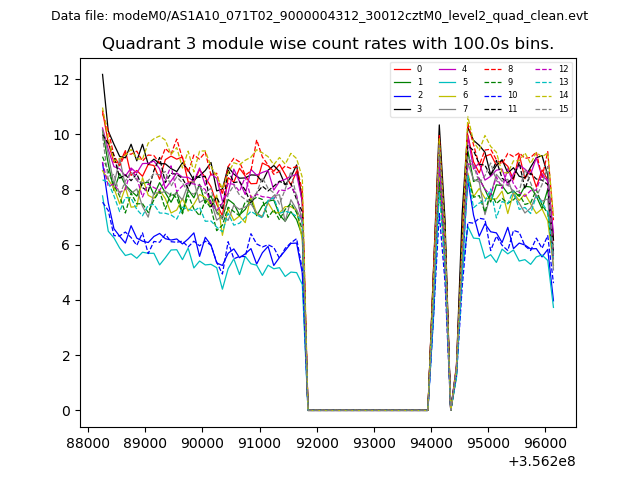
| Module-wise count rates for Quadrant C Data is divided into 100 sec bins |
 |
 |
| Module-wise count rates for Quadrant D Data is divided into 100 sec bins |
 |
 |
| Parameter | Plot |
|---|---|
| CZT HV Monitor | 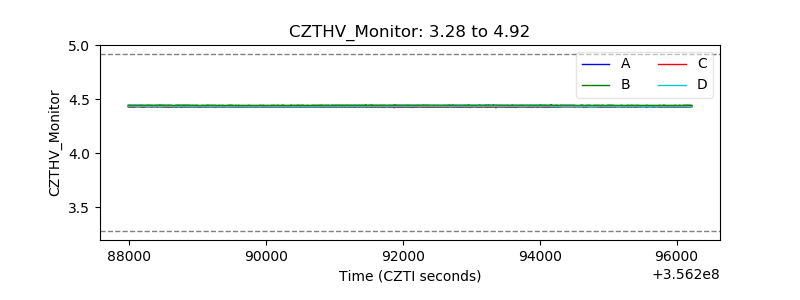 |
| D_VDD | 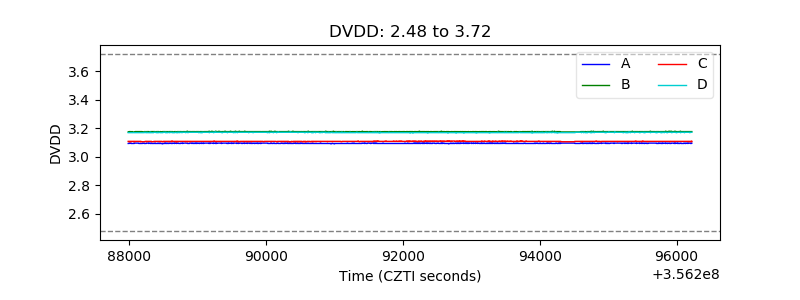 |
| Temperature 1 |  |
| Veto HV Monitor | 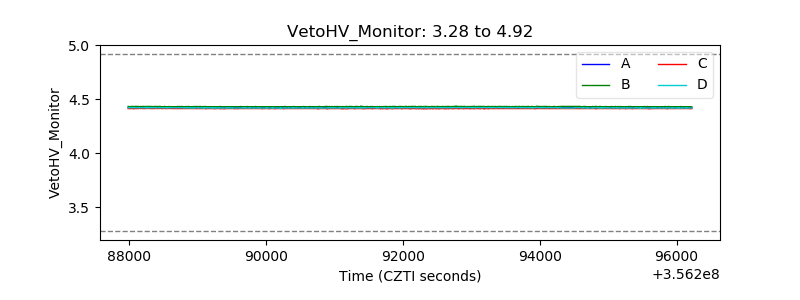 |
| Veto LLD | 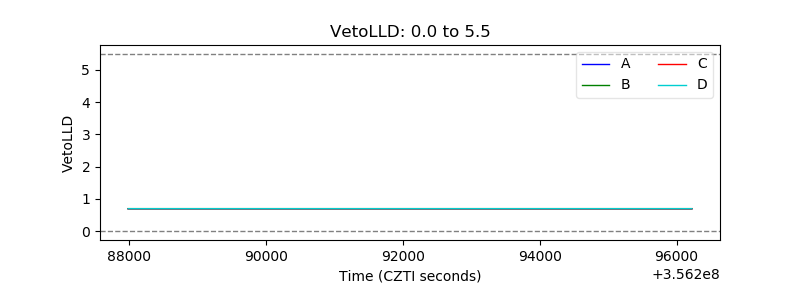 |
| Alpha Counter | 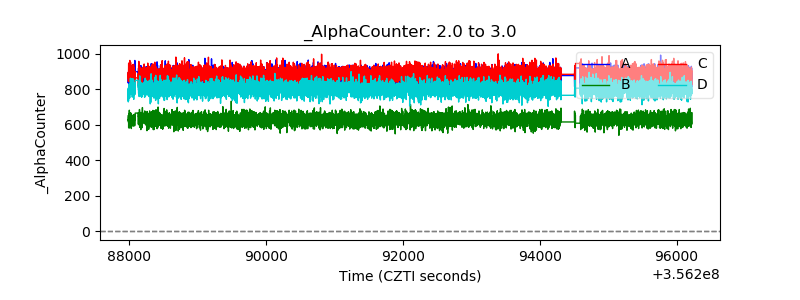 |
| _CPM_Rate | 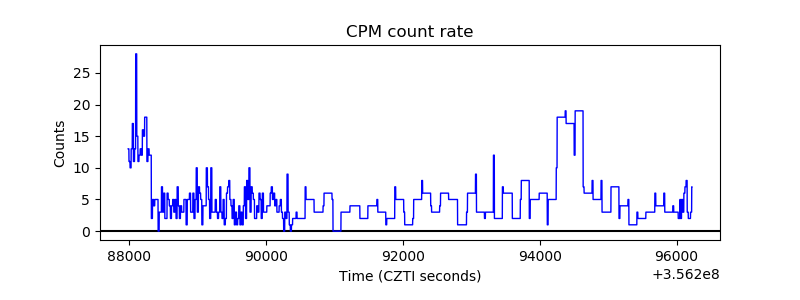 |
| CZT Counter | 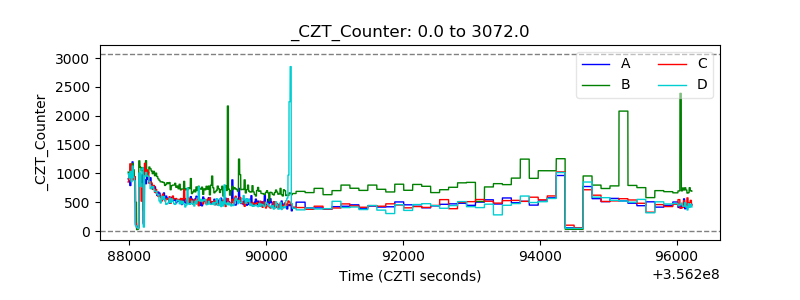 |
| +2.5 Volts monitor |  |
| +5 Volts monitor |  |
| _ROLL_ROT | 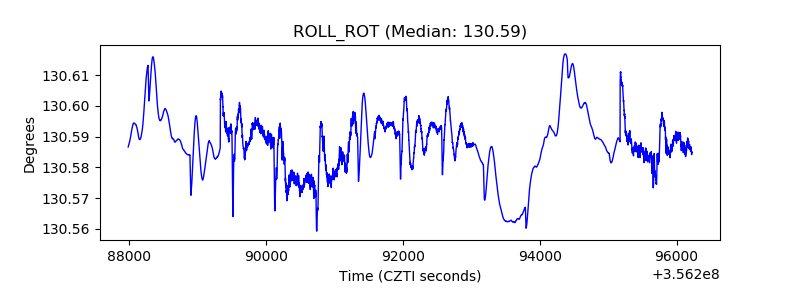 |
| _Roll_DEC |  |
| _Roll_RA | 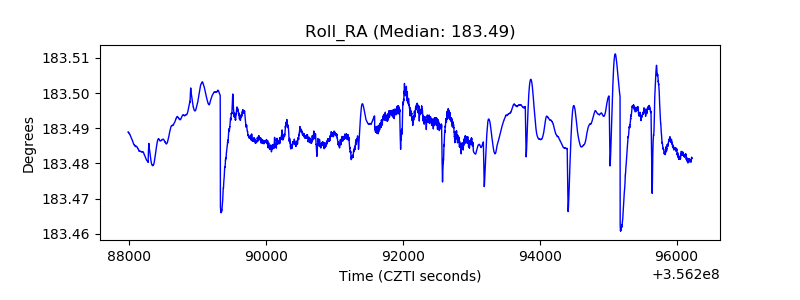 |
| Veto Counter |  |