| Param | Original file | Final file |
|---|---|---|
| Filename | modeM0/AS1A10_071T02_9000004312_30015cztM0_level2.evt | modeM0/AS1A10_071T02_9000004312_30015cztM0_level2_quad_clean.evt |
| Size (bytes) | 1,017,976,320 | 176,261,760 |
| Size | 970.8 MB | 168.1 MB |
| Events in quadrant A | 6,517,853 | 1,129,976 |
| Events in quadrant B | 10,469,731 | 1,131,685 |
| Events in quadrant C | 6,486,642 | 1,075,739 |
| Events in quadrant D | 6,474,965 | 1,100,509 |
| Mode M9 | |||
|---|---|---|---|
| Quadrant | BADHDUFLAG | Total packets | Discarded packets |
| A | 0 | 11 | 0 |
| B | 0 | 12 | 0 |
| C | 0 | 12 | 0 |
| D | 0 | 12 | 0 |
| Mode SS | |||
|---|---|---|---|
| Quadrant | BADHDUFLAG | Total packets | Discarded packets |
| A | 0 | 268 | 0 |
| B | 0 | 268 | 0 |
| C | 0 | 268 | 0 |
| D | 0 | 268 | 0 |
| Mode M0 | |||
|---|---|---|---|
| Quadrant | BADHDUFLAG | Total packets | Discarded packets |
| A | 0 | 27975 | 3 |
| B | 0 | 41086 | 3 |
| C | 0 | 27696 | 3 |
| D | 0 | 28017 | 3 |
| Quadrant | Total seconds | Saturated seconds | Saturation percentage |
|---|---|---|---|
| A | 13024 | 134 | 1.028870% |
| B | 13024 | 428 | 3.286241% |
| C | 13024 | 409 | 3.140356% |
| D | 13024 | 82 | 0.629607% |
Noise dominated data is calculated using 1-second bins in cleaned event files. If a bin has >2000 counts, and if more than 50% of those come from <1% of pixels, then it is considered to be noise-dominated and hence unusable.
| Quadrant | # 1 sec bins | Bins with >0 counts | Bins with >2000 counts | High rate bins dominated by noise | Noise dominated (total time) | Noise dominated (detector-on time) | Marked lightcurve |
|---|---|---|---|---|---|---|---|
| A | 14144 | 13027 | 2 | 2 | 0.01% | 0.02% | 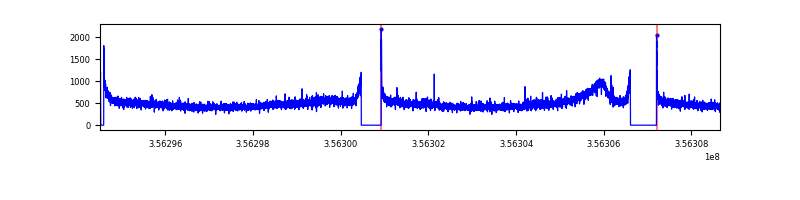 |
| B | 14144 | 13027 | 100 | 100 | 0.71% | 0.77% | 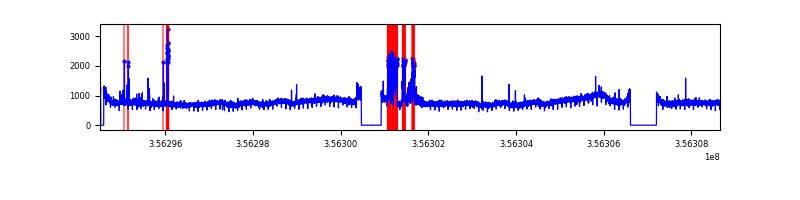 |
| C | 14144 | 13027 | 0 | 0 | 0.00% | 0.00% | 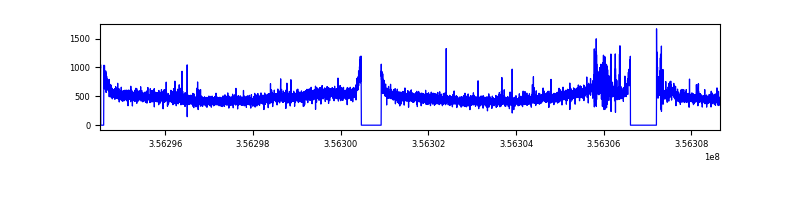 |
| D | 14144 | 13027 | 17 | 17 | 0.12% | 0.13% | 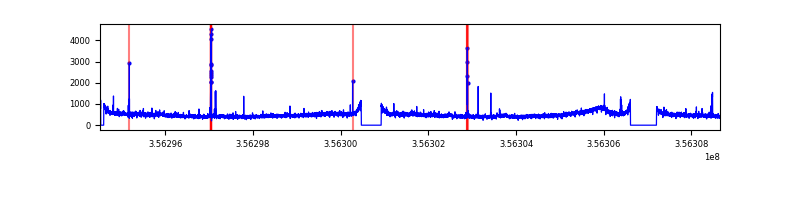 |
Top three noisy pixels from each quadrant. If the there are fewer than three noisy pixels in the level2.evt file, extra rows are filled as -1
| Pixel properties | Quadrant properties | ||||||
|---|---|---|---|---|---|---|---|
| Quadrant | DetID | PixID | Counts | Sigma | Mean | Median | Sigma |
| A | 5 | 203 | 57219 | 166.46 | 1657 | 1625 | 334.0 |
| A | 8 | 192 | 45791 | 132.24 | 1657 | 1625 | 334.0 |
| A | 13 | 254 | 22581 | 62.75 | 1657 | 1625 | 334.0 |
| B | 6 | 159 | 3607741 | 11654.0 | 1600 | 1560 | 309.4 |
| B | 6 | 36 | 525250 | 1692.4 | 1600 | 1560 | 309.4 |
| B | 12 | 111 | 38965 | 120.88 | 1600 | 1560 | 309.4 |
| C | 14 | 238 | 287249 | 779.51 | 1543 | 1551 | 366.5 |
| C | 3 | 233 | 95464 | 256.24 | 1543 | 1551 | 366.5 |
| C | 14 | 254 | 63375 | 168.68 | 1543 | 1551 | 366.5 |
| D | 8 | 195 | 285851 | 738.16 | 1594 | 1561 | 385.1 |
| D | 7 | 80 | 66388 | 168.32 | 1594 | 1561 | 385.1 |
| D | 2 | 234 | 58502 | 147.85 | 1594 | 1561 | 385.1 |
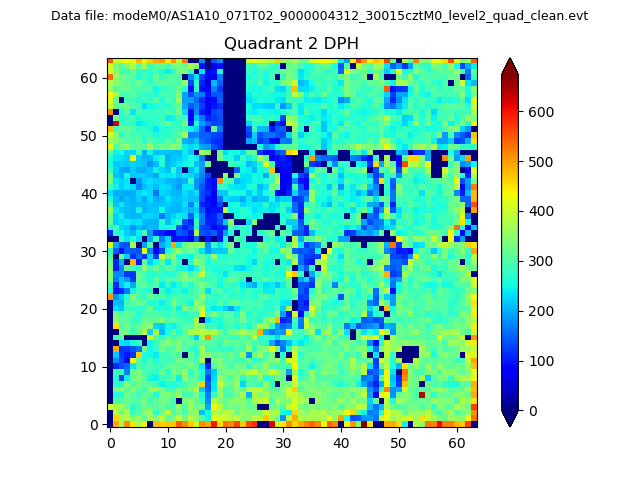
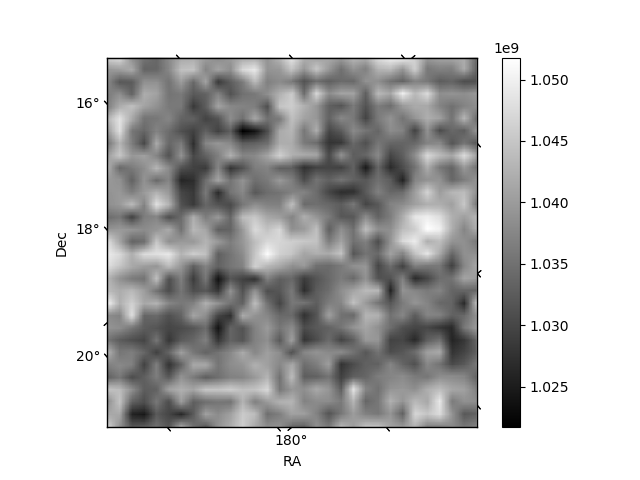
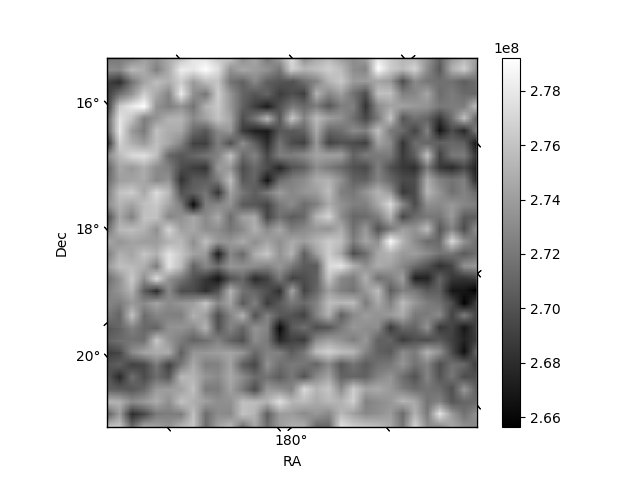
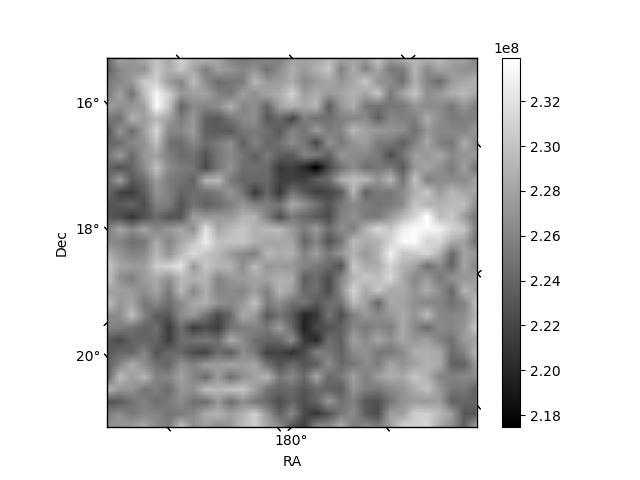
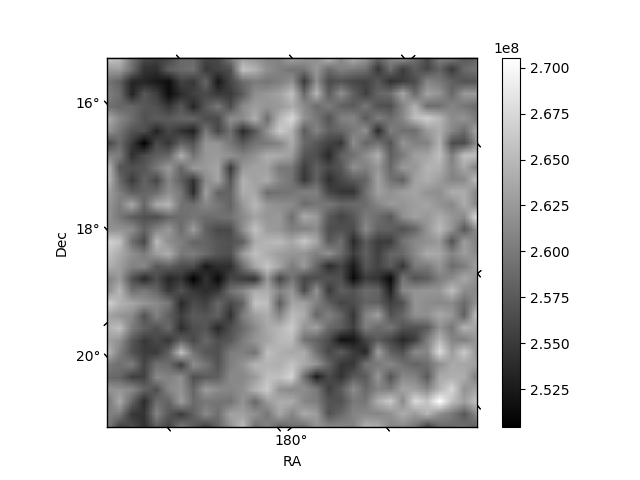
Histogram calculated using DETX and DETY for each event in the final _common_clean file
| Quadrant A | 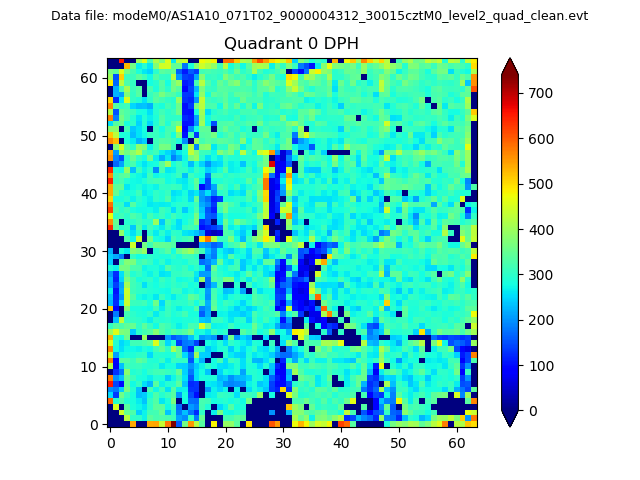 |
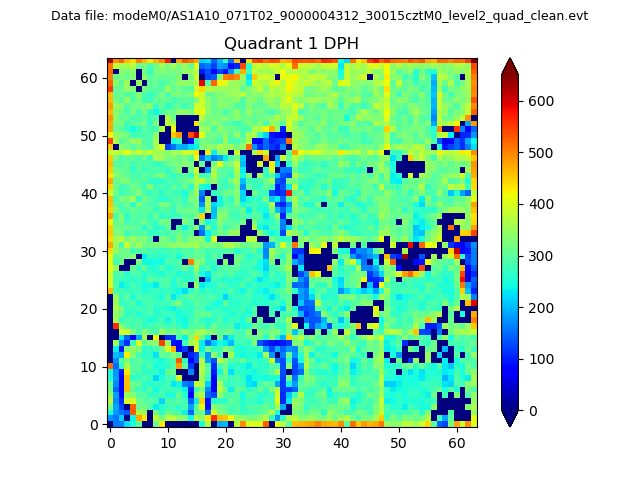 |
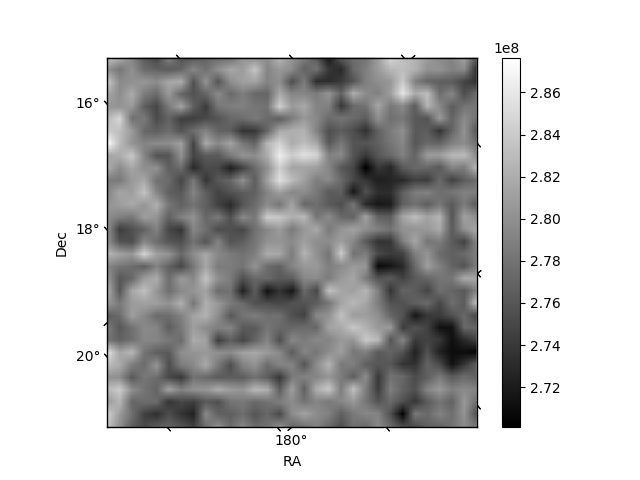
Quadrant B |
|---|---|---|---|
| Quadrant D | 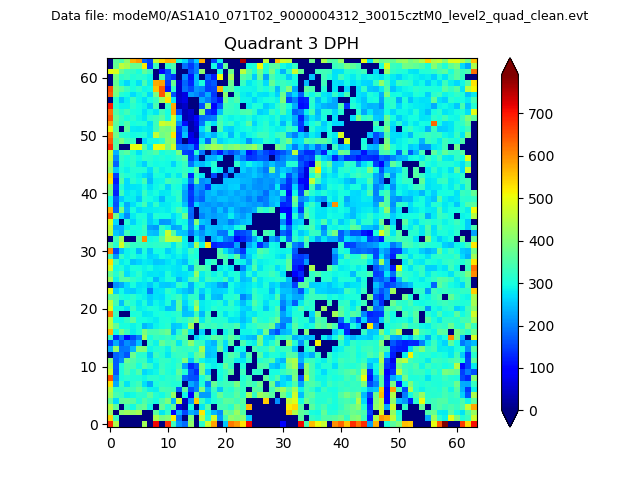 |
 |
Quadrant C |
| Plot type | Count rate plots | Images |
|---|---|---|
| Comparison with Poisson distribution Blue bars denote a histogram of data divided into 1 sec bins. Red curve is a Poisson curve with rate = median count rate of data. |
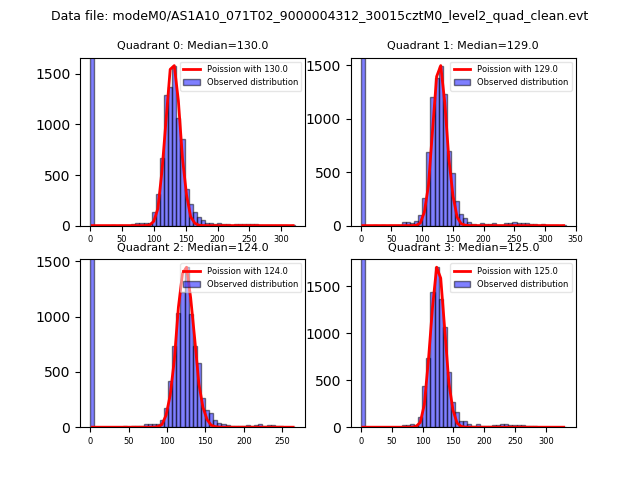 |
 |
| Quadrant-wise count rates Data is divided into 100 sec bins |
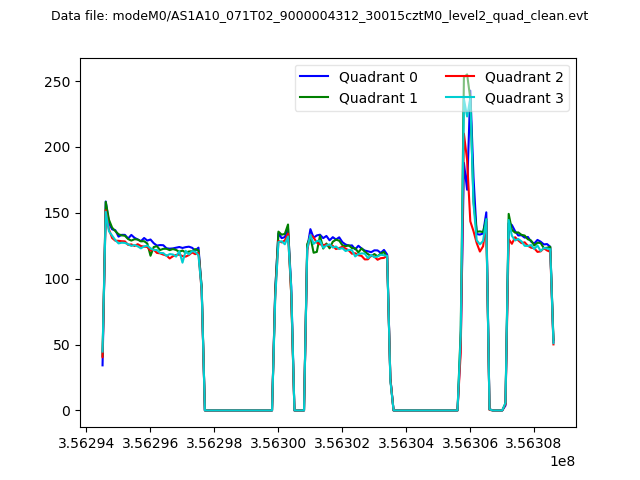 |
|
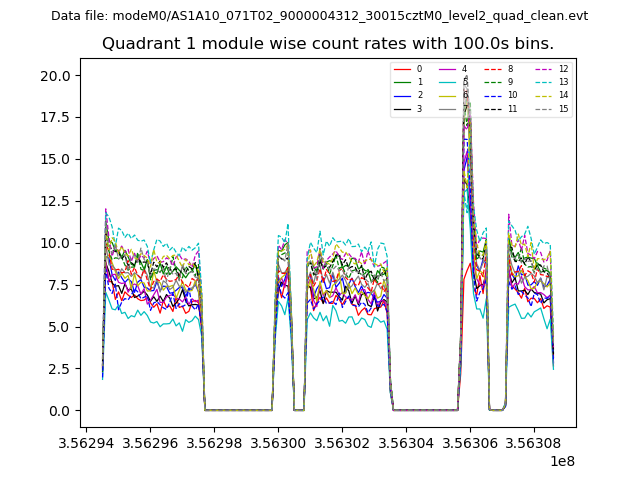
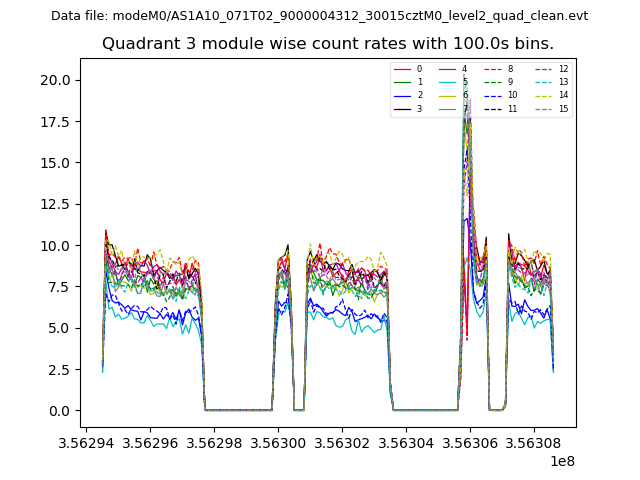
| Module-wise count rates for Quadrant A Data is divided into 100 sec bins |
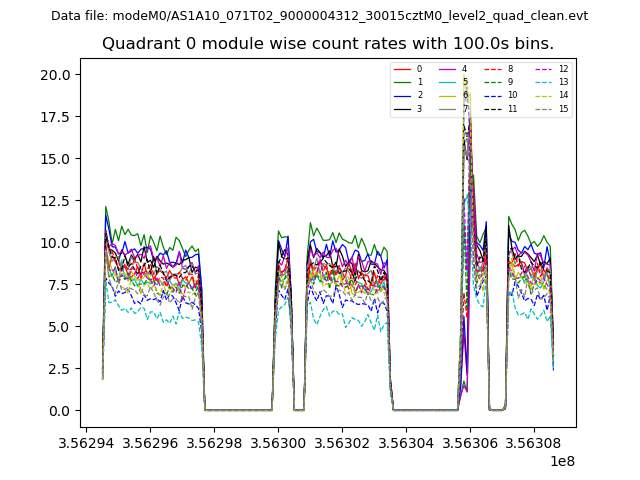 |
 |
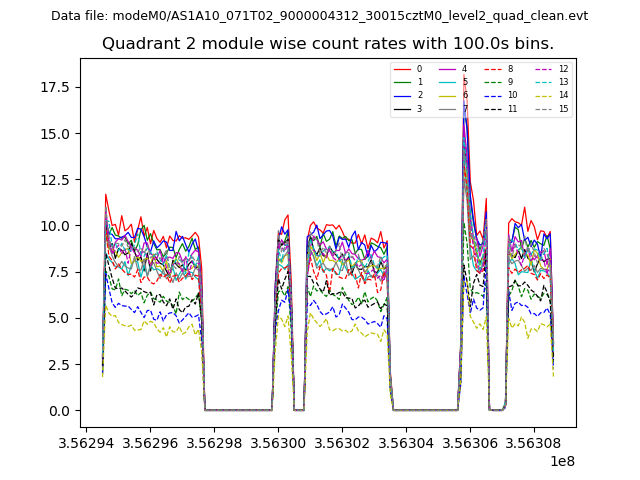
| Module-wise count rates for Quadrant B Data is divided into 100 sec bins |
 |
 |
| Module-wise count rates for Quadrant C Data is divided into 100 sec bins |
 |
 |
| Module-wise count rates for Quadrant D Data is divided into 100 sec bins |
 |
 |
| Parameter | Plot |
|---|---|
| CZT HV Monitor |  |
| D_VDD | 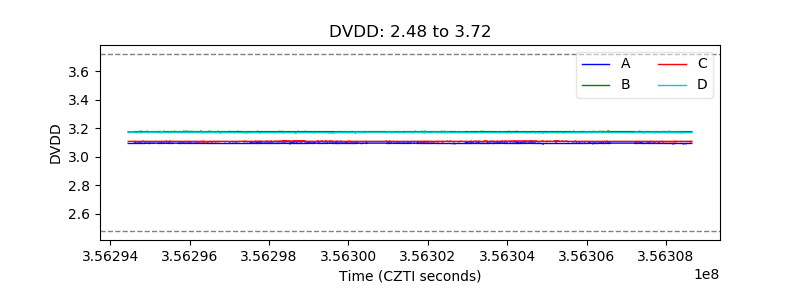 |
| Temperature 1 | 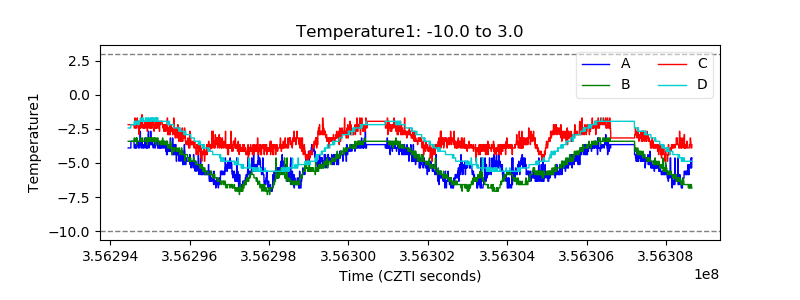 |
| Veto HV Monitor | 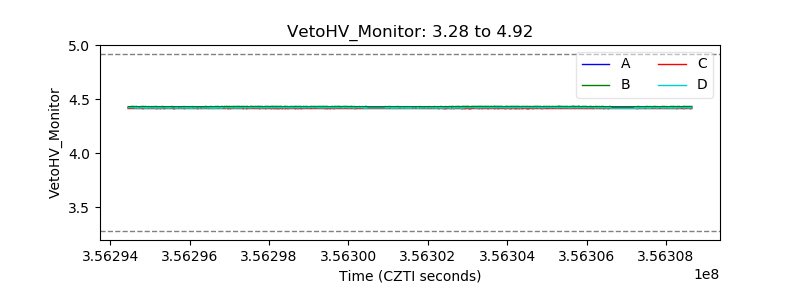 |
| Veto LLD | 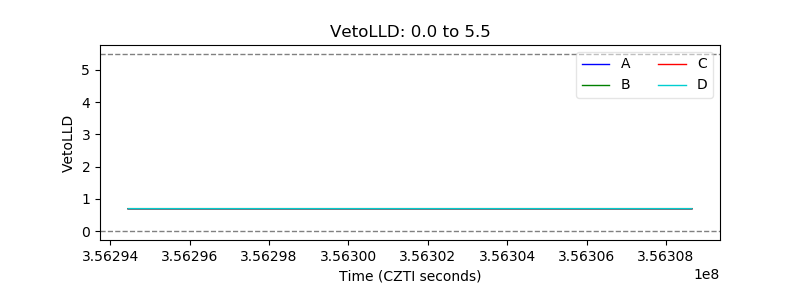 |
| Alpha Counter | 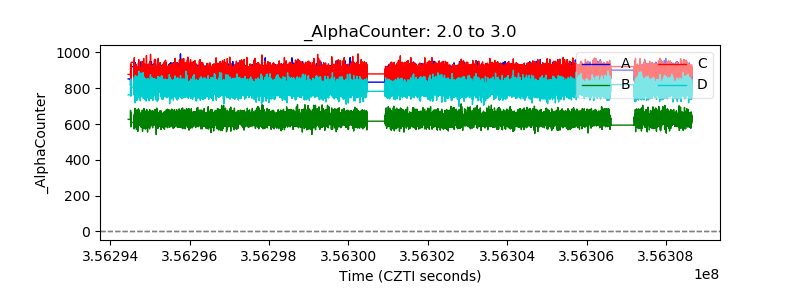 |
| _CPM_Rate | 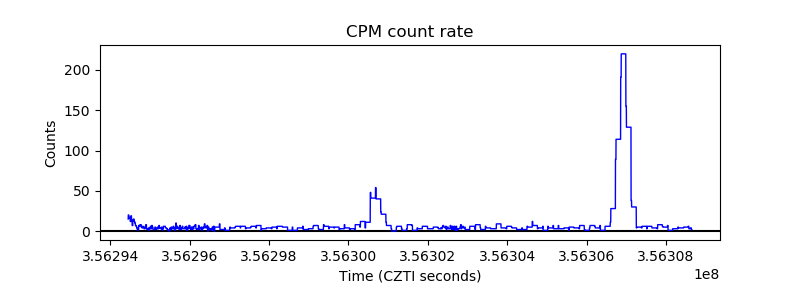 |
| CZT Counter | 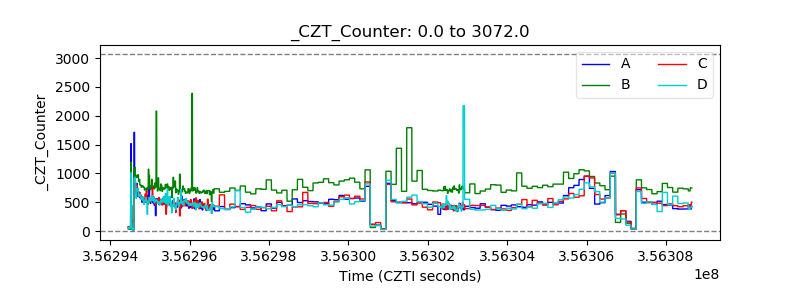 |
| +2.5 Volts monitor |  |
| +5 Volts monitor |  |
| _ROLL_ROT | 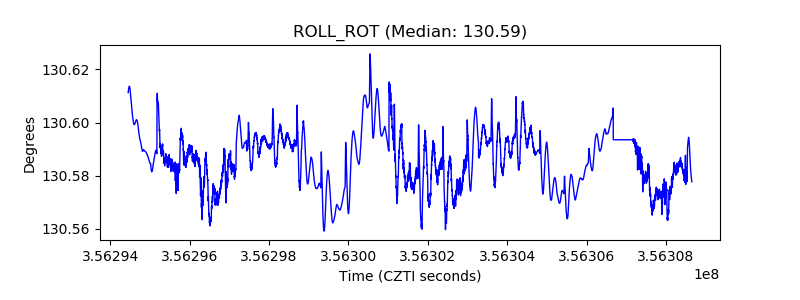 |
| _Roll_DEC | 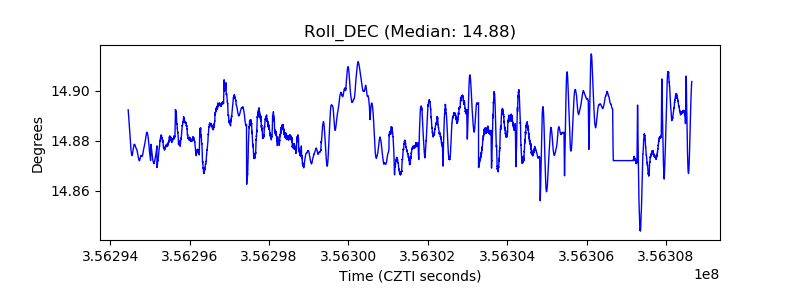 |
| _Roll_RA | 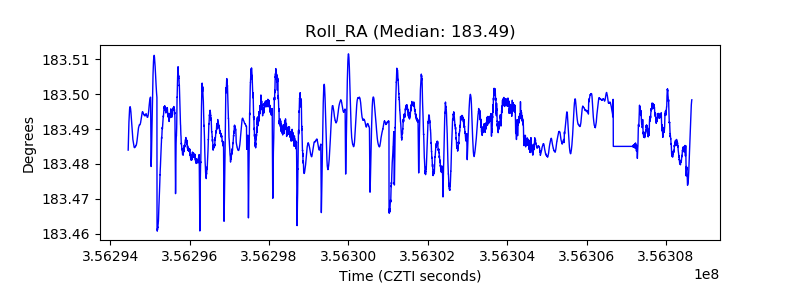 |
| Veto Counter |  |