| Param | Original file | Final file |
|---|---|---|
| Filename | modeM0/AS1A10_071T03_9000004314_30016cztM0_level2.evt | modeM0/AS1A10_071T03_9000004314_30016cztM0_level2_quad_clean.evt |
| Size (bytes) | 522,264,960 | 92,289,600 |
| Size | 498.1 MB | 88.0 MB |
| Events in quadrant A | 3,268,912 | 594,032 |
| Events in quadrant B | 5,215,821 | 594,219 |
| Events in quadrant C | 3,267,754 | 567,424 |
| Events in quadrant D | 3,602,111 | 564,194 |
| Mode M9 | |||
|---|---|---|---|
| Quadrant | BADHDUFLAG | Total packets | Discarded packets |
| A | 0 | 9 | 0 |
| B | 0 | 10 | 0 |
| C | 0 | 10 | 0 |
| D | 0 | 10 | 0 |
| Mode M0 | |||
|---|---|---|---|
| Quadrant | BADHDUFLAG | Total packets | Discarded packets |
| A | 0 | 13978 | 2 |
| B | 0 | 20492 | 2 |
| C | 0 | 13978 | 2 |
| D | 0 | 15344 | 3 |
| Mode SS | |||
|---|---|---|---|
| Quadrant | BADHDUFLAG | Total packets | Discarded packets |
| A | 0 | 140 | 0 |
| B | 0 | 140 | 0 |
| C | 0 | 140 | 0 |
| D | 0 | 140 | 0 |
| Quadrant | Total seconds | Saturated seconds | Saturation percentage |
|---|---|---|---|
| A | 6811 | 32 | 0.469828% |
| B | 6811 | 59 | 0.866246% |
| C | 6811 | 59 | 0.866246% |
| D | 6810 | 17 | 0.249633% |
Noise dominated data is calculated using 1-second bins in cleaned event files. If a bin has >2000 counts, and if more than 50% of those come from <1% of pixels, then it is considered to be noise-dominated and hence unusable.
| Quadrant | # 1 sec bins | Bins with >0 counts | Bins with >2000 counts | High rate bins dominated by noise | Noise dominated (total time) | Noise dominated (detector-on time) | Marked lightcurve |
|---|---|---|---|---|---|---|---|
| A | 7766 | 6812 | 4 | 4 | 0.05% | 0.06% | 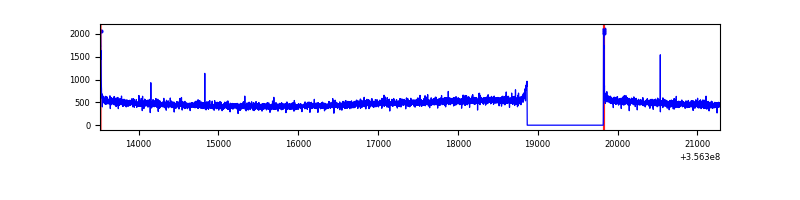 |
| B | 7766 | 6812 | 5 | 5 | 0.06% | 0.07% | 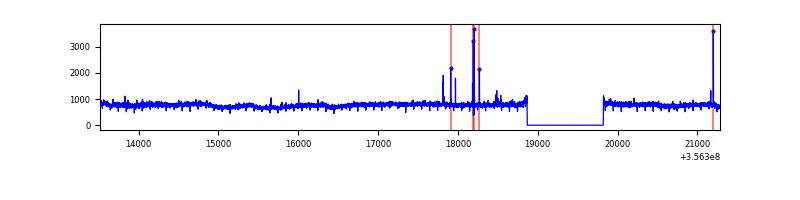 |
| C | 7766 | 6812 | 0 | 0 | 0.00% | 0.00% | 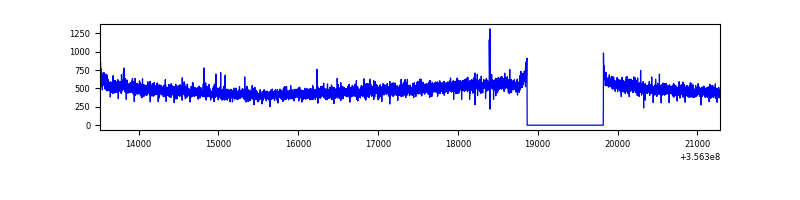 |
| D | 7765 | 6811 | 7 | 7 | 0.09% | 0.10% | 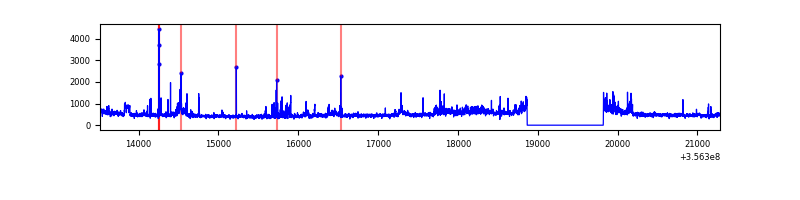 |
Top three noisy pixels from each quadrant. If the there are fewer than three noisy pixels in the level2.evt file, extra rows are filled as -1
| Pixel properties | Quadrant properties | ||||||
|---|---|---|---|---|---|---|---|
| Quadrant | DetID | PixID | Counts | Sigma | Mean | Median | Sigma |
| A | 8 | 192 | 33885 | 198.0 | 830 | 815 | 167.0 |
| A | 5 | 203 | 27317 | 158.67 | 830 | 815 | 167.0 |
| A | 13 | 254 | 12699 | 71.15 | 830 | 815 | 167.0 |
| B | 6 | 159 | 1948445 | 12222.75 | 820 | 801 | 159.3 |
| B | 10 | 247 | 27871 | 169.88 | 820 | 801 | 159.3 |
| B | 12 | 111 | 20148 | 121.42 | 820 | 801 | 159.3 |
| C | 14 | 238 | 132906 | 706.43 | 794 | 798 | 187.0 |
| C | 3 | 233 | 20418 | 104.91 | 794 | 798 | 187.0 |
| C | 2 | 114 | 15795 | 80.19 | 794 | 798 | 187.0 |
| D | 7 | 223 | 194103 | 1029.49 | 795 | 779 | 187.8 |
| D | 7 | 80 | 150760 | 798.68 | 795 | 779 | 187.8 |
| D | 8 | 195 | 143711 | 761.14 | 795 | 779 | 187.8 |
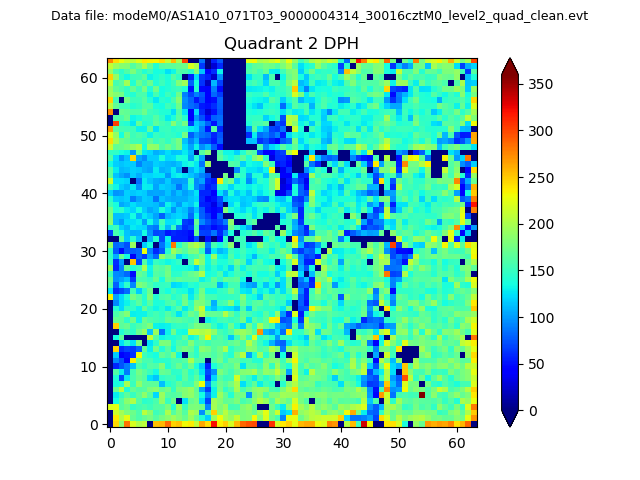
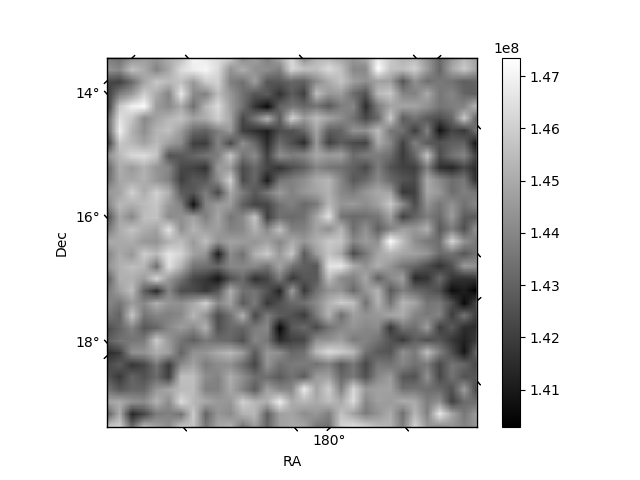
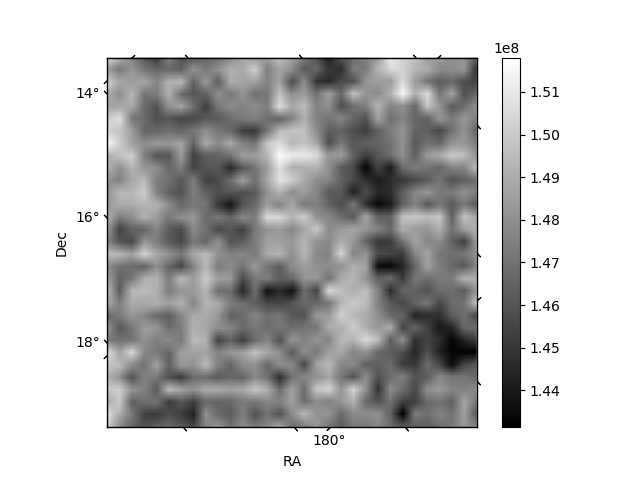
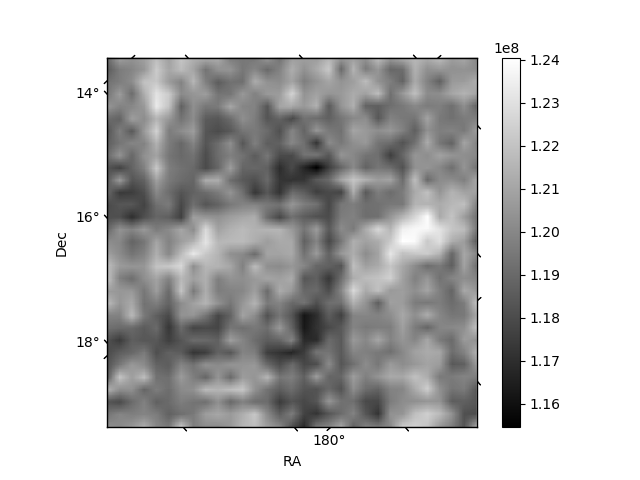
Histogram calculated using DETX and DETY for each event in the final _common_clean file
| Quadrant A | 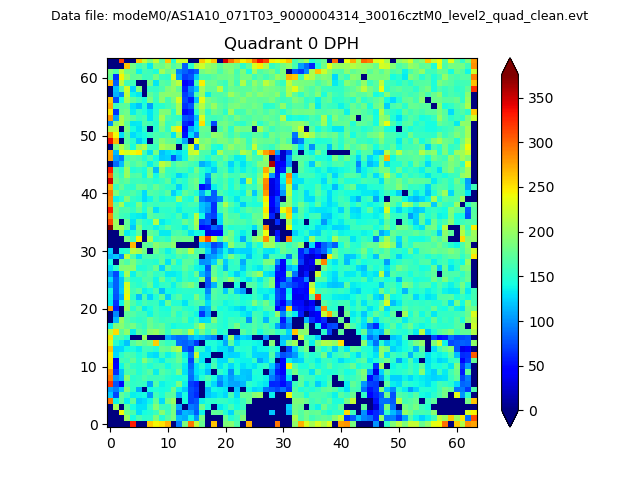 |
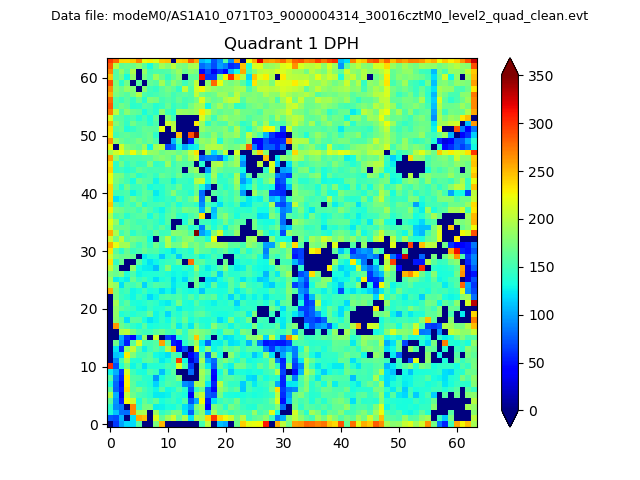 |
Quadrant B |
|---|---|---|---|
| Quadrant D | 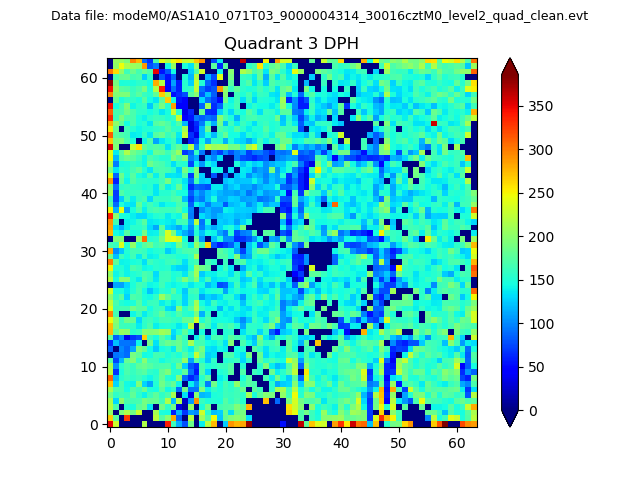 |
 |
Quadrant C |
| Plot type | Count rate plots | Images |
|---|---|---|
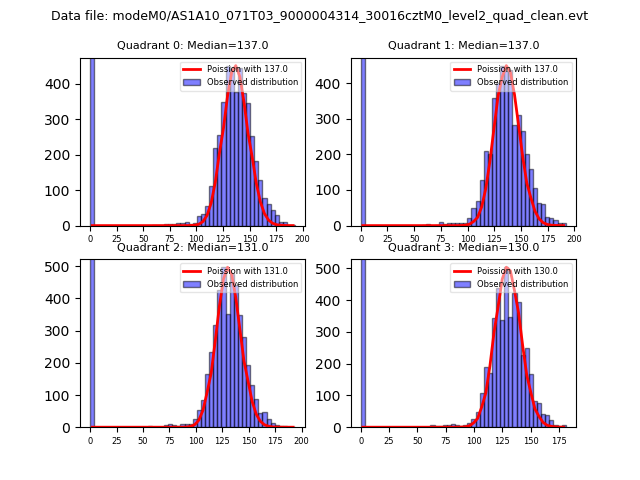
| Comparison with Poisson distribution Blue bars denote a histogram of data divided into 1 sec bins. Red curve is a Poisson curve with rate = median count rate of data. |
 |
 |
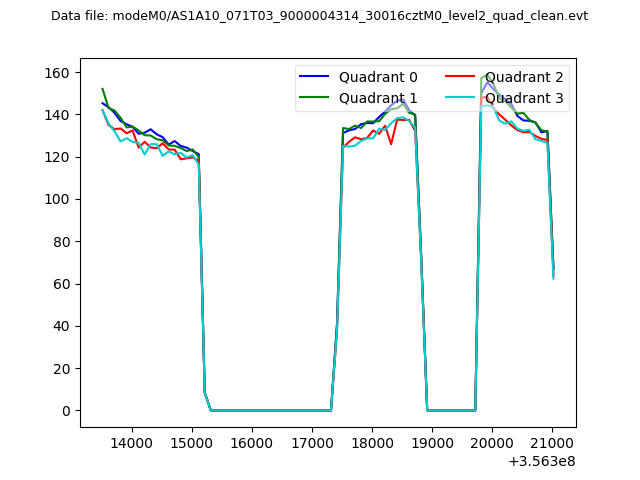
| Quadrant-wise count rates Data is divided into 100 sec bins |
 |
|
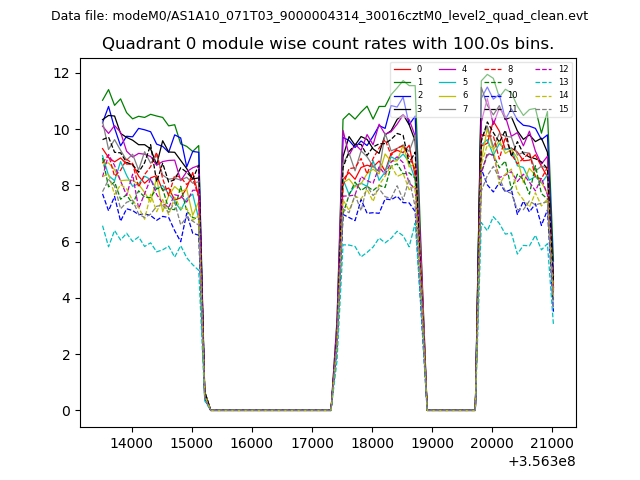
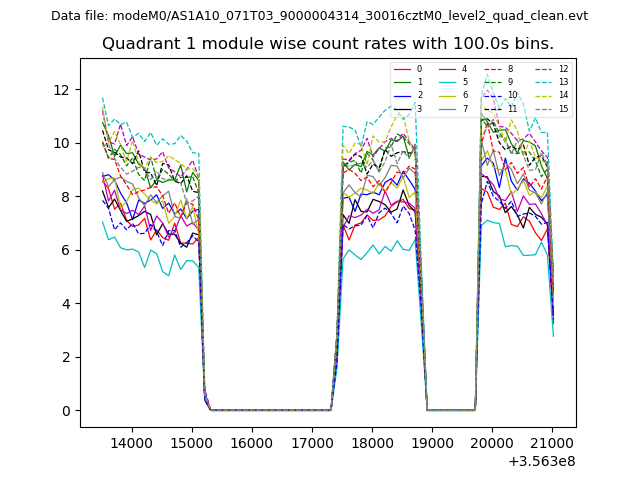
| Module-wise count rates for Quadrant A Data is divided into 100 sec bins |
 |
 |
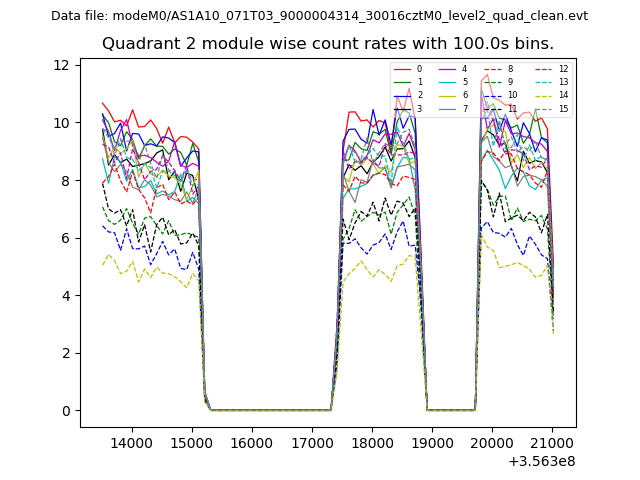
| Module-wise count rates for Quadrant B Data is divided into 100 sec bins |
 |
 |
| Module-wise count rates for Quadrant C Data is divided into 100 sec bins |
 |
 |
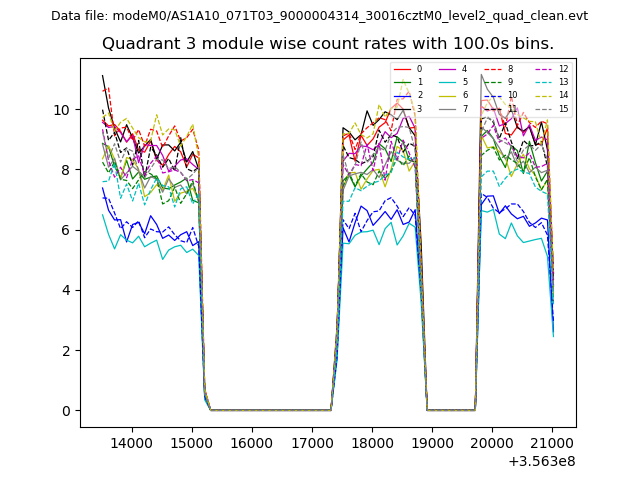
| Module-wise count rates for Quadrant D Data is divided into 100 sec bins |
 |
 |
| Parameter | Plot |
|---|---|
| CZT HV Monitor | 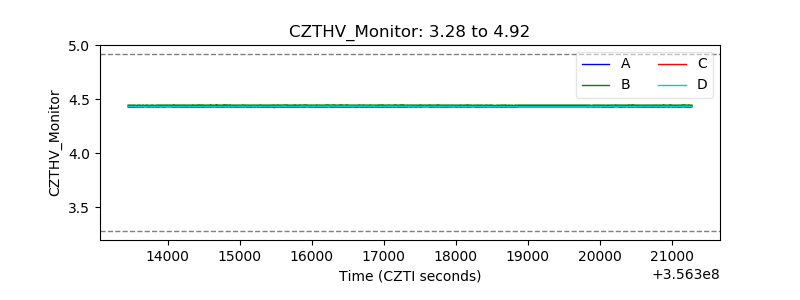 |
| D_VDD | 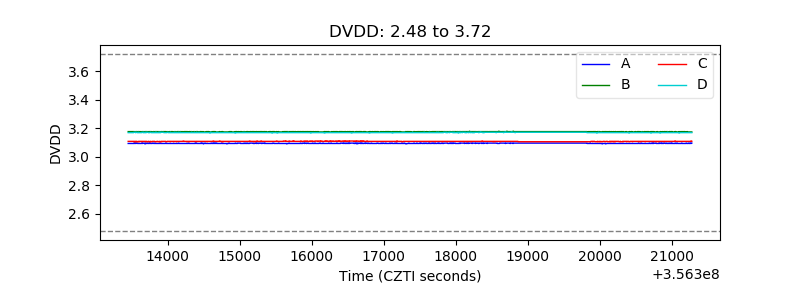 |
| Temperature 1 | 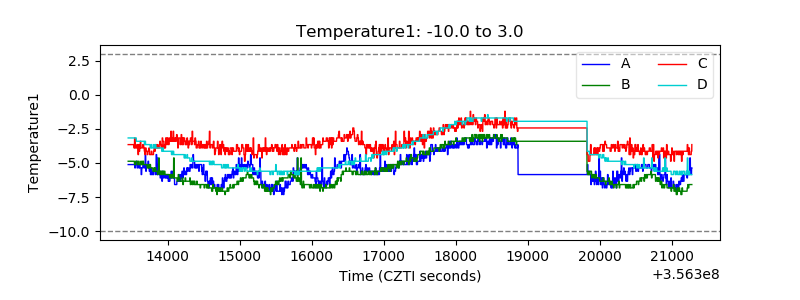 |
| Veto HV Monitor | 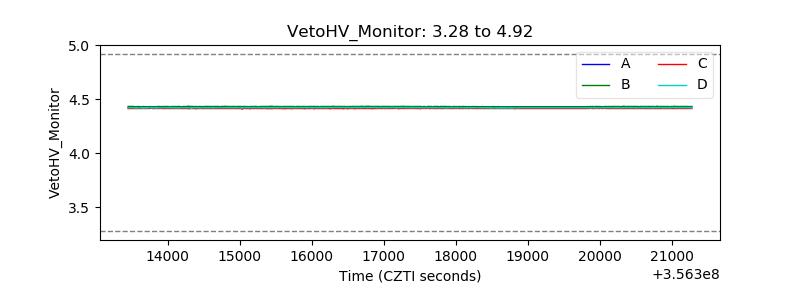 |
| Veto LLD | 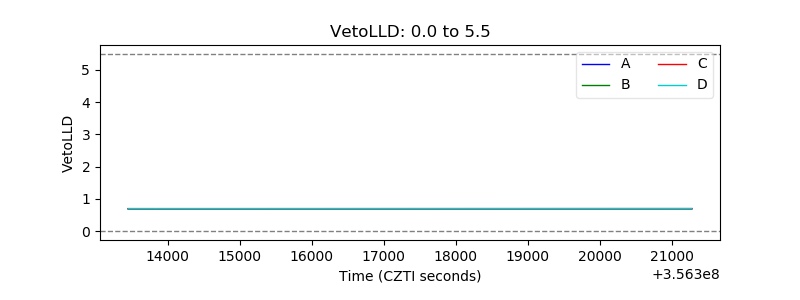 |
| Alpha Counter | 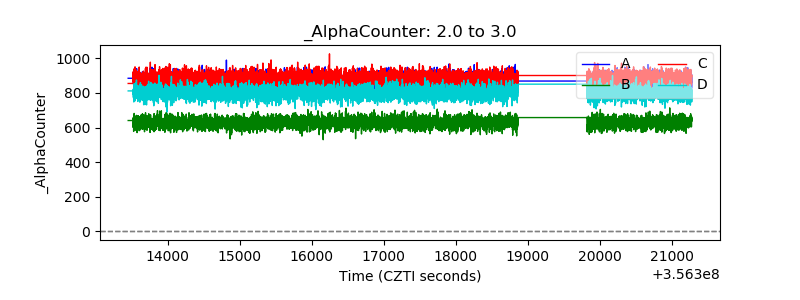 |
| _CPM_Rate | 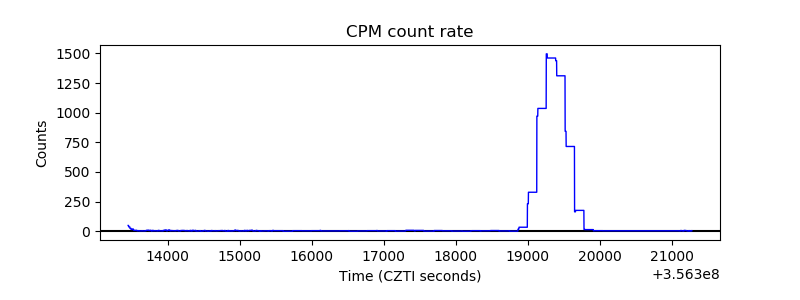 |
| CZT Counter | 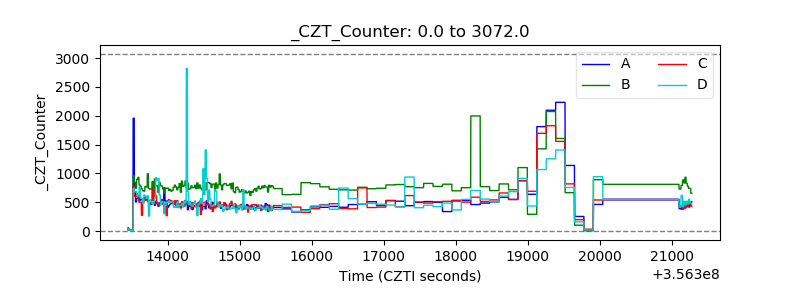 |
| +2.5 Volts monitor |  |
| +5 Volts monitor |  |
| _ROLL_ROT | 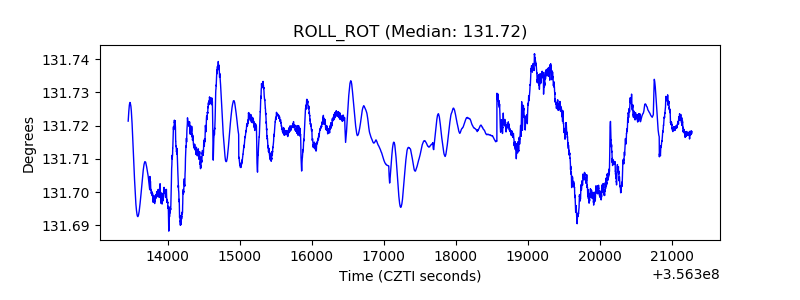 |
| _Roll_DEC | 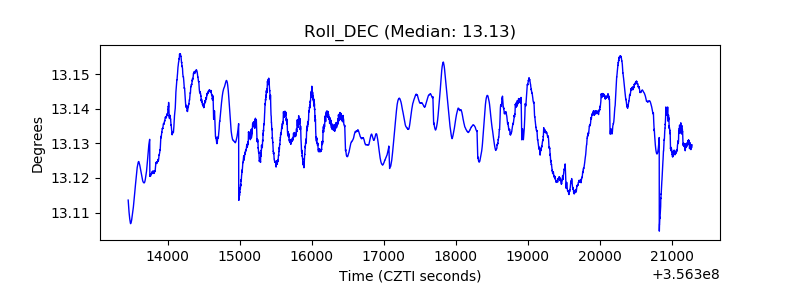 |
| _Roll_RA | 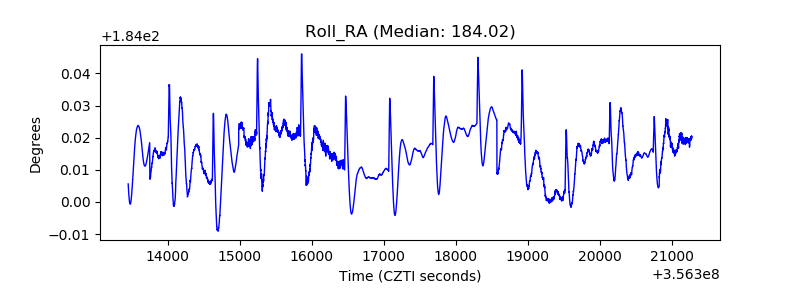 |
| Veto Counter |  |