| Param | Original file | Final file |
|---|---|---|
| Filename | modeM0/AS1A10_071T03_9000004314_30018cztM0_level2.evt | modeM0/AS1A10_071T03_9000004314_30018cztM0_level2_quad_clean.evt |
| Size (bytes) | 498,980,160 | 79,545,600 |
| Size | 475.9 MB | 75.9 MB |
| Events in quadrant A | 3,054,857 | 508,515 |
| Events in quadrant B | 4,814,227 | 510,306 |
| Events in quadrant C | 3,050,943 | 484,385 |
| Events in quadrant D | 3,769,621 | 471,021 |
| Mode M9 | |||
|---|---|---|---|
| Quadrant | BADHDUFLAG | Total packets | Discarded packets |
| A | 0 | 11 | 0 |
| B | 0 | 11 | 0 |
| C | 0 | 11 | 0 |
| D | 0 | 11 | 0 |
| Mode M0 | |||
|---|---|---|---|
| Quadrant | BADHDUFLAG | Total packets | Discarded packets |
| A | 0 | 12768 | 1 |
| B | 0 | 18783 | 1 |
| C | 0 | 12805 | 1 |
| D | 0 | 15437 | 1 |
| Mode SS | |||
|---|---|---|---|
| Quadrant | BADHDUFLAG | Total packets | Discarded packets |
| A | 0 | 128 | 0 |
| B | 0 | 128 | 0 |
| C | 0 | 128 | 0 |
| D | 0 | 128 | 0 |
| Quadrant | Total seconds | Saturated seconds | Saturation percentage |
|---|---|---|---|
| A | 6217 | 19 | 0.305614% |
| B | 6218 | 68 | 1.093599% |
| C | 6218 | 59 | 0.948858% |
| D | 6218 | 138 | 2.219363% |
Noise dominated data is calculated using 1-second bins in cleaned event files. If a bin has >2000 counts, and if more than 50% of those come from <1% of pixels, then it is considered to be noise-dominated and hence unusable.
| Quadrant | # 1 sec bins | Bins with >0 counts | Bins with >2000 counts | High rate bins dominated by noise | Noise dominated (total time) | Noise dominated (detector-on time) | Marked lightcurve |
|---|---|---|---|---|---|---|---|
| A | 7302 | 6218 | 2 | 2 | 0.03% | 0.03% | 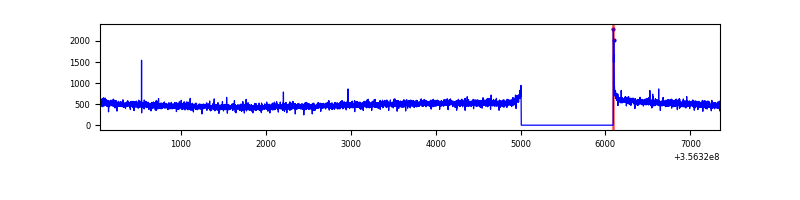 |
| B | 7303 | 6219 | 2 | 2 | 0.03% | 0.03% | 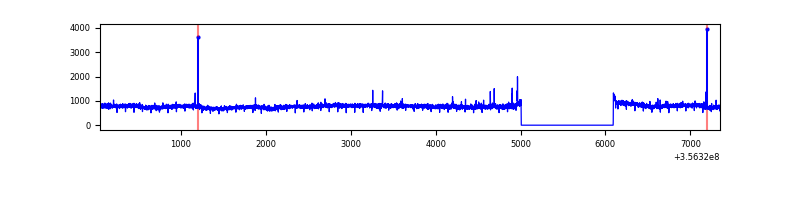 |
| C | 7303 | 6219 | 0 | 0 | 0.00% | 0.00% | 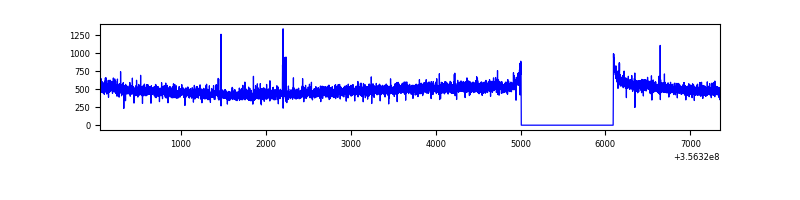 |
| D | 7303 | 6218 | 92 | 92 | 1.26% | 1.48% | 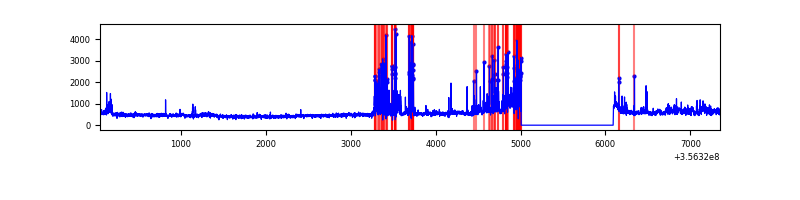 |
Top three noisy pixels from each quadrant. If the there are fewer than three noisy pixels in the level2.evt file, extra rows are filled as -1
| Pixel properties | Quadrant properties | ||||||
|---|---|---|---|---|---|---|---|
| Quadrant | DetID | PixID | Counts | Sigma | Mean | Median | Sigma |
| A | 5 | 203 | 27142 | 168.86 | 781 | 767 | 156.2 |
| A | 13 | 254 | 11704 | 70.02 | 781 | 767 | 156.2 |
| A | 8 | 192 | 11506 | 68.76 | 781 | 767 | 156.2 |
| B | 6 | 159 | 1741489 | 11786.07 | 771 | 754 | 147.7 |
| B | 10 | 247 | 23525 | 154.18 | 771 | 754 | 147.7 |
| B | 12 | 111 | 18525 | 120.32 | 771 | 754 | 147.7 |
| C | 14 | 238 | 127957 | 729.81 | 742 | 748 | 174.3 |
| C | 2 | 114 | 14220 | 77.29 | 742 | 748 | 174.3 |
| C | 14 | 254 | 11231 | 60.14 | 742 | 748 | 174.3 |
| D | 7 | 80 | 641013 | 3671.54 | 737 | 722 | 174.4 |
| D | 8 | 195 | 179288 | 1023.93 | 737 | 722 | 174.4 |
| D | 7 | 223 | 119058 | 678.56 | 737 | 722 | 174.4 |
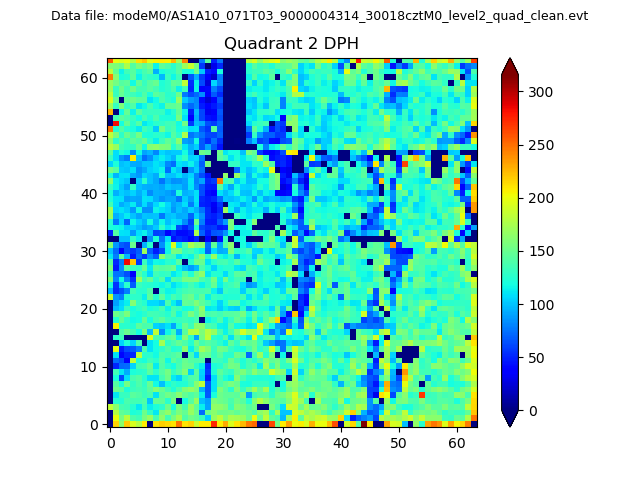
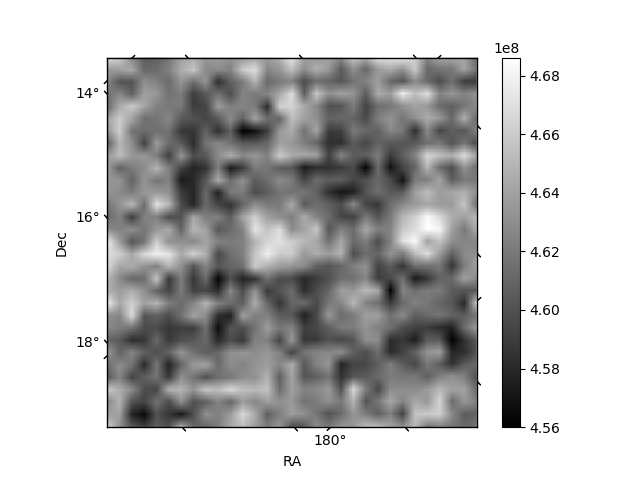
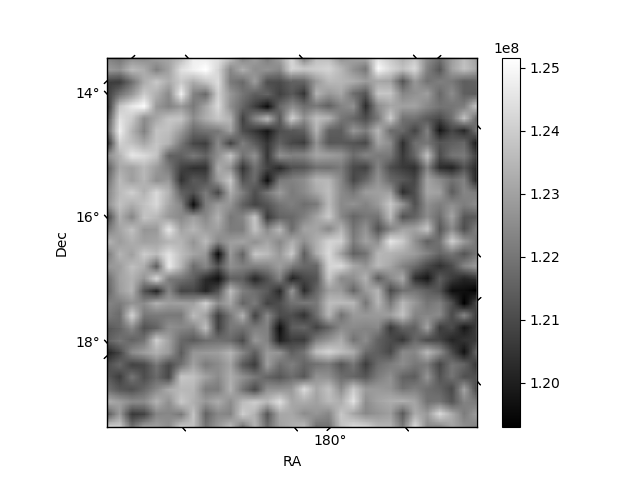
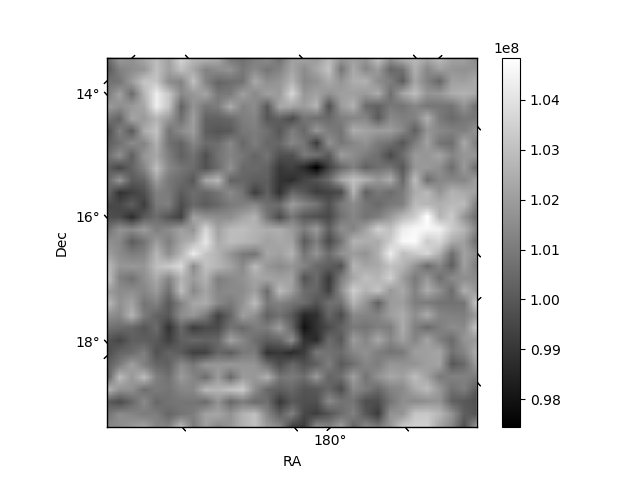
Histogram calculated using DETX and DETY for each event in the final _common_clean file
| Quadrant A | 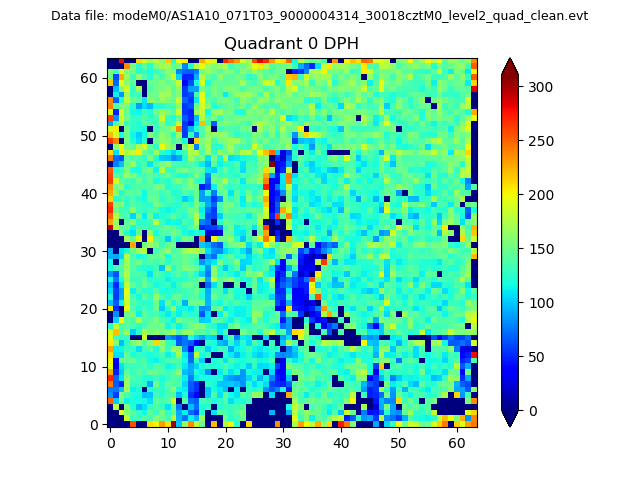 |
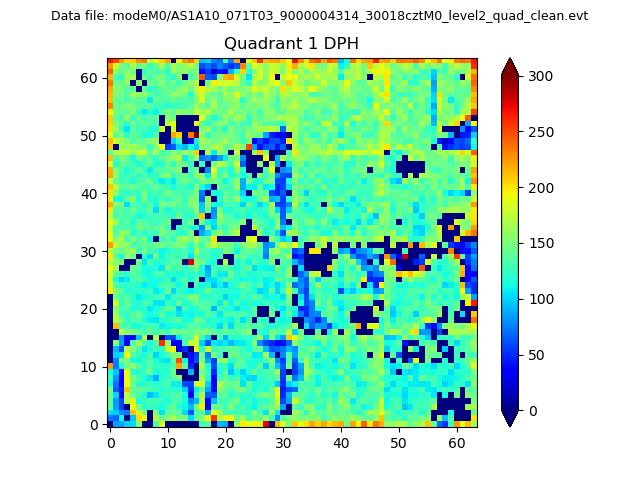 |
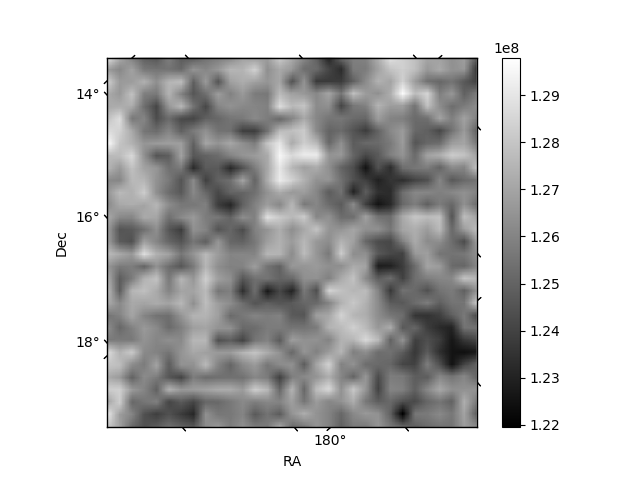
Quadrant B |
|---|---|---|---|
| Quadrant D | 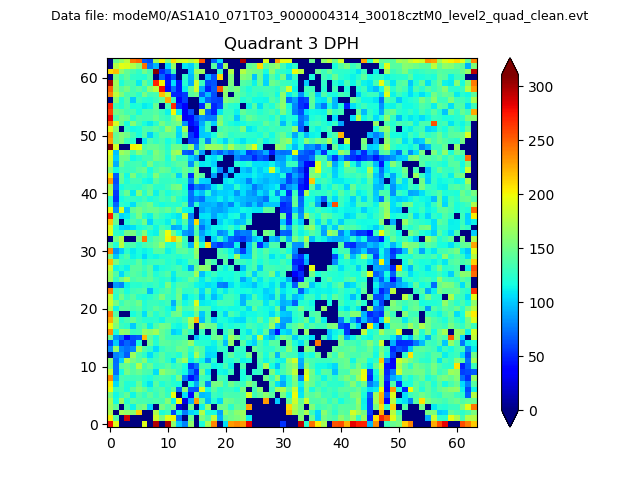 |
 |
Quadrant C |
| Plot type | Count rate plots | Images |
|---|---|---|
| Comparison with Poisson distribution Blue bars denote a histogram of data divided into 1 sec bins. Red curve is a Poisson curve with rate = median count rate of data. |
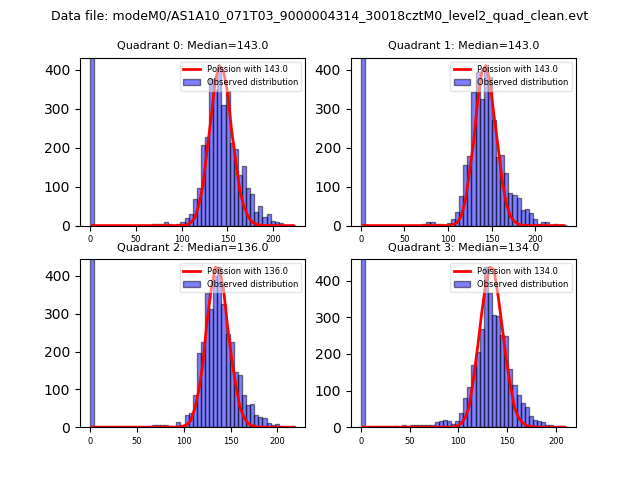 |
 |
| Quadrant-wise count rates Data is divided into 100 sec bins |
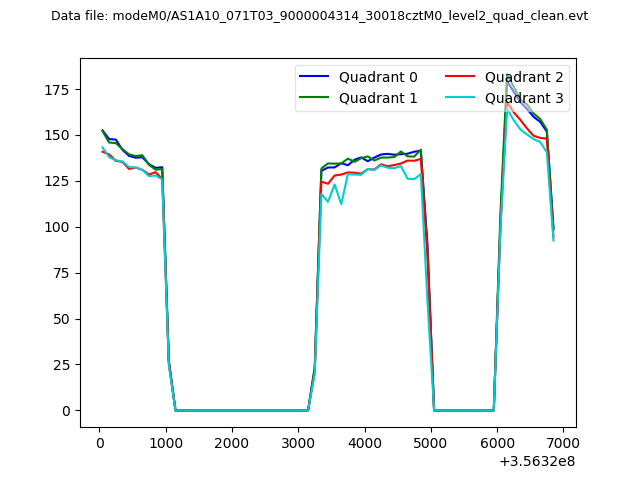 |
|
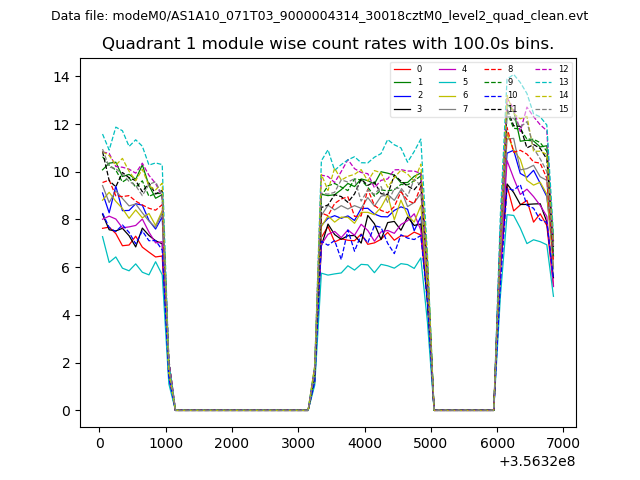
| Module-wise count rates for Quadrant A Data is divided into 100 sec bins |
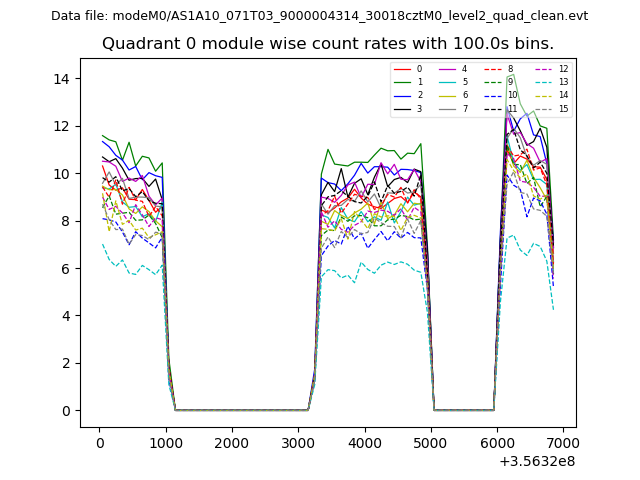 |
 |
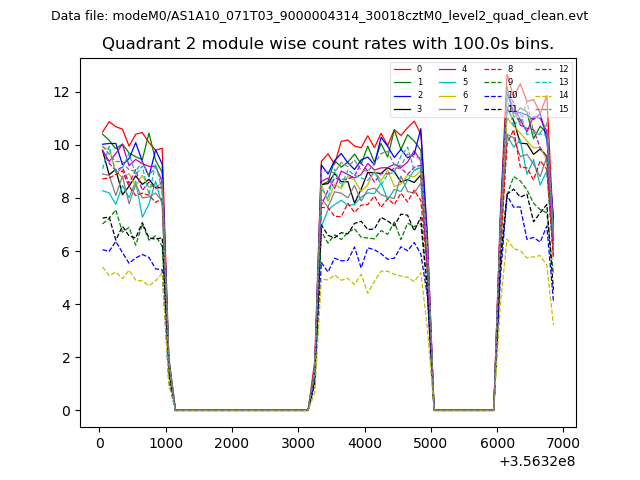
| Module-wise count rates for Quadrant B Data is divided into 100 sec bins |
 |
 |
| Module-wise count rates for Quadrant C Data is divided into 100 sec bins |
 |
 |
| Module-wise count rates for Quadrant D Data is divided into 100 sec bins |
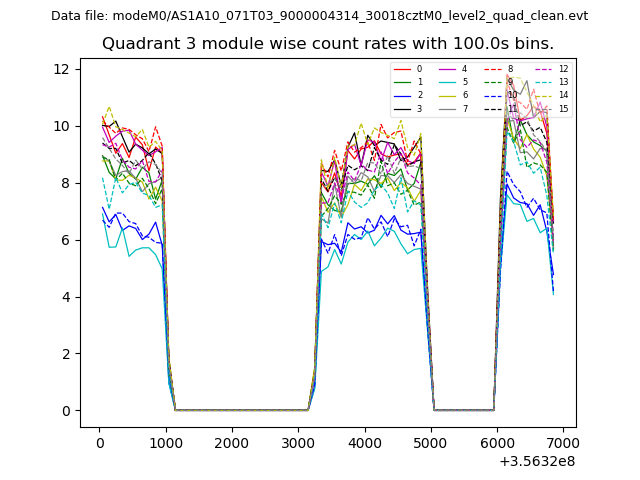 |
 |
| Parameter | Plot |
|---|---|
| CZT HV Monitor | 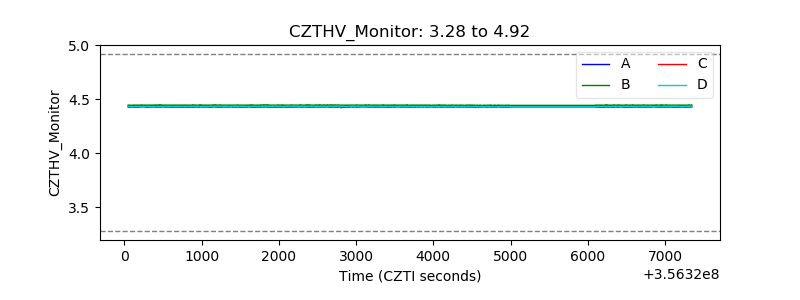 |
| D_VDD |  |
| Temperature 1 |  |
| Veto HV Monitor | 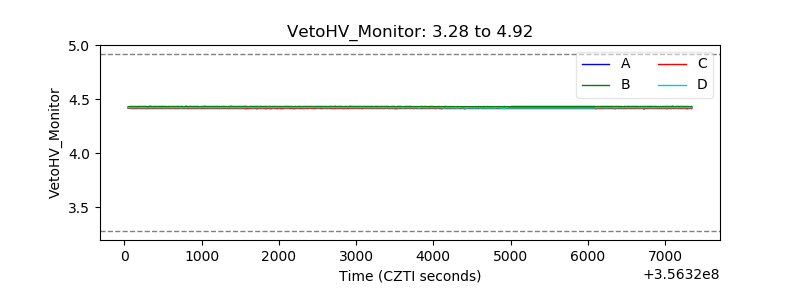 |
| Veto LLD |  |
| Alpha Counter | 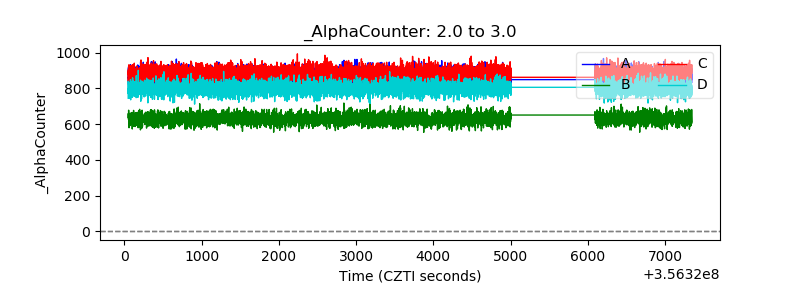 |
| _CPM_Rate | 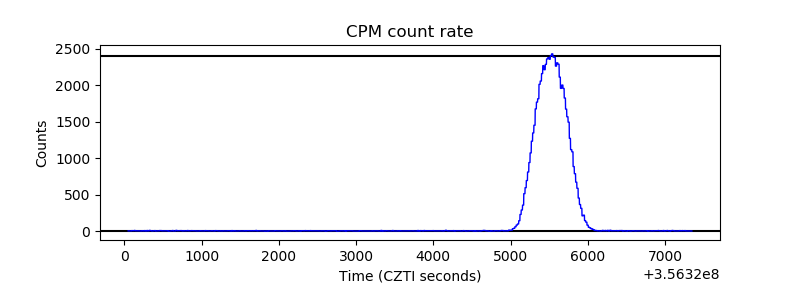 |
| CZT Counter | 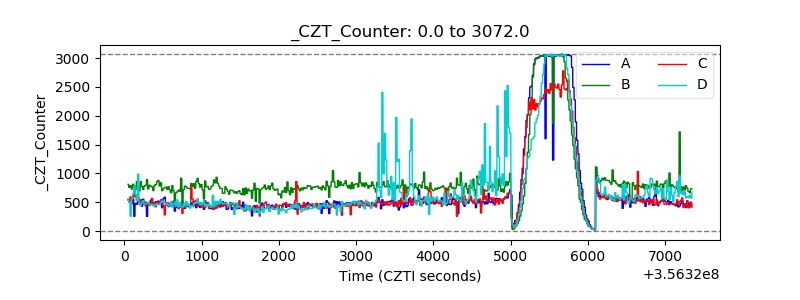 |
| +2.5 Volts monitor |  |
| +5 Volts monitor | 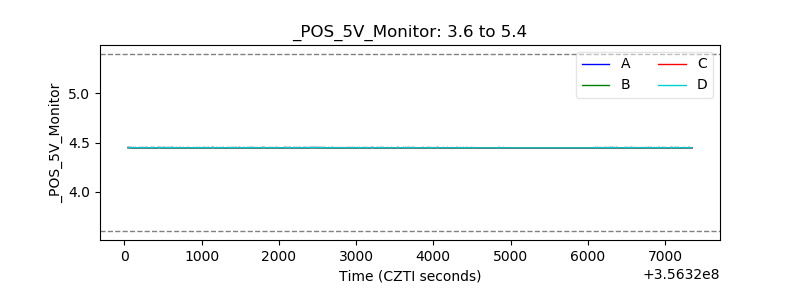 |
| _ROLL_ROT | 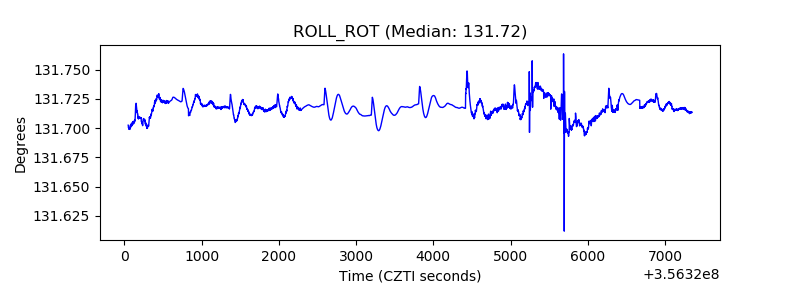 |
| _Roll_DEC | 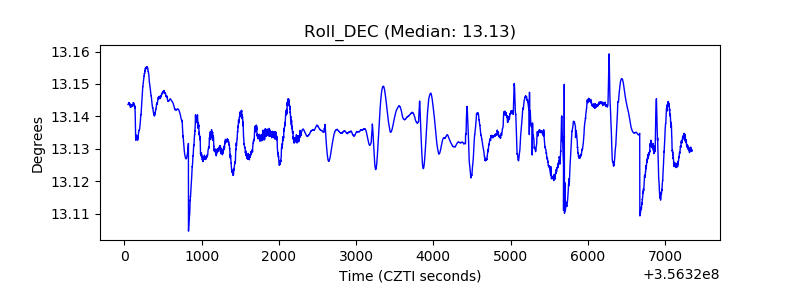 |
| _Roll_RA | 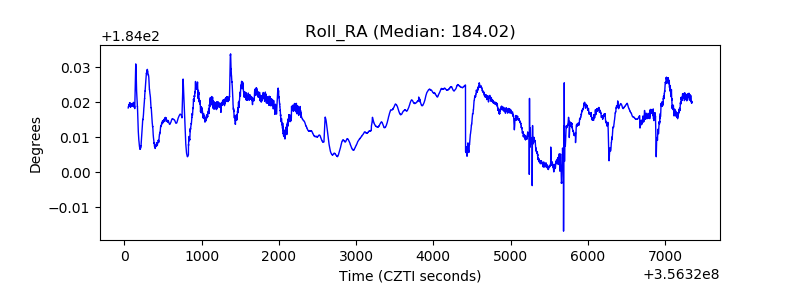 |
| Veto Counter | 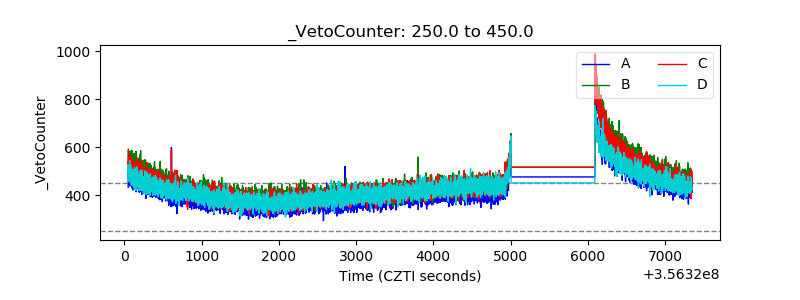 |