| Param | Original file | Final file |
|---|---|---|
| Filename | modeM0/AS1A10_071T03_9000004314_30019cztM0_level2.evt | modeM0/AS1A10_071T03_9000004314_30019cztM0_level2_quad_clean.evt |
| Size (bytes) | 525,640,320 | 78,131,520 |
| Size | 501.3 MB | 74.5 MB |
| Events in quadrant A | 3,260,473 | 495,533 |
| Events in quadrant B | 4,953,438 | 501,236 |
| Events in quadrant C | 3,239,992 | 471,879 |
| Events in quadrant D | 4,040,433 | 459,628 |
| Mode M9 | |||
|---|---|---|---|
| Quadrant | BADHDUFLAG | Total packets | Discarded packets |
| A | 0 | 19 | 0 |
| B | 0 | 20 | 0 |
| C | 0 | 20 | 0 |
| D | 0 | 20 | 0 |
| Mode M0 | |||
|---|---|---|---|
| Quadrant | BADHDUFLAG | Total packets | Discarded packets |
| A | 0 | 13324 | 2 |
| B | 0 | 19093 | 3 |
| C | 0 | 13301 | 2 |
| D | 0 | 16001 | 2 |
| Mode SS | |||
|---|---|---|---|
| Quadrant | BADHDUFLAG | Total packets | Discarded packets |
| A | 0 | 128 | 0 |
| B | 0 | 128 | 0 |
| C | 0 | 128 | 0 |
| D | 0 | 128 | 0 |
| Quadrant | Total seconds | Saturated seconds | Saturation percentage |
|---|---|---|---|
| A | 6269 | 37 | 0.590206% |
| B | 6268 | 84 | 1.340140% |
| C | 6268 | 68 | 1.084876% |
| D | 6268 | 135 | 2.153797% |
Noise dominated data is calculated using 1-second bins in cleaned event files. If a bin has >2000 counts, and if more than 50% of those come from <1% of pixels, then it is considered to be noise-dominated and hence unusable.
| Quadrant | # 1 sec bins | Bins with >0 counts | Bins with >2000 counts | High rate bins dominated by noise | Noise dominated (total time) | Noise dominated (detector-on time) | Marked lightcurve |
|---|---|---|---|---|---|---|---|
| A | 7449 | 6270 | 3 | 3 | 0.04% | 0.05% | 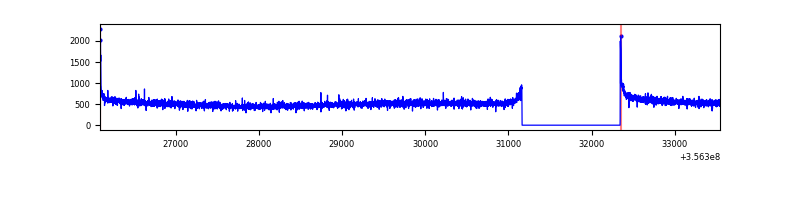 |
| B | 7448 | 6269 | 1 | 1 | 0.01% | 0.02% | 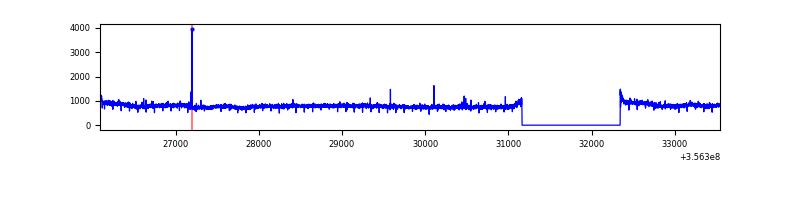 |
| C | 7448 | 6269 | 0 | 0 | 0.00% | 0.00% | 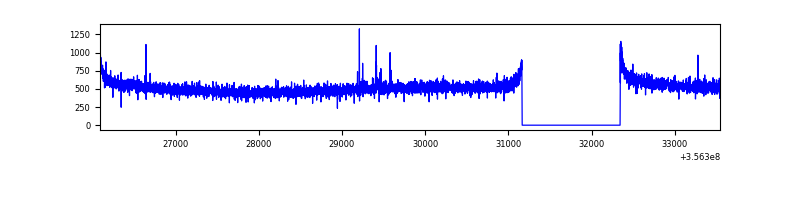 |
| D | 7448 | 6269 | 102 | 102 | 1.37% | 1.63% | 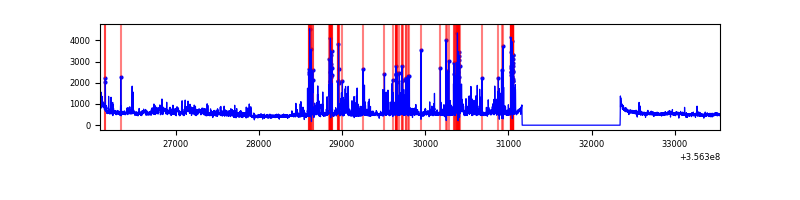 |
Top three noisy pixels from each quadrant. If the there are fewer than three noisy pixels in the level2.evt file, extra rows are filled as -1
| Pixel properties | Quadrant properties | ||||||
|---|---|---|---|---|---|---|---|
| Quadrant | DetID | PixID | Counts | Sigma | Mean | Median | Sigma |
| A | 8 | 192 | 21752 | 126.12 | 835 | 821 | 166.0 |
| A | 5 | 203 | 16908 | 96.93 | 835 | 821 | 166.0 |
| A | 13 | 254 | 11696 | 65.53 | 835 | 821 | 166.0 |
| B | 6 | 159 | 1681060 | 10692.48 | 826 | 807 | 157.1 |
| B | 12 | 111 | 19554 | 119.3 | 826 | 807 | 157.1 |
| B | 10 | 247 | 18270 | 111.13 | 826 | 807 | 157.1 |
| C | 14 | 238 | 134241 | 724.24 | 789 | 795 | 184.3 |
| C | 2 | 114 | 14548 | 74.64 | 789 | 795 | 184.3 |
| C | 14 | 254 | 8782 | 43.35 | 789 | 795 | 184.3 |
| D | 7 | 80 | 807575 | 4353.96 | 782 | 765 | 185.3 |
| D | 8 | 195 | 136939 | 734.86 | 782 | 765 | 185.3 |
| D | 7 | 223 | 120585 | 646.61 | 782 | 765 | 185.3 |
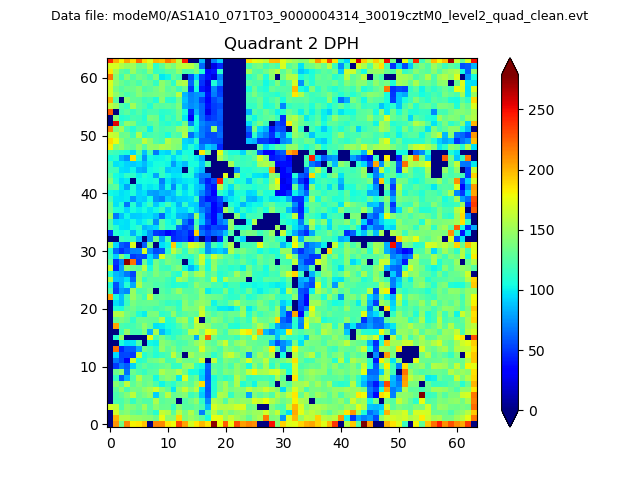
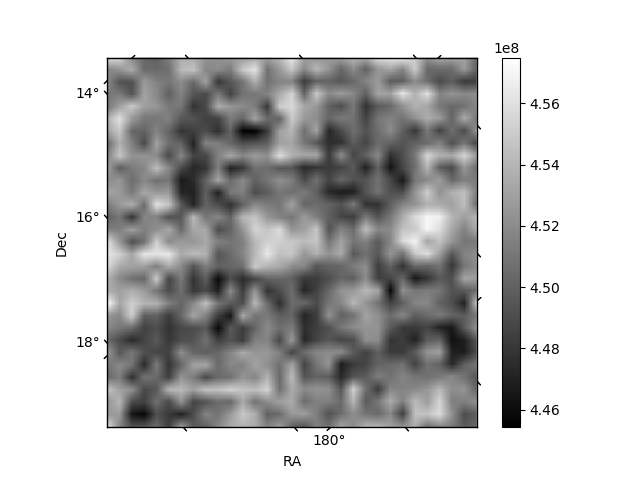
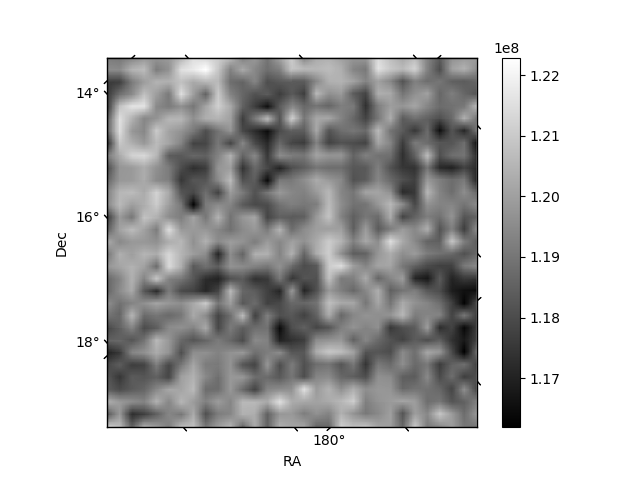
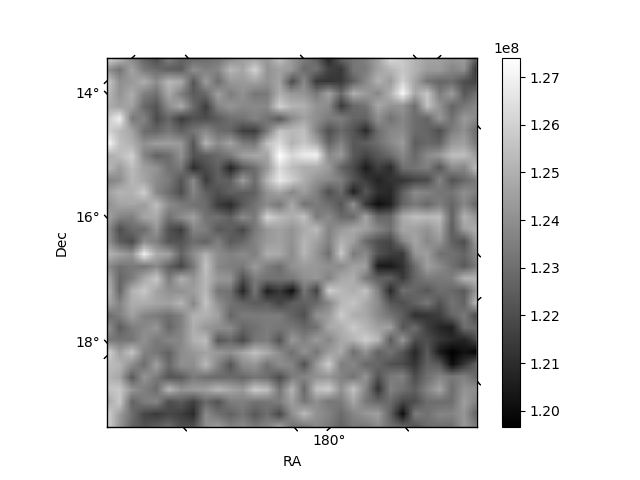
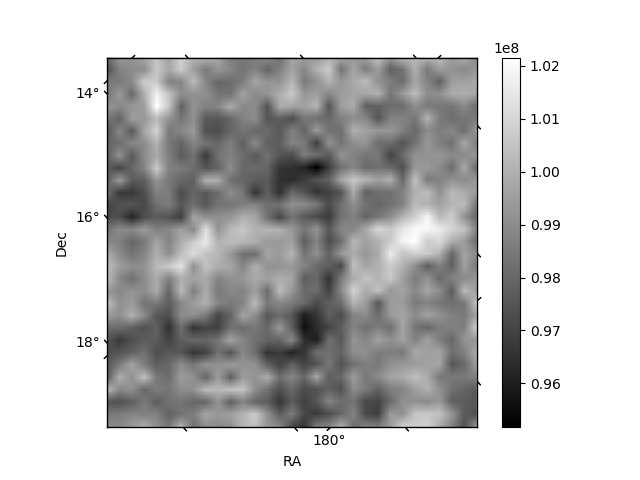
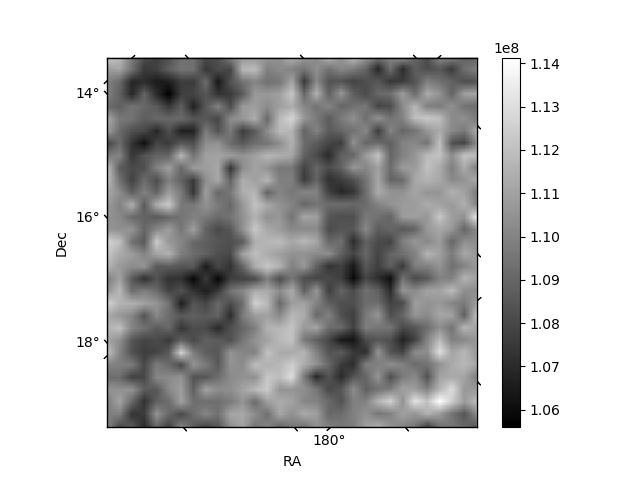
Histogram calculated using DETX and DETY for each event in the final _common_clean file
| Quadrant A | 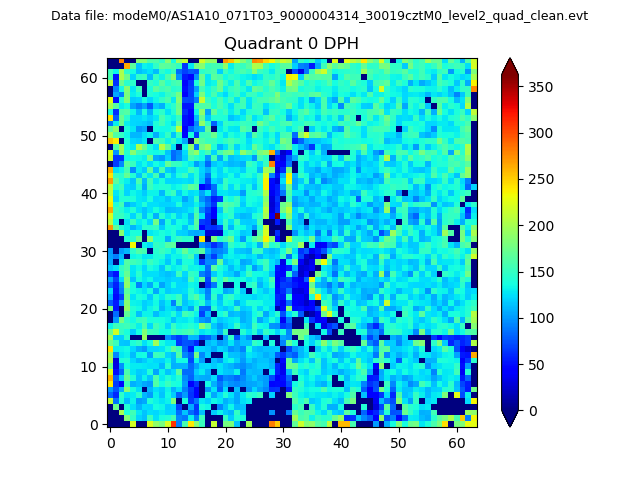 |
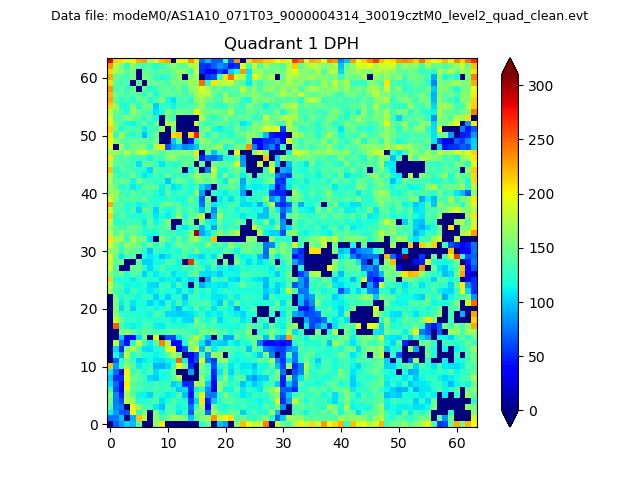 |
Quadrant B |
|---|---|---|---|
| Quadrant D | 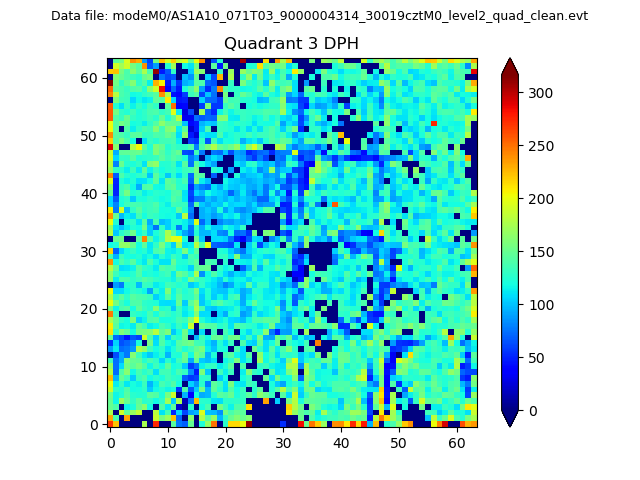 |
 |
Quadrant C |
| Plot type | Count rate plots | Images |
|---|---|---|
| Comparison with Poisson distribution Blue bars denote a histogram of data divided into 1 sec bins. Red curve is a Poisson curve with rate = median count rate of data. |
 |
 |
| Quadrant-wise count rates Data is divided into 100 sec bins |
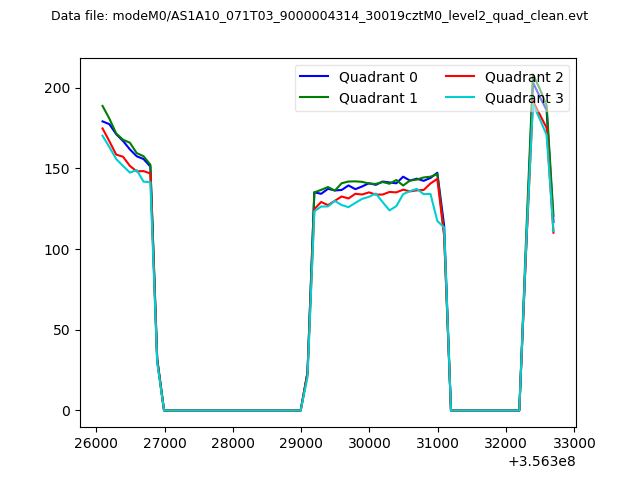 |
|
| Module-wise count rates for Quadrant A Data is divided into 100 sec bins |
 |
 |
| Module-wise count rates for Quadrant B Data is divided into 100 sec bins |
 |
 |
| Module-wise count rates for Quadrant C Data is divided into 100 sec bins |
 |
 |
| Module-wise count rates for Quadrant D Data is divided into 100 sec bins |
 |
 |
| Parameter | Plot |
|---|---|
| CZT HV Monitor | 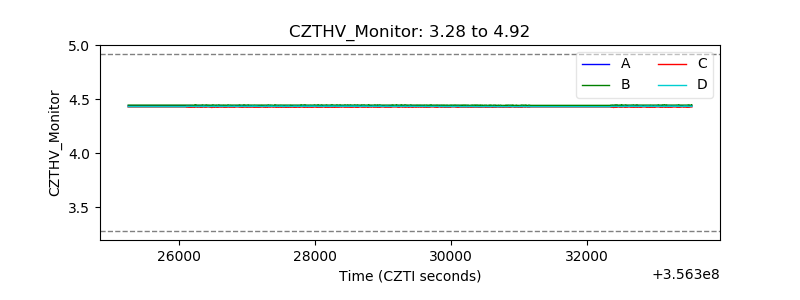 |
| D_VDD | 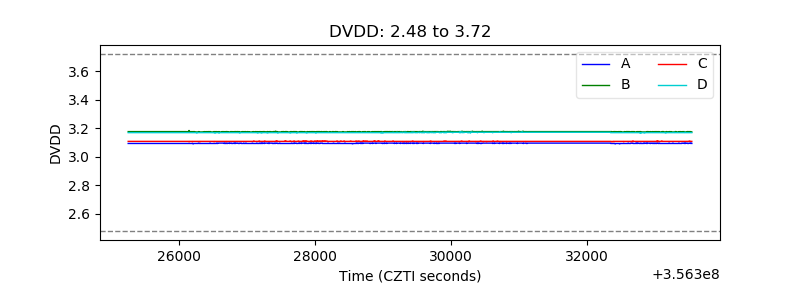 |
| Temperature 1 | 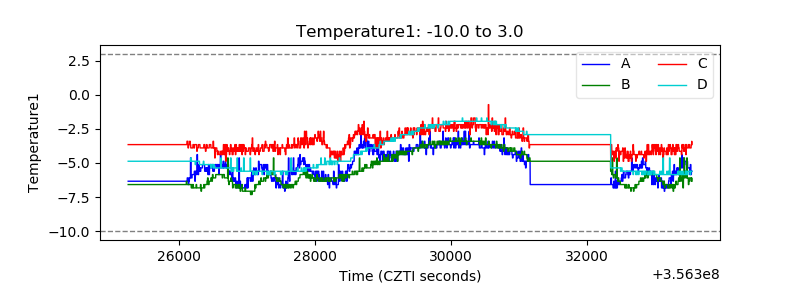 |
| Veto HV Monitor | 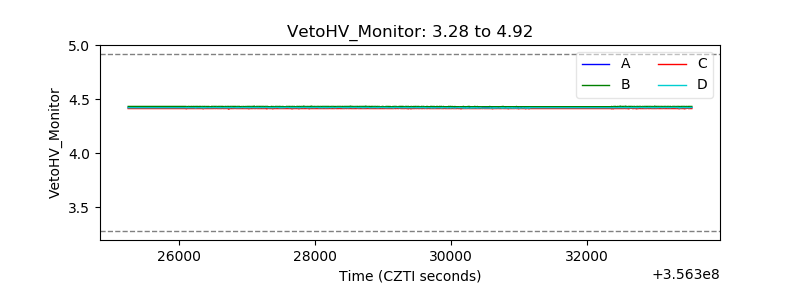 |
| Veto LLD | 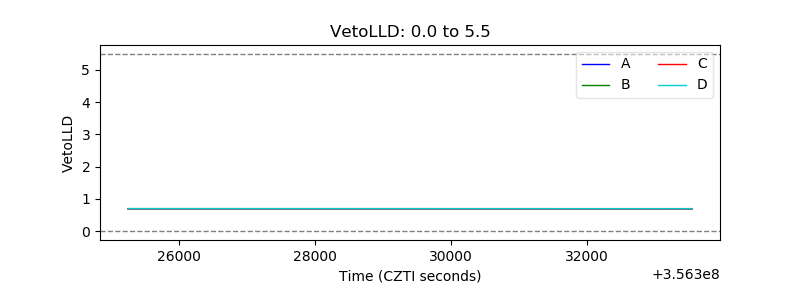 |
| Alpha Counter | 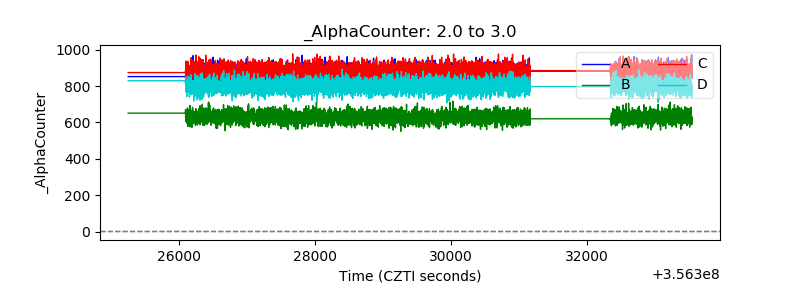 |
| _CPM_Rate | 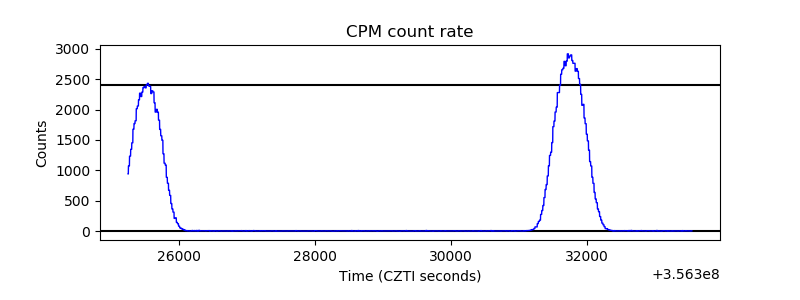 |
| CZT Counter | 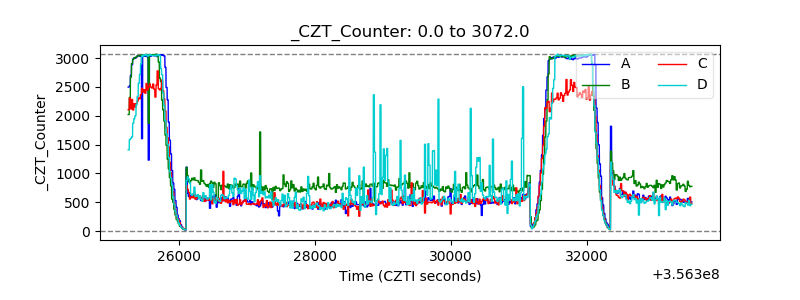 |
| +2.5 Volts monitor | 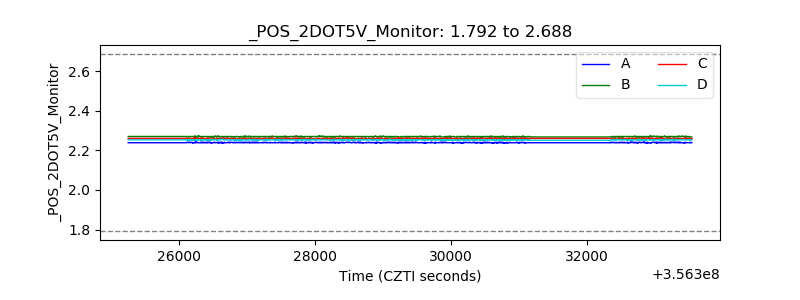 |
| +5 Volts monitor |  |
| _ROLL_ROT |  |
| _Roll_DEC |  |
| _Roll_RA | 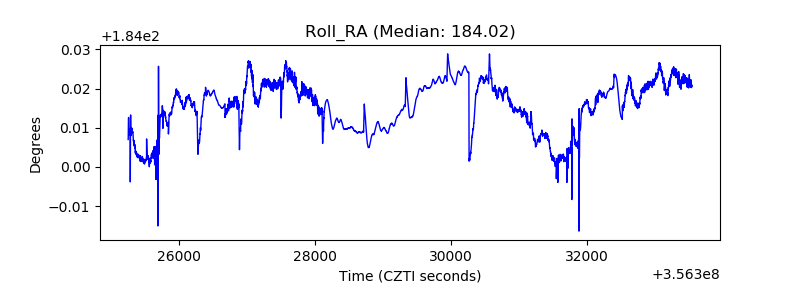 |
| Veto Counter |  |