| Param | Original file | Final file |
|---|---|---|
| Filename | modeM0/AS1A10_071T03_9000004314_30023cztM0_level2.evt | modeM0/AS1A10_071T03_9000004314_30023cztM0_level2_quad_clean.evt |
| Size (bytes) | 559,584,000 | 93,113,280 |
| Size | 533.7 MB | 88.8 MB |
| Events in quadrant A | 3,668,089 | 605,129 |
| Events in quadrant B | 5,457,061 | 599,394 |
| Events in quadrant C | 3,636,003 | 569,675 |
| Events in quadrant D | 3,722,324 | 568,903 |
| Mode M9 | |||
|---|---|---|---|
| Quadrant | BADHDUFLAG | Total packets | Discarded packets |
| A | 0 | 18 | 0 |
| B | 0 | 19 | 0 |
| C | 0 | 19 | 0 |
| D | 0 | 19 | 0 |
| Mode M0 | |||
|---|---|---|---|
| Quadrant | BADHDUFLAG | Total packets | Discarded packets |
| A | 0 | 14720 | 2 |
| B | 0 | 20899 | 2 |
| C | 0 | 14634 | 2 |
| D | 0 | 15028 | 2 |
| Mode SS | |||
|---|---|---|---|
| Quadrant | BADHDUFLAG | Total packets | Discarded packets |
| A | 0 | 140 | 0 |
| B | 0 | 140 | 0 |
| C | 0 | 140 | 0 |
| D | 0 | 140 | 0 |
| Quadrant | Total seconds | Saturated seconds | Saturation percentage |
|---|---|---|---|
| A | 6837 | 163 | 2.384087% |
| B | 6837 | 256 | 3.744332% |
| C | 6837 | 216 | 3.159280% |
| D | 6837 | 144 | 2.106187% |
Noise dominated data is calculated using 1-second bins in cleaned event files. If a bin has >2000 counts, and if more than 50% of those come from <1% of pixels, then it is considered to be noise-dominated and hence unusable.
| Quadrant | # 1 sec bins | Bins with >0 counts | Bins with >2000 counts | High rate bins dominated by noise | Noise dominated (total time) | Noise dominated (detector-on time) | Marked lightcurve |
|---|---|---|---|---|---|---|---|
| A | 7887 | 6838 | 0 | 0 | 0.00% | 0.00% | 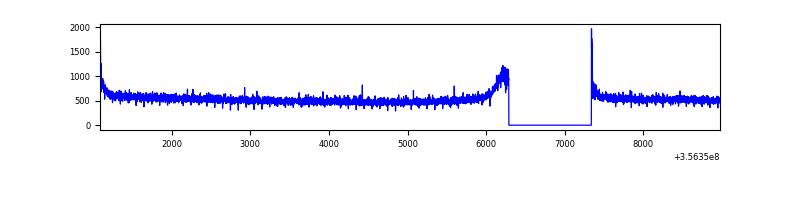 |
| B | 7887 | 6837 | 0 | 0 | 0.00% | 0.00% | 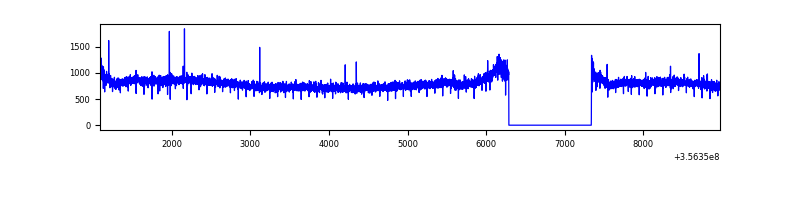 |
| C | 7887 | 6837 | 2 | 2 | 0.03% | 0.03% | 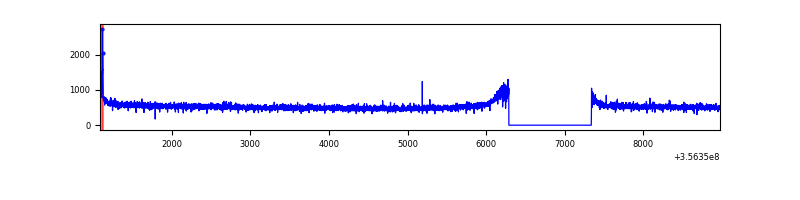 |
| D | 7887 | 6838 | 33 | 33 | 0.42% | 0.48% | 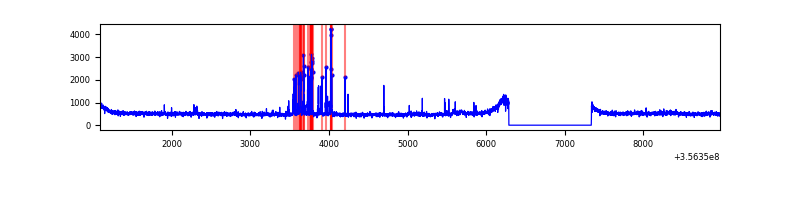 |
Top three noisy pixels from each quadrant. If the there are fewer than three noisy pixels in the level2.evt file, extra rows are filled as -1
| Pixel properties | Quadrant properties | ||||||
|---|---|---|---|---|---|---|---|
| Quadrant | DetID | PixID | Counts | Sigma | Mean | Median | Sigma |
| A | 5 | 203 | 23658 | 120.95 | 940 | 925 | 188.0 |
| A | 8 | 192 | 20957 | 106.58 | 940 | 925 | 188.0 |
| A | 13 | 254 | 11434 | 55.91 | 940 | 925 | 188.0 |
| B | 6 | 159 | 1853561 | 10581.13 | 914 | 894 | 175.1 |
| B | 12 | 111 | 21904 | 119.99 | 914 | 894 | 175.1 |
| B | 11 | 111 | 20106 | 109.73 | 914 | 894 | 175.1 |
| C | 14 | 238 | 145065 | 697.18 | 884 | 892 | 206.8 |
| C | 0 | 10 | 16899 | 77.41 | 884 | 892 | 206.8 |
| C | 2 | 114 | 16092 | 73.5 | 884 | 892 | 206.8 |
| D | 7 | 80 | 184934 | 865.11 | 901 | 880 | 212.8 |
| D | 8 | 195 | 94913 | 441.99 | 901 | 880 | 212.8 |
| D | 2 | 234 | 25517 | 115.8 | 901 | 880 | 212.8 |
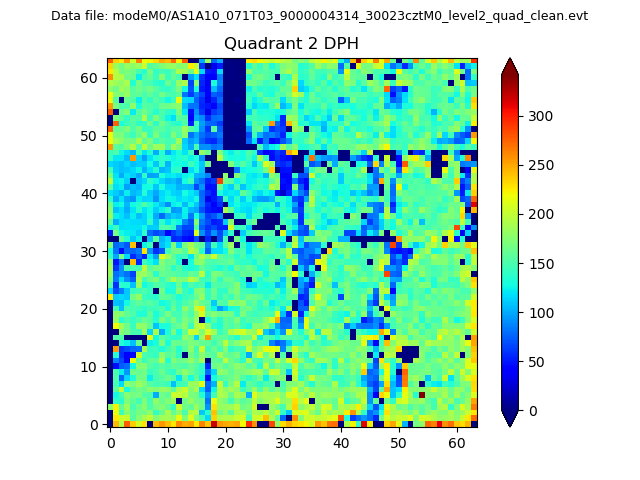
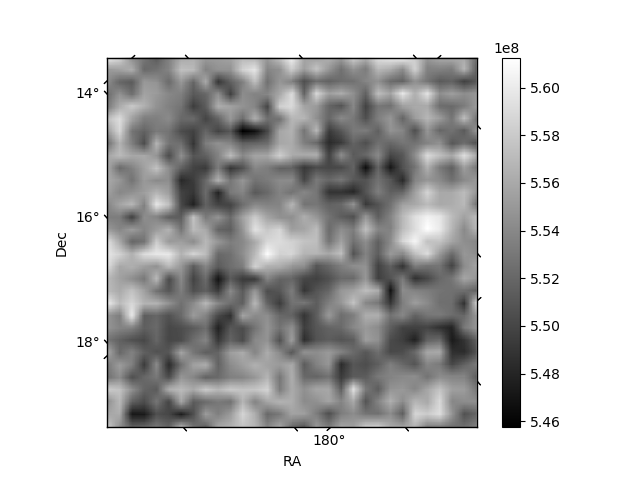
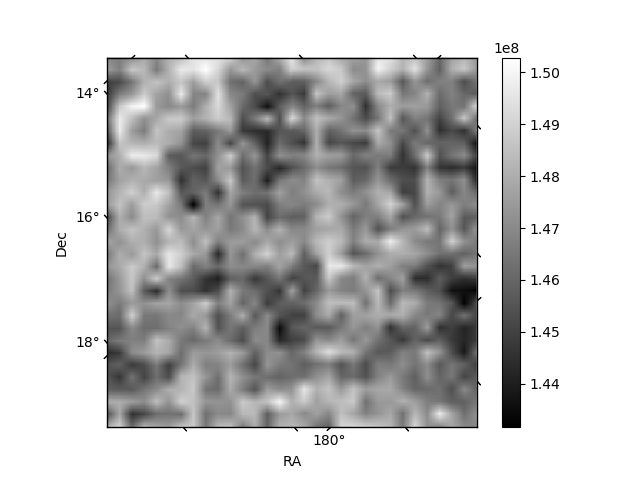
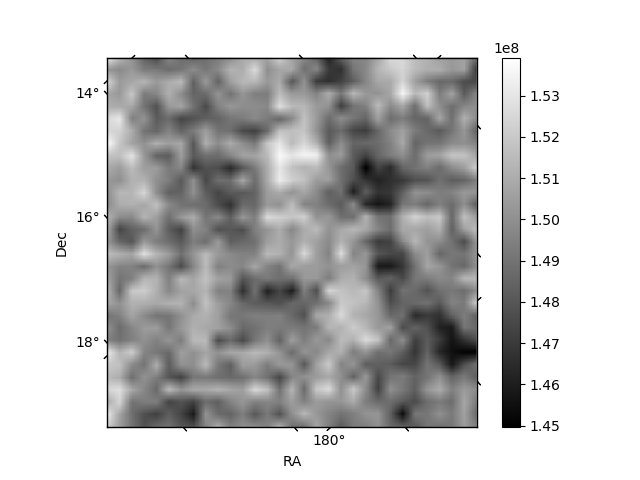
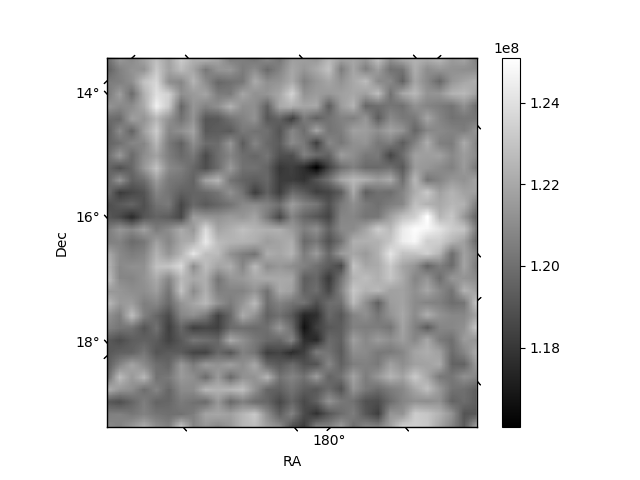
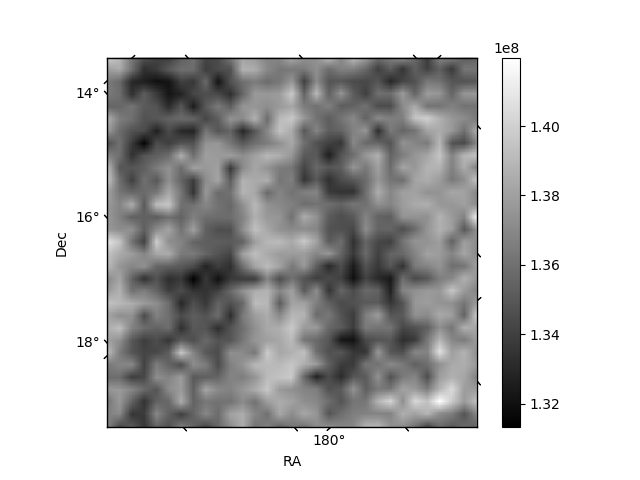
Histogram calculated using DETX and DETY for each event in the final _common_clean file
| Quadrant A | 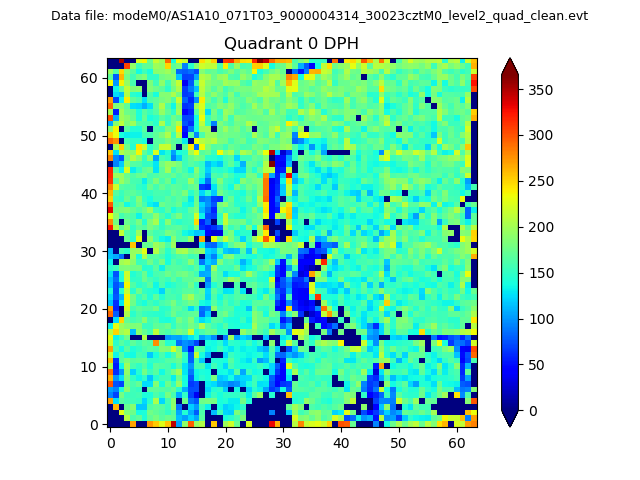 |
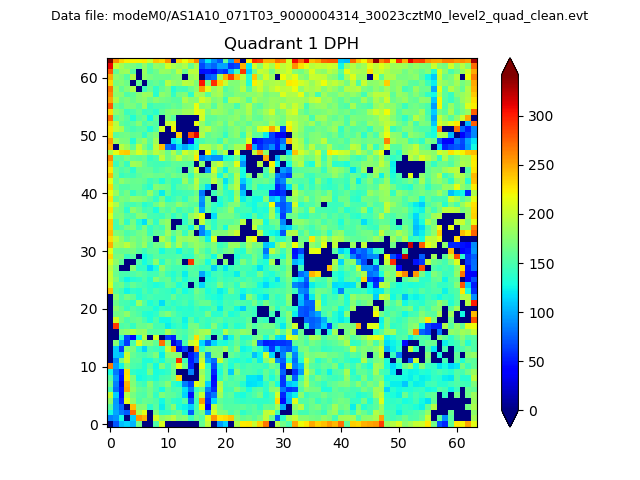 |
Quadrant B |
|---|---|---|---|
| Quadrant D | 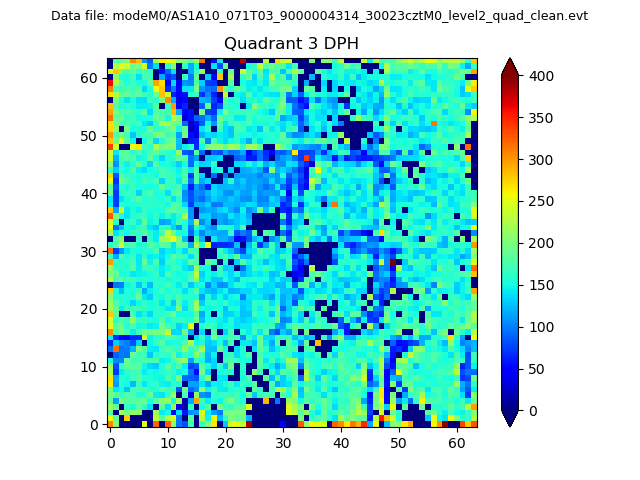 |
 |
Quadrant C |
| Plot type | Count rate plots | Images |
|---|---|---|
| Comparison with Poisson distribution Blue bars denote a histogram of data divided into 1 sec bins. Red curve is a Poisson curve with rate = median count rate of data. |
 |
 |
| Quadrant-wise count rates Data is divided into 100 sec bins |
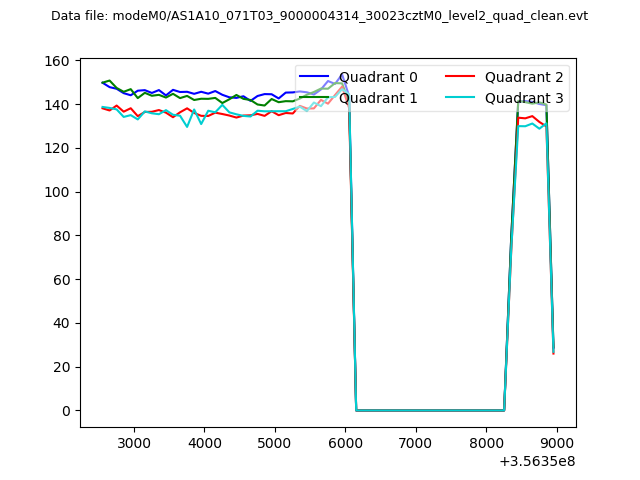 |
|
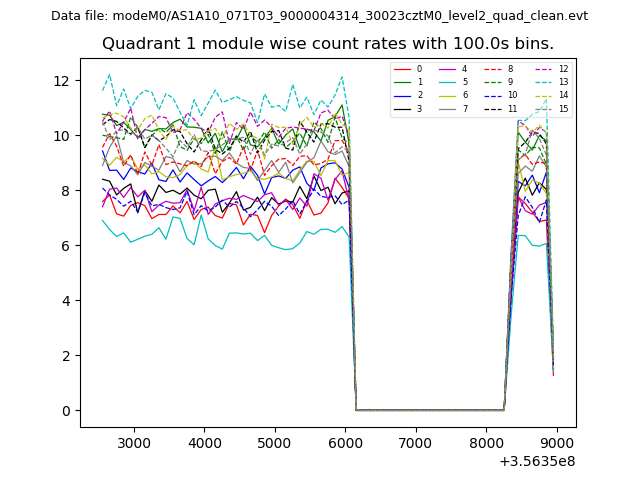
| Module-wise count rates for Quadrant A Data is divided into 100 sec bins |
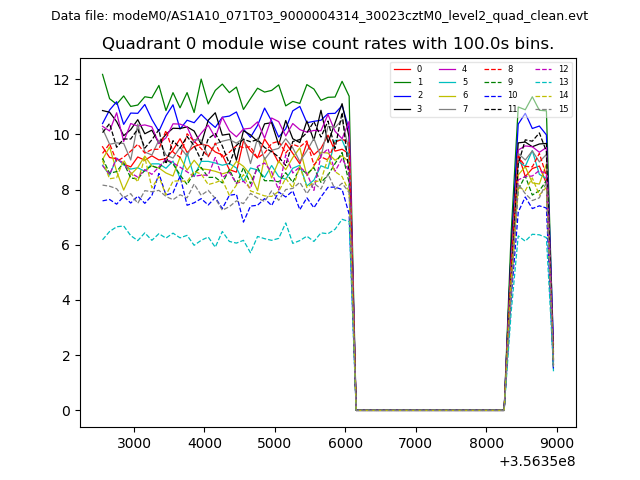 |
 |
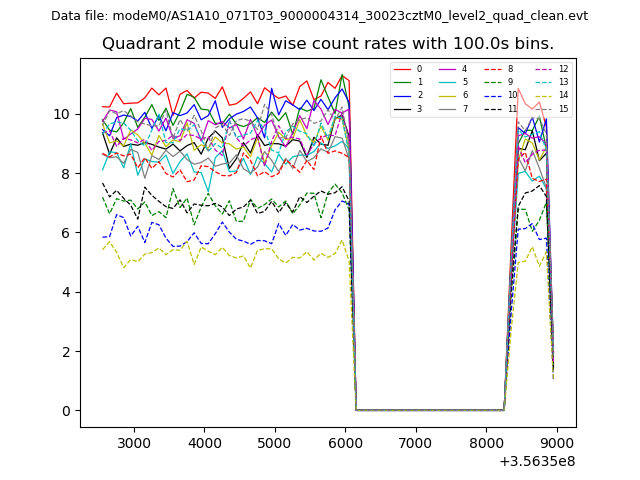
| Module-wise count rates for Quadrant B Data is divided into 100 sec bins |
 |
 |
| Module-wise count rates for Quadrant C Data is divided into 100 sec bins |
 |
 |
| Module-wise count rates for Quadrant D Data is divided into 100 sec bins |
 |
 |
| Parameter | Plot |
|---|---|
| CZT HV Monitor | 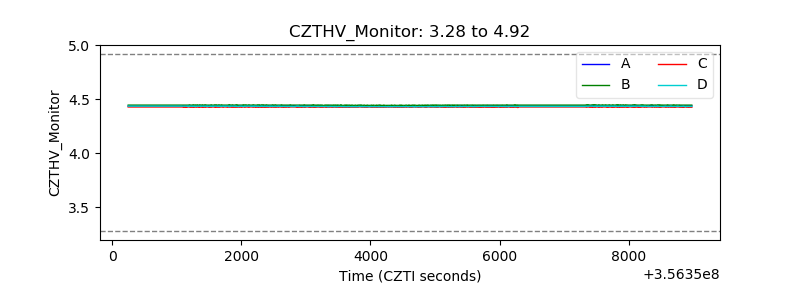 |
| D_VDD | 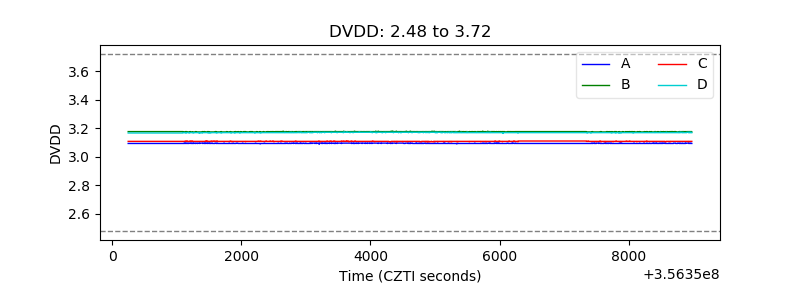 |
| Temperature 1 | 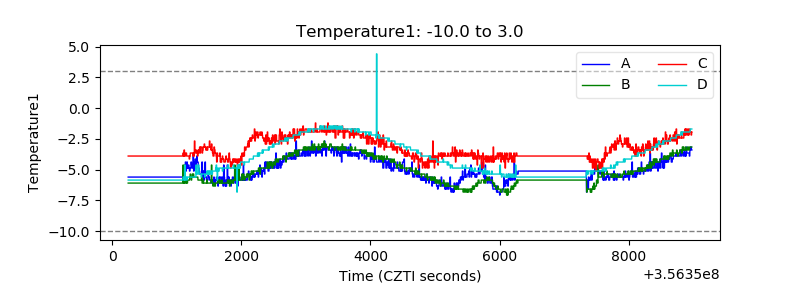 |
| Veto HV Monitor | 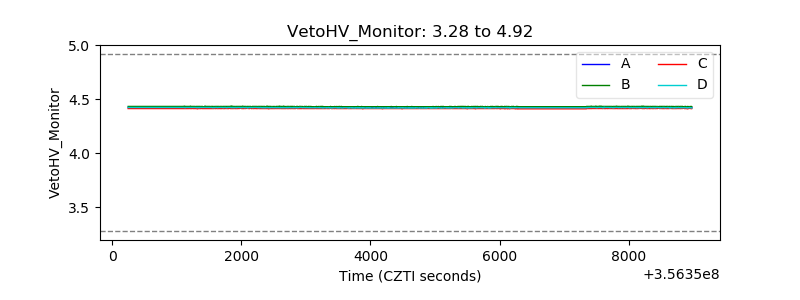 |
| Veto LLD | 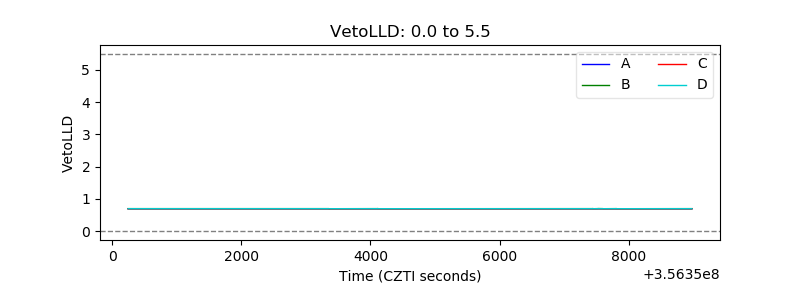 |
| Alpha Counter | 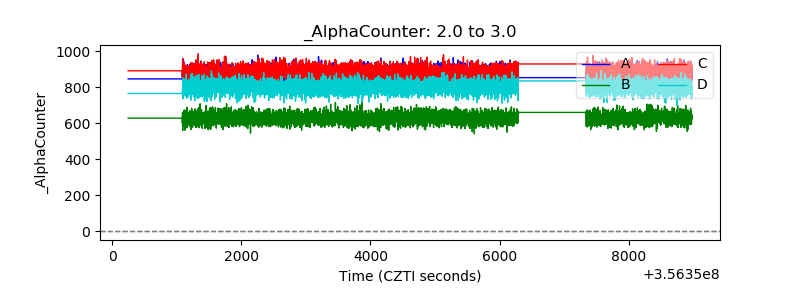 |
| _CPM_Rate | 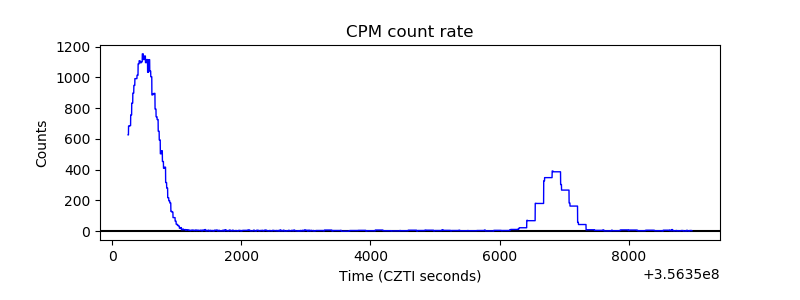 |
| CZT Counter | 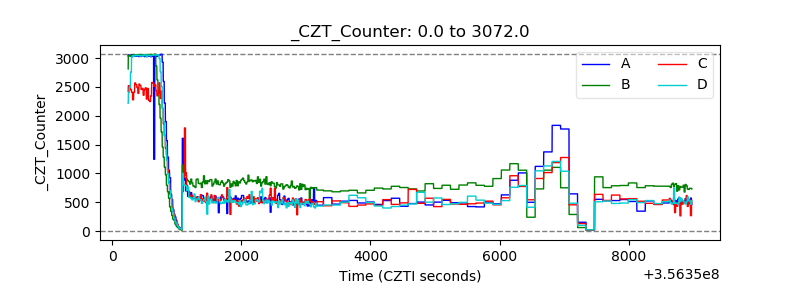 |
| +2.5 Volts monitor |  |
| +5 Volts monitor |  |
| _ROLL_ROT |  |
| _Roll_DEC |  |
| _Roll_RA | 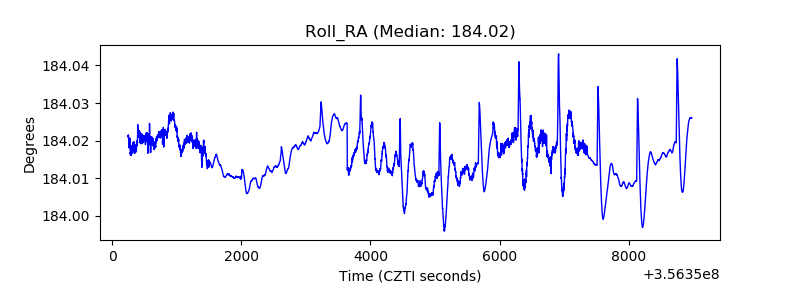 |
| Veto Counter | 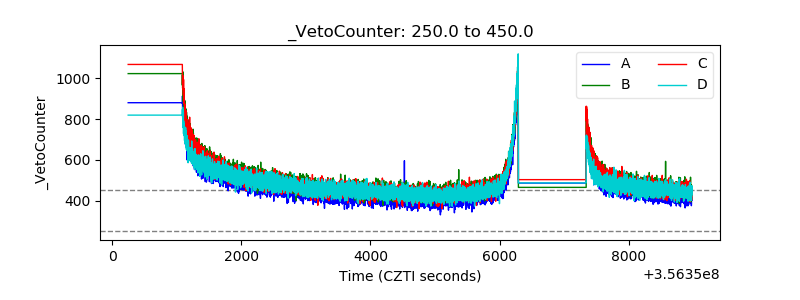 |