| Param | Original file | Final file |
|---|---|---|
| Filename | modeM0/AS1A10_071T03_9000004314_30024cztM0_level2.evt | modeM0/AS1A10_071T03_9000004314_30024cztM0_level2_quad_clean.evt |
| Size (bytes) | 530,354,880 | 94,057,920 |
| Size | 505.8 MB | 89.7 MB |
| Events in quadrant A | 3,467,577 | 610,314 |
| Events in quadrant B | 5,193,531 | 607,820 |
| Events in quadrant C | 3,418,517 | 580,740 |
| Events in quadrant D | 3,522,022 | 576,709 |
| Mode M9 | |||
|---|---|---|---|
| Quadrant | BADHDUFLAG | Total packets | Discarded packets |
| A | 0 | 7 | 0 |
| B | 0 | 7 | 0 |
| C | 0 | 7 | 0 |
| D | 0 | 7 | 0 |
| Mode M0 | |||
|---|---|---|---|
| Quadrant | BADHDUFLAG | Total packets | Discarded packets |
| A | 0 | 14240 | 1 |
| B | 0 | 20470 | 1 |
| C | 0 | 14094 | 1 |
| D | 0 | 14376 | 1 |
| Mode SS | |||
|---|---|---|---|
| Quadrant | BADHDUFLAG | Total packets | Discarded packets |
| A | 0 | 136 | 0 |
| B | 0 | 136 | 0 |
| C | 0 | 136 | 0 |
| D | 0 | 136 | 0 |
| Quadrant | Total seconds | Saturated seconds | Saturation percentage |
|---|---|---|---|
| A | 6789 | 157 | 2.312564% |
| B | 6789 | 218 | 3.211077% |
| C | 6789 | 202 | 2.975401% |
| D | 6790 | 120 | 1.767305% |
Noise dominated data is calculated using 1-second bins in cleaned event files. If a bin has >2000 counts, and if more than 50% of those come from <1% of pixels, then it is considered to be noise-dominated and hence unusable.
| Quadrant | # 1 sec bins | Bins with >0 counts | Bins with >2000 counts | High rate bins dominated by noise | Noise dominated (total time) | Noise dominated (detector-on time) | Marked lightcurve |
|---|---|---|---|---|---|---|---|
| A | 7459 | 6790 | 4 | 4 | 0.05% | 0.06% |  |
| B | 7459 | 6790 | 0 | 0 | 0.00% | 0.00% | 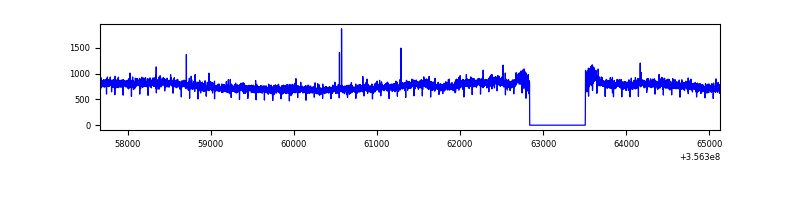 |
| C | 7459 | 6790 | 0 | 0 | 0.00% | 0.00% | 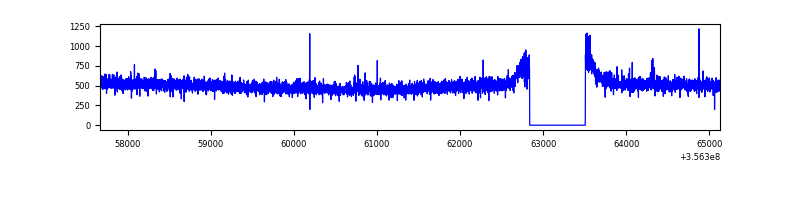 |
| D | 7460 | 6791 | 6 | 6 | 0.08% | 0.09% | 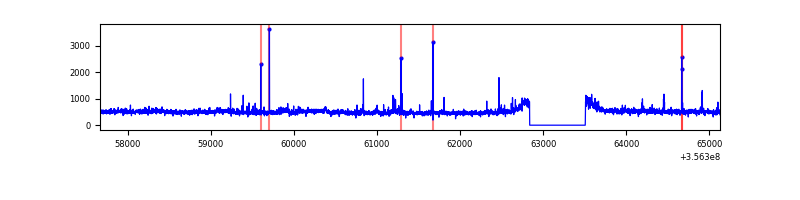 |
Top three noisy pixels from each quadrant. If the there are fewer than three noisy pixels in the level2.evt file, extra rows are filled as -1
| Pixel properties | Quadrant properties | ||||||
|---|---|---|---|---|---|---|---|
| Quadrant | DetID | PixID | Counts | Sigma | Mean | Median | Sigma |
| A | 12 | 96 | 51569 | 287.06 | 876 | 857 | 176.7 |
| A | 5 | 203 | 21843 | 118.79 | 876 | 857 | 176.7 |
| A | 13 | 254 | 12090 | 63.58 | 876 | 857 | 176.7 |
| B | 6 | 159 | 1825102 | 11002.13 | 855 | 833 | 165.8 |
| B | 12 | 111 | 20813 | 120.5 | 855 | 833 | 165.8 |
| B | 11 | 111 | 19417 | 112.08 | 855 | 833 | 165.8 |
| C | 14 | 238 | 135653 | 691.74 | 830 | 834 | 194.9 |
| C | 3 | 233 | 30315 | 151.26 | 830 | 834 | 194.9 |
| C | 2 | 114 | 15428 | 74.88 | 830 | 834 | 194.9 |
| D | 8 | 195 | 192198 | 959.74 | 844 | 825 | 199.4 |
| D | 7 | 80 | 58471 | 289.1 | 844 | 825 | 199.4 |
| D | 7 | 238 | 37217 | 182.51 | 844 | 825 | 199.4 |
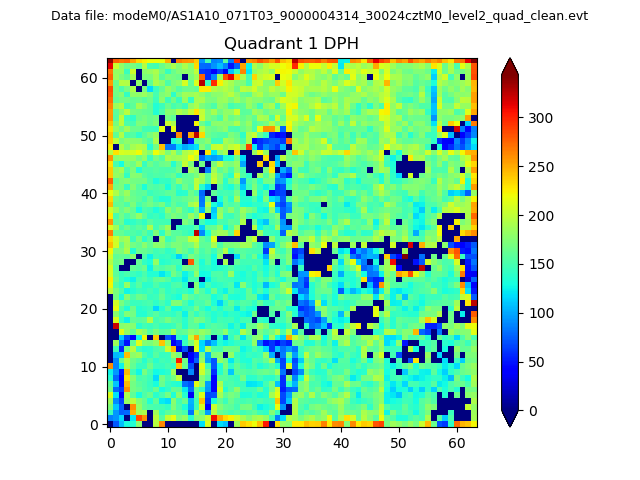
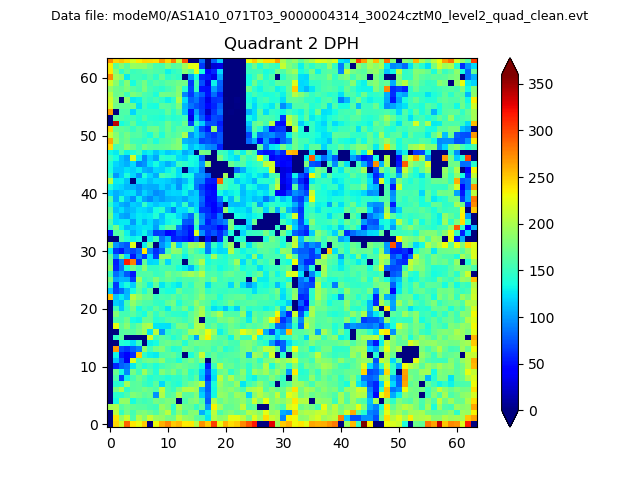
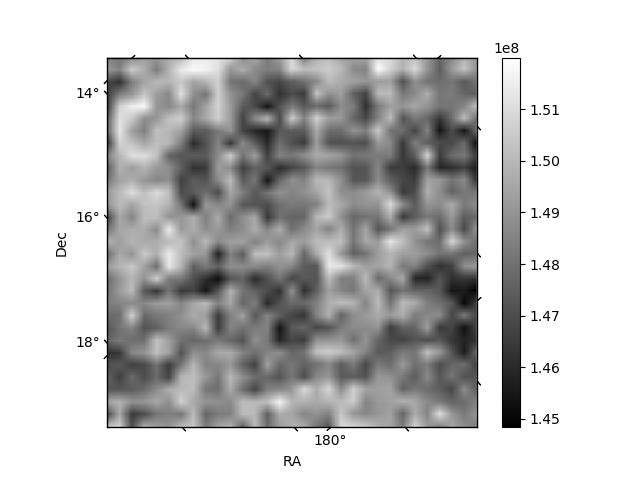
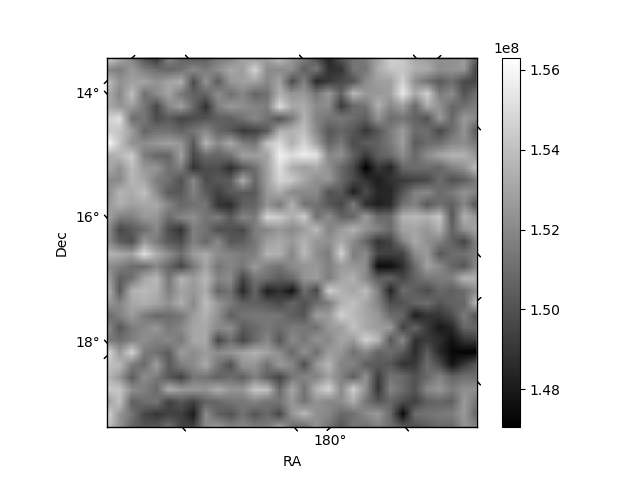
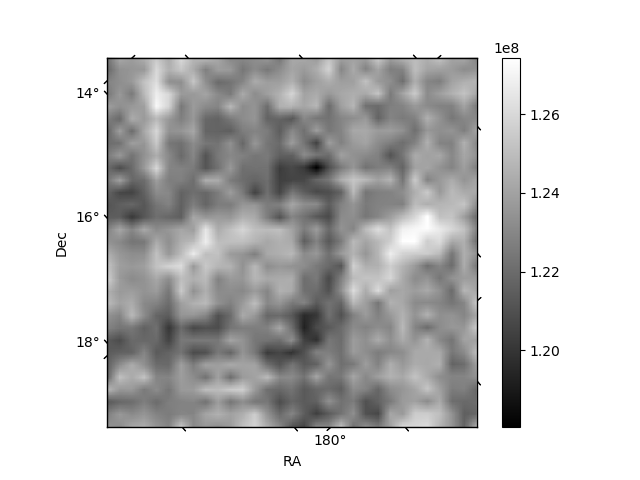
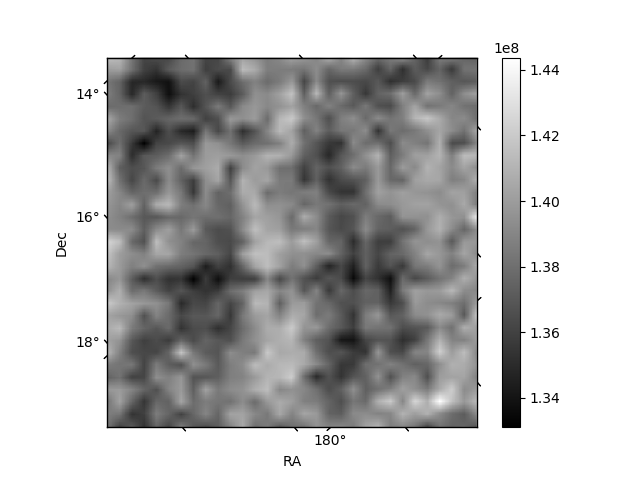
Histogram calculated using DETX and DETY for each event in the final _common_clean file
| Quadrant A | 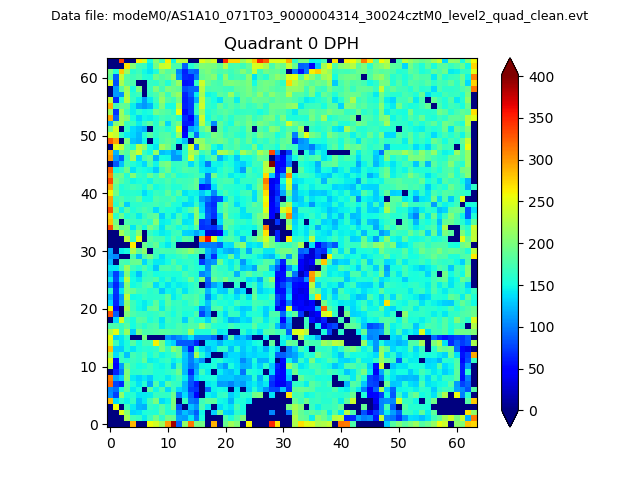 |
 |
Quadrant B |
|---|---|---|---|
| Quadrant D | 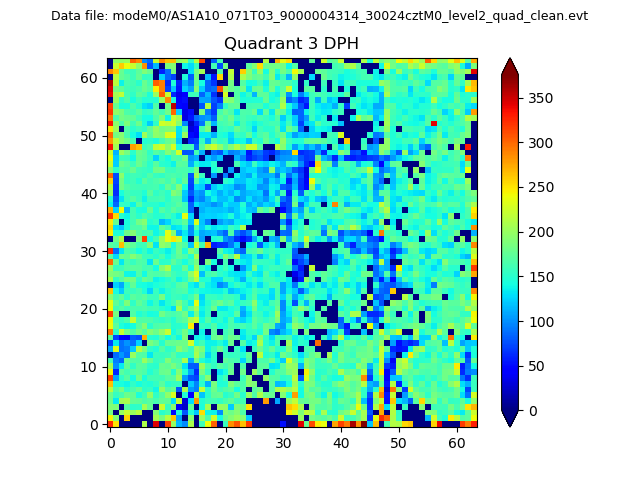 |
 |
Quadrant C |
| Plot type | Count rate plots | Images |
|---|---|---|
| Comparison with Poisson distribution Blue bars denote a histogram of data divided into 1 sec bins. Red curve is a Poisson curve with rate = median count rate of data. |
 |
 |
| Quadrant-wise count rates Data is divided into 100 sec bins |
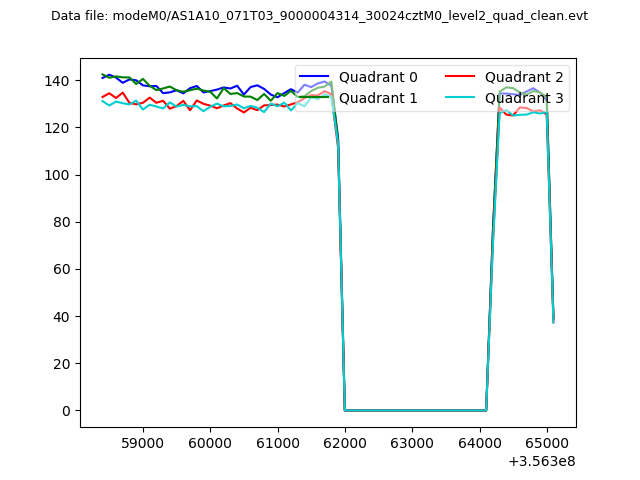 |
|
| Module-wise count rates for Quadrant A Data is divided into 100 sec bins |
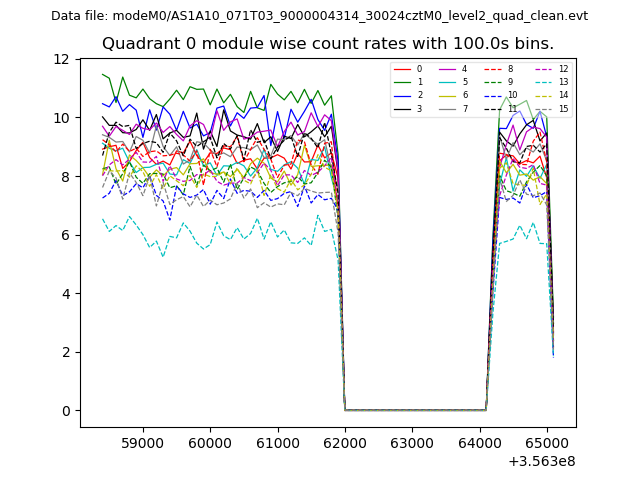 |
 |
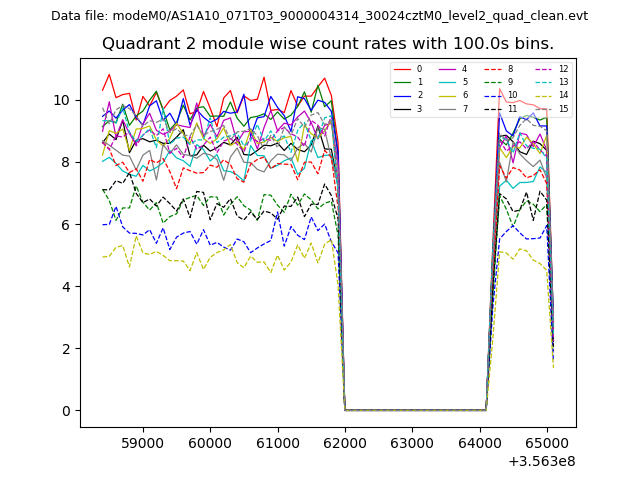
| Module-wise count rates for Quadrant B Data is divided into 100 sec bins |
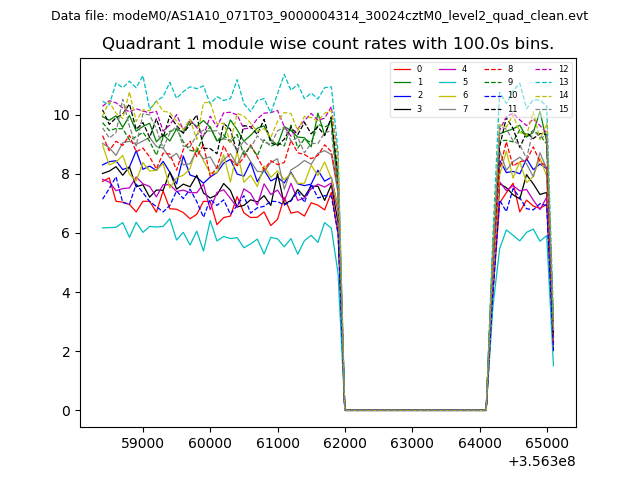 |
 |
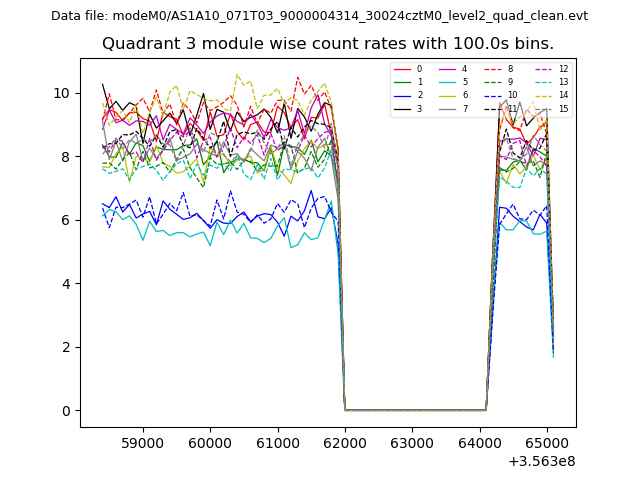
| Module-wise count rates for Quadrant C Data is divided into 100 sec bins |
 |
 |
| Module-wise count rates for Quadrant D Data is divided into 100 sec bins |
 |
 |
| Parameter | Plot |
|---|---|
| CZT HV Monitor | 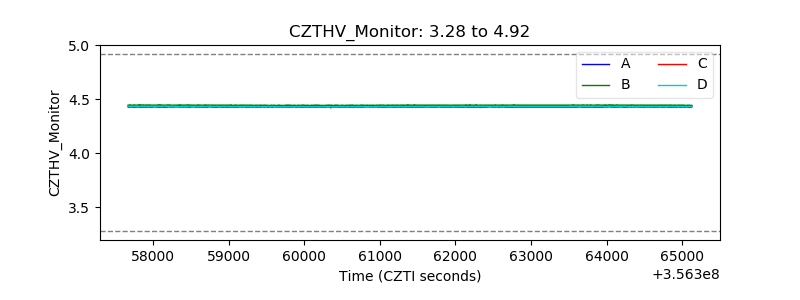 |
| D_VDD | 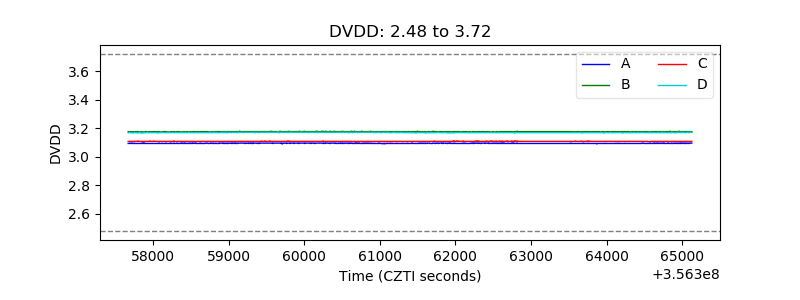 |
| Temperature 1 | 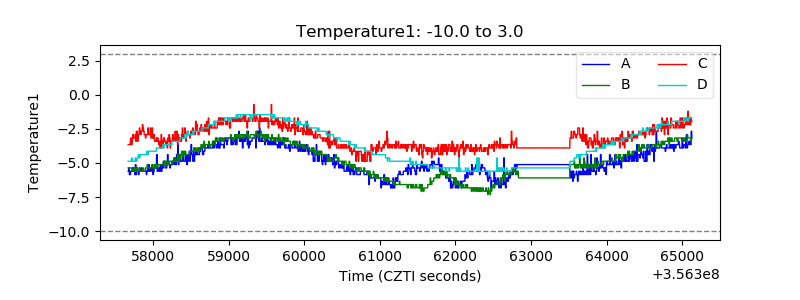 |
| Veto HV Monitor |  |
| Veto LLD | 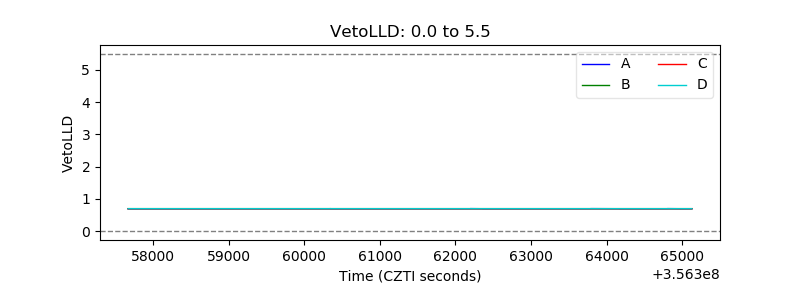 |
| Alpha Counter | 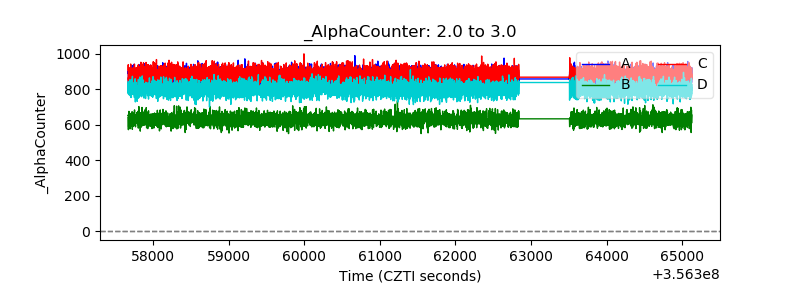 |
| _CPM_Rate | 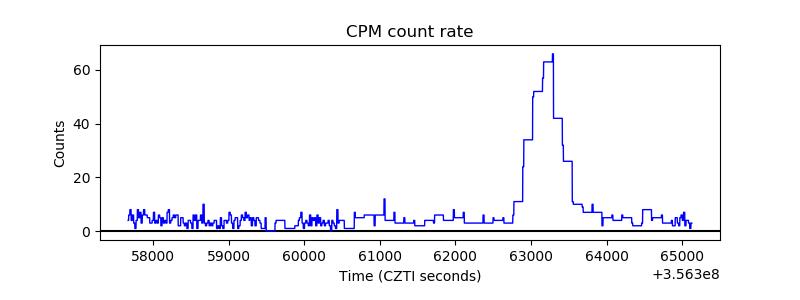 |
| CZT Counter | 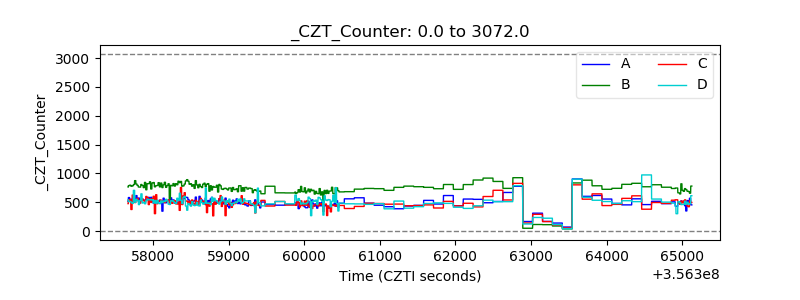 |
| +2.5 Volts monitor |  |
| +5 Volts monitor |  |
| _ROLL_ROT |  |
| _Roll_DEC |  |
| _Roll_RA | 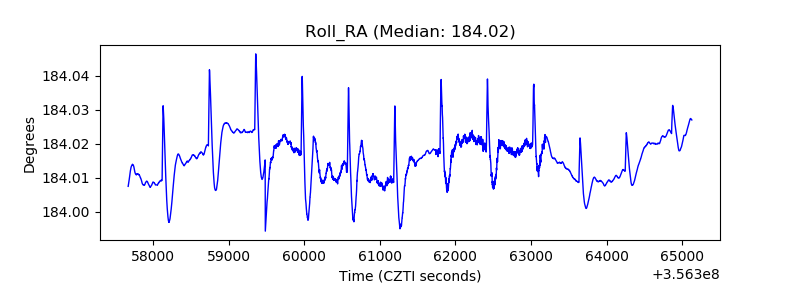 |
| Veto Counter | 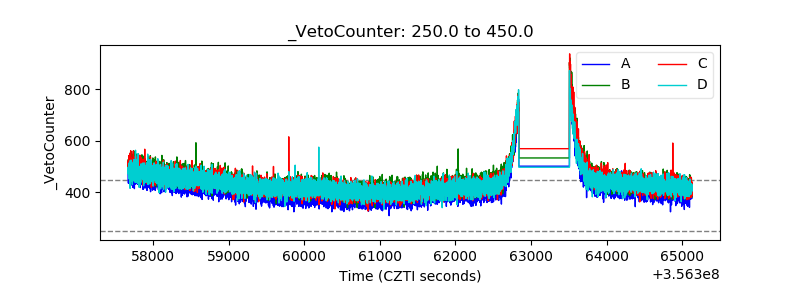 |