| Param | Original file | Final file |
|---|---|---|
| Filename | modeM0/AS1A10_071T03_9000004314_30025cztM0_level2.evt | modeM0/AS1A10_071T03_9000004314_30025cztM0_level2_quad_clean.evt |
| Size (bytes) | 603,253,440 | 98,297,280 |
| Size | 575.3 MB | 93.7 MB |
| Events in quadrant A | 3,859,209 | 628,827 |
| Events in quadrant B | 5,941,470 | 623,445 |
| Events in quadrant C | 3,904,064 | 598,714 |
| Events in quadrant D | 4,046,368 | 594,009 |
| Mode M9 | |||
|---|---|---|---|
| Quadrant | BADHDUFLAG | Total packets | Discarded packets |
| A | 0 | 9 | 0 |
| B | 0 | 9 | 0 |
| C | 0 | 9 | 0 |
| D | 0 | 9 | 0 |
| Mode M0 | |||
|---|---|---|---|
| Quadrant | BADHDUFLAG | Total packets | Discarded packets |
| A | 0 | 16197 | 2 |
| B | 0 | 23444 | 3 |
| C | 0 | 16262 | 2 |
| D | 0 | 16761 | 2 |
| Mode SS | |||
|---|---|---|---|
| Quadrant | BADHDUFLAG | Total packets | Discarded packets |
| A | 0 | 158 | 0 |
| B | 0 | 158 | 0 |
| C | 0 | 158 | 0 |
| D | 0 | 158 | 0 |
| Quadrant | Total seconds | Saturated seconds | Saturation percentage |
|---|---|---|---|
| A | 7641 | 334 | 4.371156% |
| B | 7641 | 484 | 6.334249% |
| C | 7641 | 402 | 5.261091% |
| D | 7641 | 284 | 3.716791% |
Noise dominated data is calculated using 1-second bins in cleaned event files. If a bin has >2000 counts, and if more than 50% of those come from <1% of pixels, then it is considered to be noise-dominated and hence unusable.
| Quadrant | # 1 sec bins | Bins with >0 counts | Bins with >2000 counts | High rate bins dominated by noise | Noise dominated (total time) | Noise dominated (detector-on time) | Marked lightcurve |
|---|---|---|---|---|---|---|---|
| A | 8551 | 7644 | 0 | 0 | 0.00% | 0.00% | 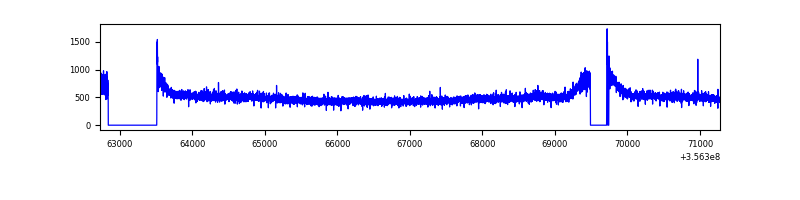 |
| B | 8551 | 7644 | 0 | 0 | 0.00% | 0.00% | 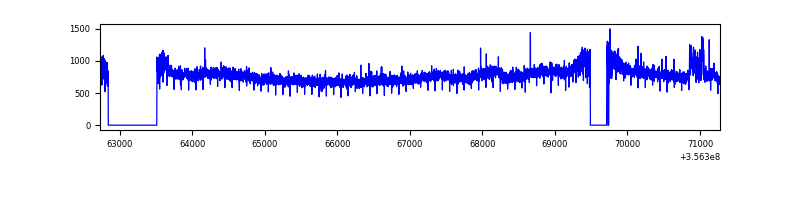 |
| C | 8551 | 7644 | 0 | 0 | 0.00% | 0.00% | 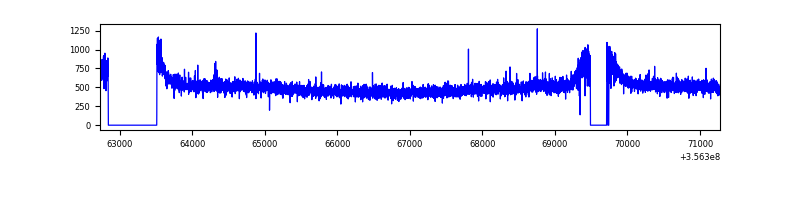 |
| D | 8551 | 7644 | 26 | 26 | 0.30% | 0.34% | 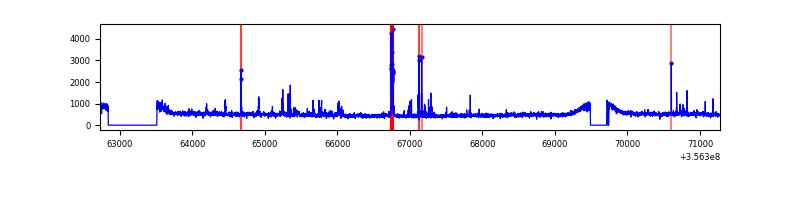 |
Top three noisy pixels from each quadrant. If the there are fewer than three noisy pixels in the level2.evt file, extra rows are filled as -1
| Pixel properties | Quadrant properties | ||||||
|---|---|---|---|---|---|---|---|
| Quadrant | DetID | PixID | Counts | Sigma | Mean | Median | Sigma |
| A | 8 | 192 | 22286 | 106.03 | 994 | 971 | 201.0 |
| A | 13 | 254 | 14108 | 65.35 | 994 | 971 | 201.0 |
| A | 3 | 137 | 10219 | 46.0 | 994 | 971 | 201.0 |
| B | 6 | 159 | 2044838 | 10806.72 | 967 | 941 | 189.1 |
| B | 6 | 36 | 75879 | 396.22 | 967 | 941 | 189.1 |
| B | 12 | 111 | 24434 | 124.21 | 967 | 941 | 189.1 |
| C | 14 | 238 | 151017 | 669.31 | 947 | 953 | 224.2 |
| C | 3 | 233 | 36680 | 159.35 | 947 | 953 | 224.2 |
| C | 2 | 114 | 17867 | 75.44 | 947 | 953 | 224.2 |
| D | 8 | 195 | 192347 | 832.09 | 963 | 936 | 230.0 |
| D | 7 | 80 | 87231 | 375.14 | 963 | 936 | 230.0 |
| D | 13 | 249 | 65546 | 280.87 | 963 | 936 | 230.0 |
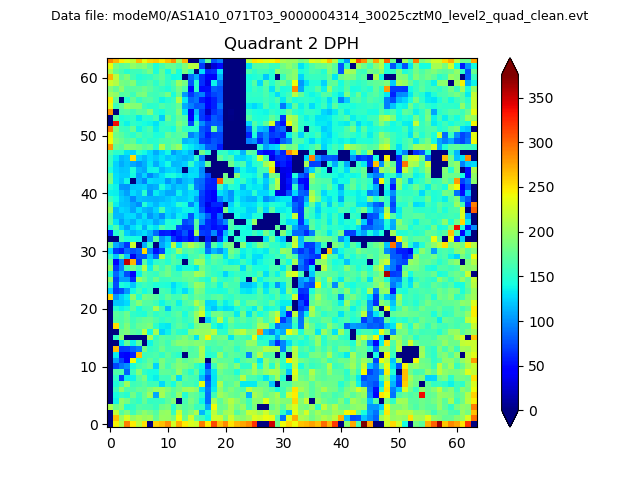
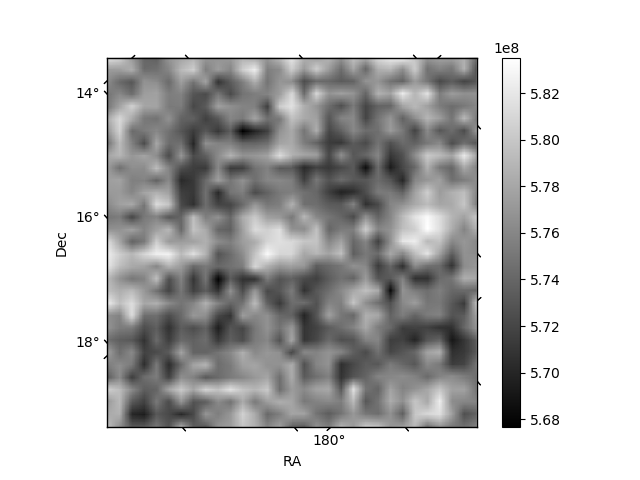
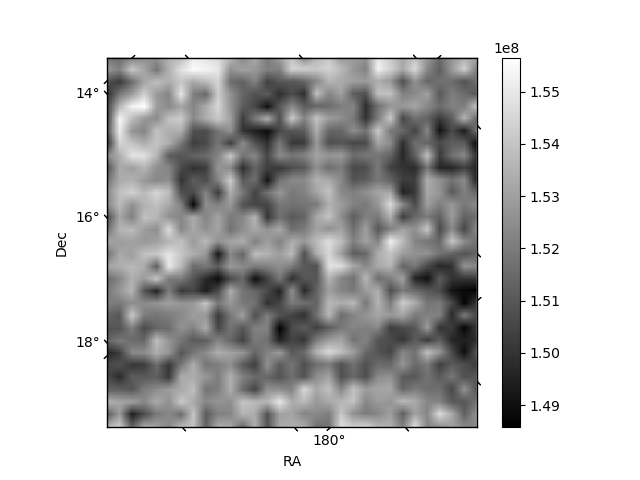
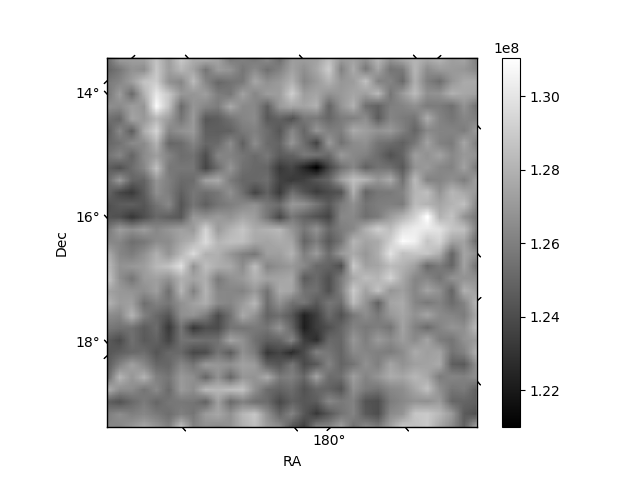
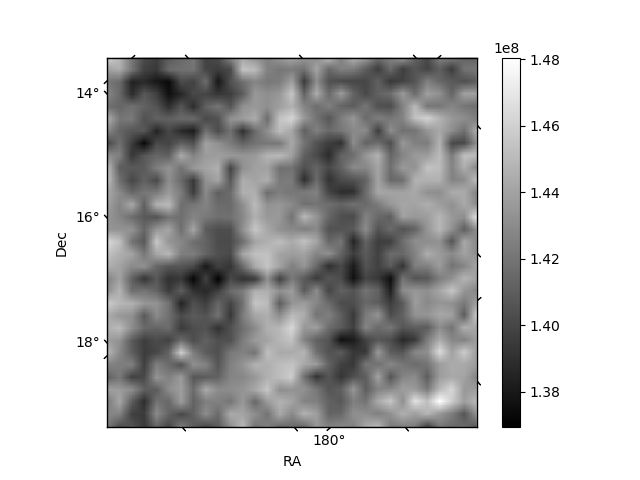
Histogram calculated using DETX and DETY for each event in the final _common_clean file
| Quadrant A | 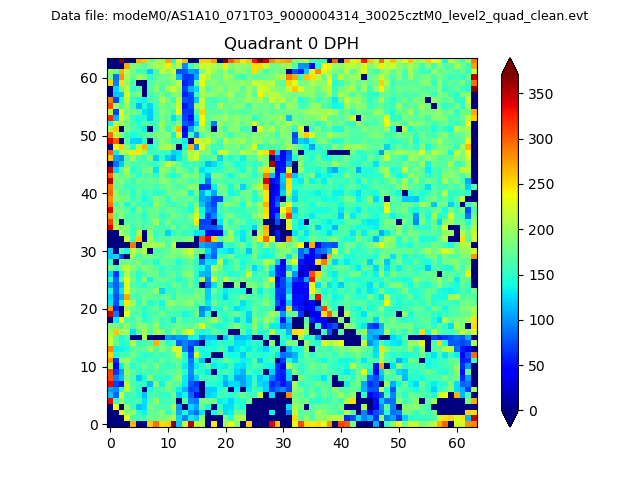 |
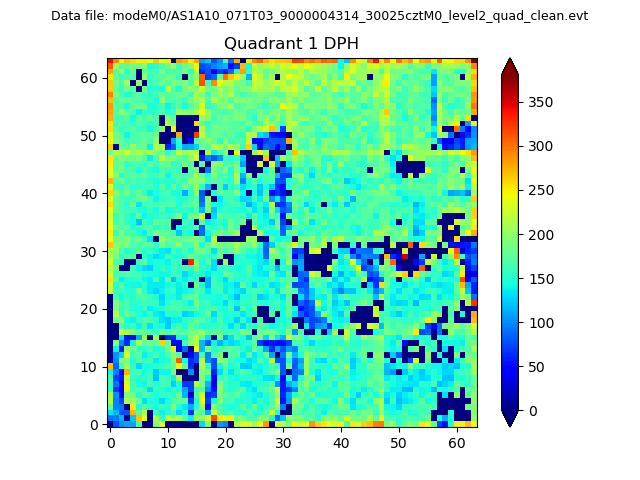 |
Quadrant B |
|---|---|---|---|
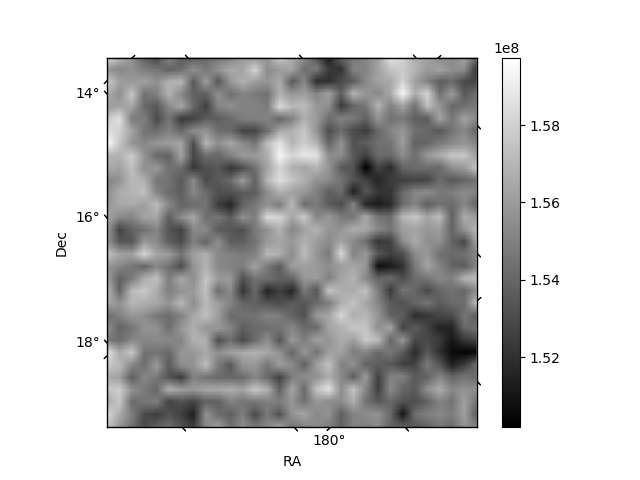
| Quadrant D | 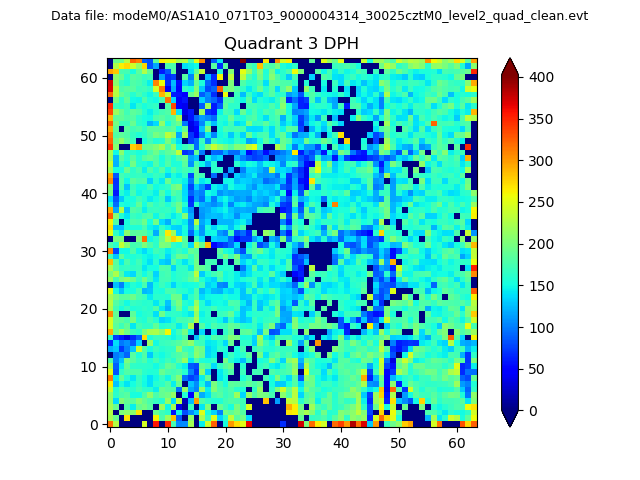 |
 |
Quadrant C |
| Plot type | Count rate plots | Images |
|---|---|---|
| Comparison with Poisson distribution Blue bars denote a histogram of data divided into 1 sec bins. Red curve is a Poisson curve with rate = median count rate of data. |
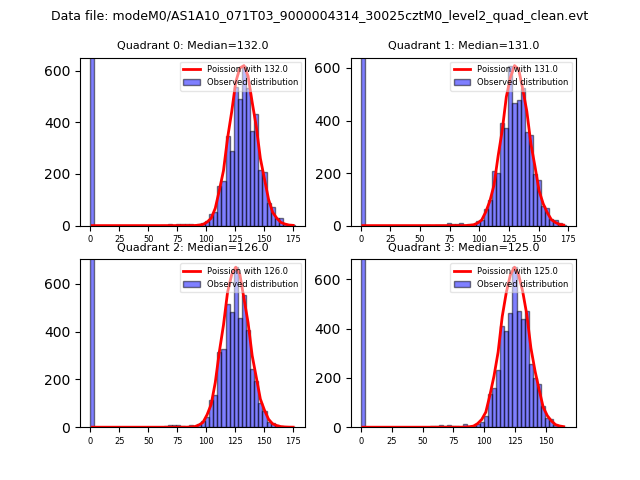 |
 |
| Quadrant-wise count rates Data is divided into 100 sec bins |
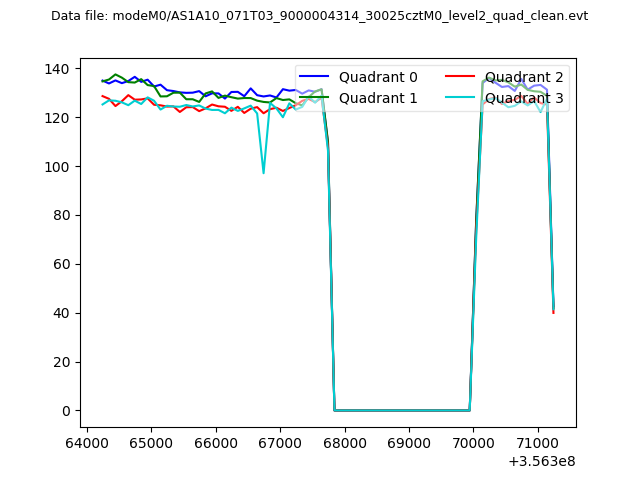 |
|
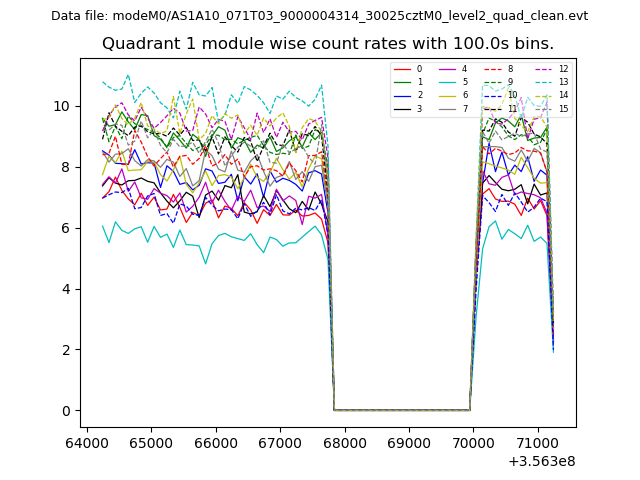
| Module-wise count rates for Quadrant A Data is divided into 100 sec bins |
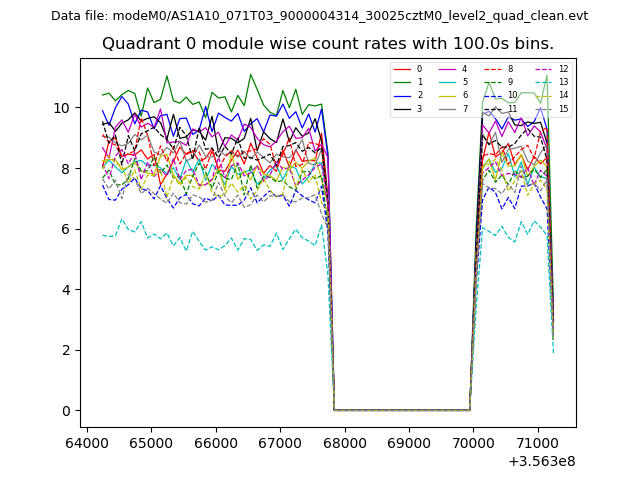 |
 |
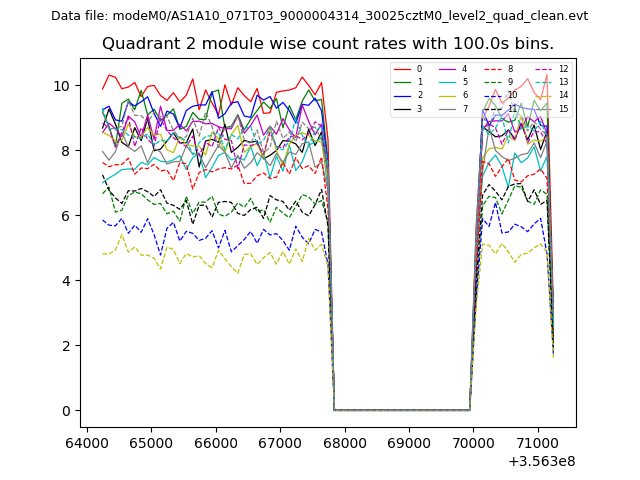
| Module-wise count rates for Quadrant B Data is divided into 100 sec bins |
 |
 |
| Module-wise count rates for Quadrant C Data is divided into 100 sec bins |
 |
 |
| Module-wise count rates for Quadrant D Data is divided into 100 sec bins |
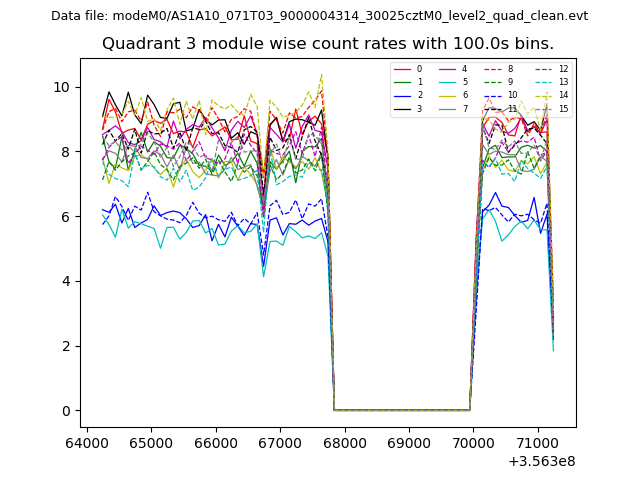 |
 |
| Parameter | Plot |
|---|---|
| CZT HV Monitor | 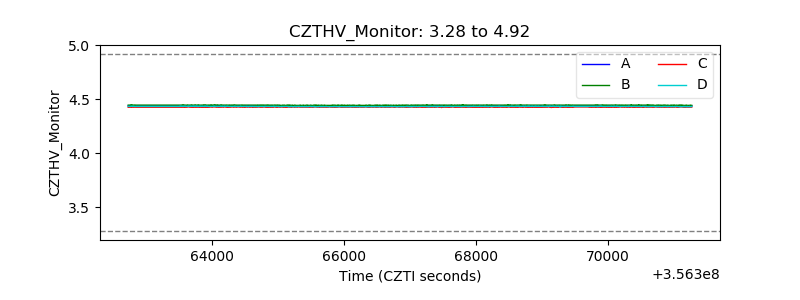 |
| D_VDD | 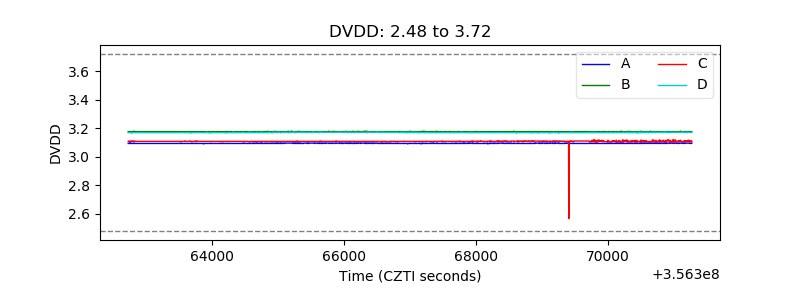 |
| Temperature 1 |  |
| Veto HV Monitor | 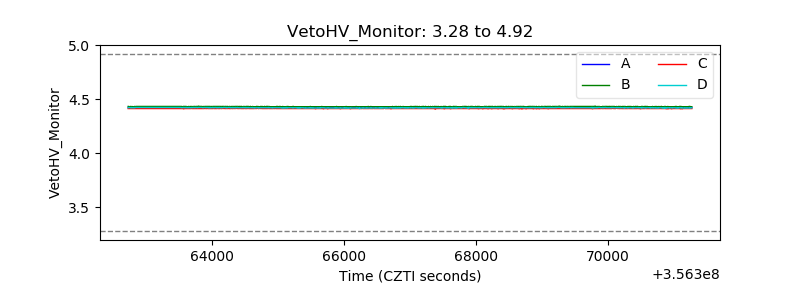 |
| Veto LLD | 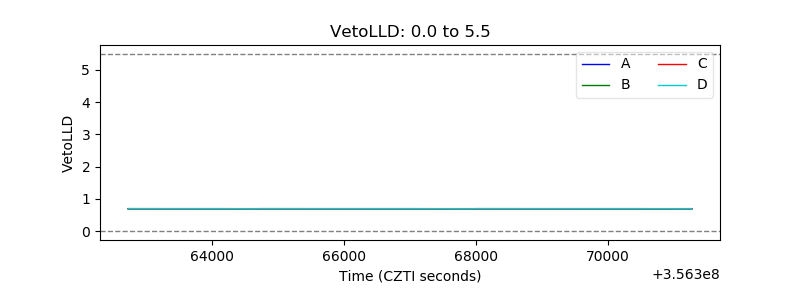 |
| Alpha Counter | 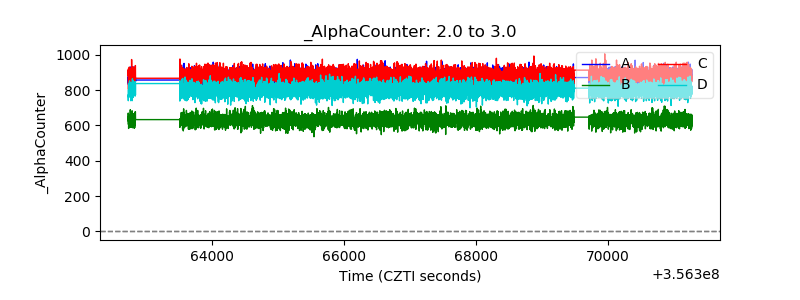 |
| _CPM_Rate | 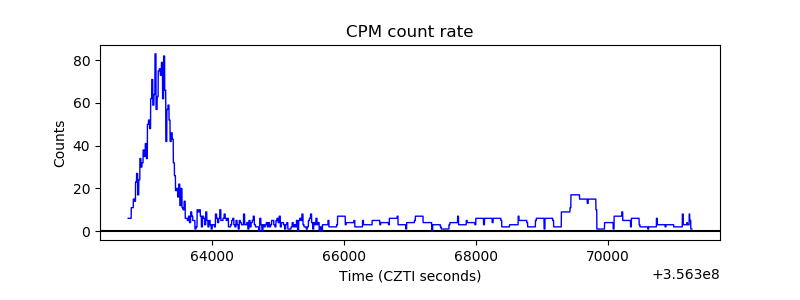 |
| CZT Counter | 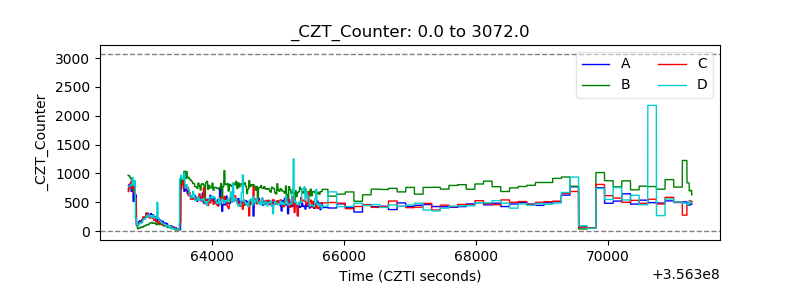 |
| +2.5 Volts monitor |  |
| +5 Volts monitor | 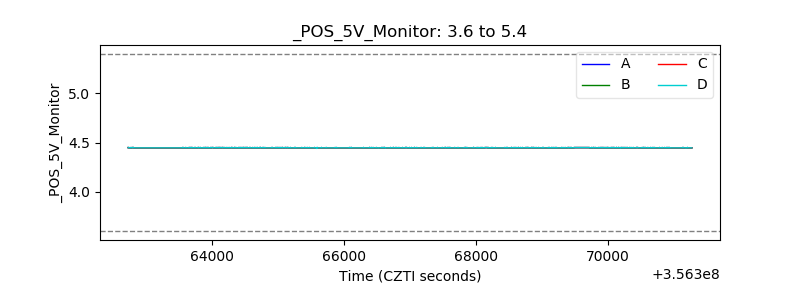 |
| _ROLL_ROT | 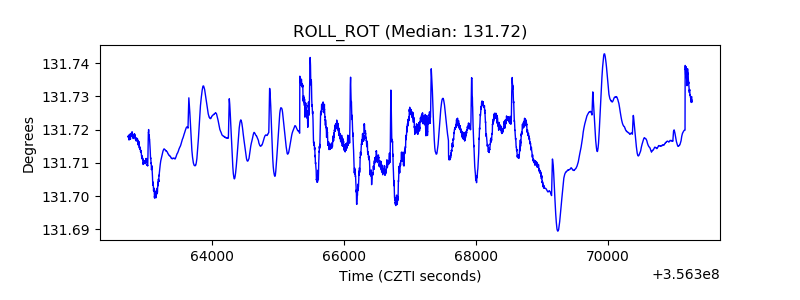 |
| _Roll_DEC | 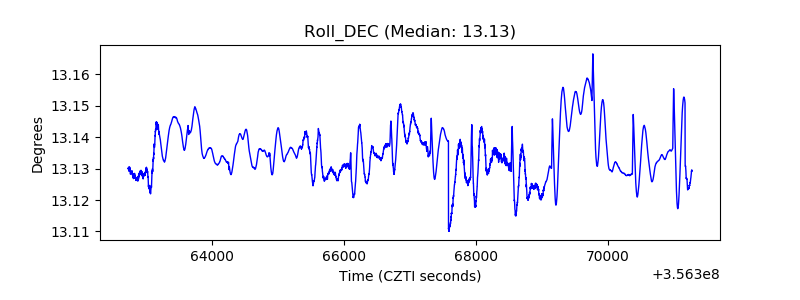 |
| _Roll_RA | 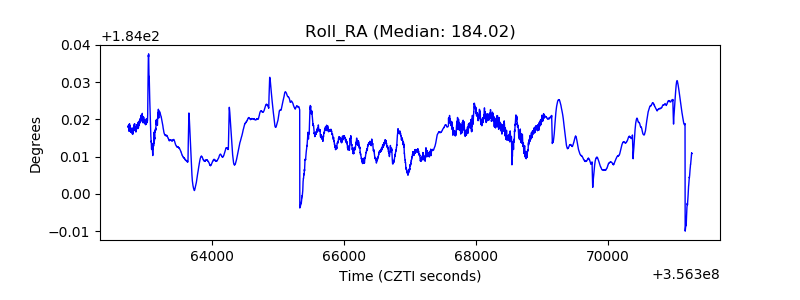 |
| Veto Counter | 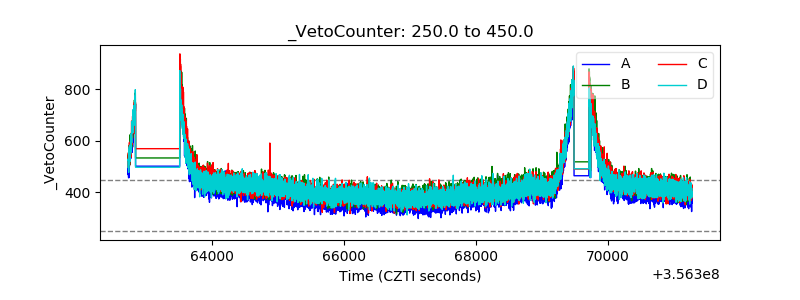 |