| Param | Original file | Final file |
|---|---|---|
| Filename | modeM0/AS1A10_071T03_9000004314_30026cztM0_level2.evt | modeM0/AS1A10_071T03_9000004314_30026cztM0_level2_quad_clean.evt |
| Size (bytes) | 204,854,400 | 49,443,840 |
| Size | 195.4 MB | 47.2 MB |
| Events in quadrant A | 1,270,396 | 335,984 |
| Events in quadrant B | 2,021,684 | 332,708 |
| Events in quadrant C | 1,308,518 | 317,205 |
| Events in quadrant D | 1,416,230 | 316,131 |
| Mode M0 | |||
|---|---|---|---|
| Quadrant | BADHDUFLAG | Total packets | Discarded packets |
| A | 0 | 5503 | 0 |
| B | 0 | 8241 | 0 |
| C | 0 | 5562 | 0 |
| D | 0 | 5807 | 0 |
| Mode SS | |||
|---|---|---|---|
| Quadrant | BADHDUFLAG | Total packets | Discarded packets |
| A | 0 | 56 | 0 |
| B | 0 | 56 | 0 |
| C | 0 | 56 | 0 |
| D | 0 | 56 | 0 |
| Quadrant | Total seconds | Saturated seconds | Saturation percentage |
|---|---|---|---|
| A | 2720 | 0 | 0.000000% |
| B | 2721 | 15 | 0.551268% |
| C | 2721 | 11 | 0.404263% |
| D | 2721 | 17 | 0.624770% |
Noise dominated data is calculated using 1-second bins in cleaned event files. If a bin has >2000 counts, and if more than 50% of those come from <1% of pixels, then it is considered to be noise-dominated and hence unusable.
| Quadrant | # 1 sec bins | Bins with >0 counts | Bins with >2000 counts | High rate bins dominated by noise | Noise dominated (total time) | Noise dominated (detector-on time) | Marked lightcurve |
|---|---|---|---|---|---|---|---|
| A | 2720 | 2720 | 0 | 0 | 0.00% | 0.00% | 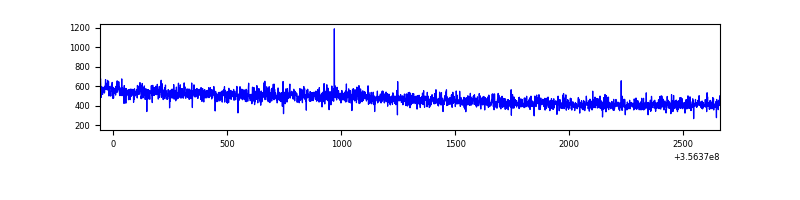 |
| B | 2721 | 2721 | 0 | 0 | 0.00% | 0.00% | 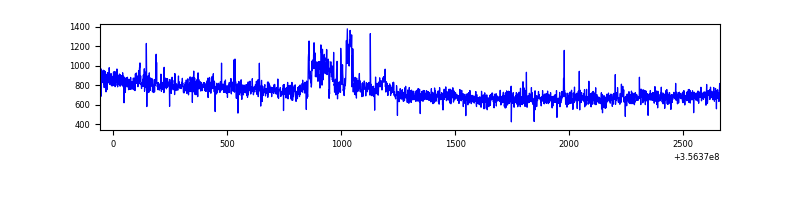 |
| C | 2721 | 2721 | 0 | 0 | 0.00% | 0.00% | 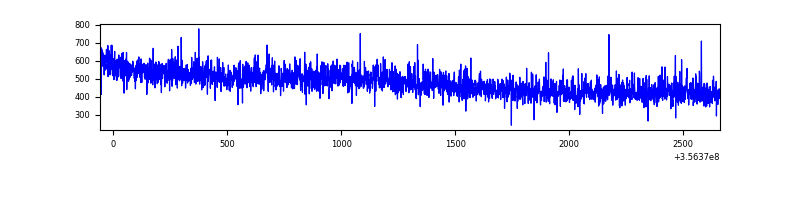 |
| D | 2721 | 2721 | 14 | 14 | 0.51% | 0.51% | 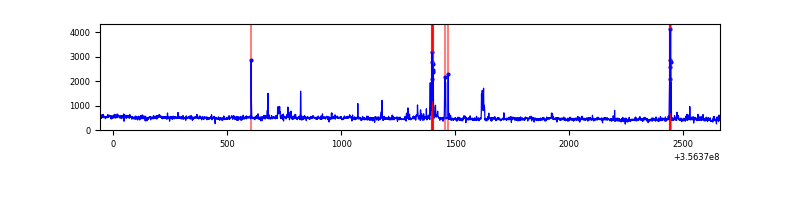 |
Top three noisy pixels from each quadrant. If the there are fewer than three noisy pixels in the level2.evt file, extra rows are filled as -1
| Pixel properties | Quadrant properties | ||||||
|---|---|---|---|---|---|---|---|
| Quadrant | DetID | PixID | Counts | Sigma | Mean | Median | Sigma |
| A | 13 | 254 | 5312 | 74.2 | 329 | 322 | 67.3 |
| A | 3 | 137 | 3280 | 43.98 | 329 | 322 | 67.3 |
| A | 0 | 226 | 2806 | 36.94 | 329 | 322 | 67.3 |
| B | 6 | 159 | 679823 | 10697.7 | 321 | 314 | 63.5 |
| B | 6 | 36 | 72501 | 1136.46 | 321 | 314 | 63.5 |
| B | 12 | 111 | 7500 | 113.13 | 321 | 314 | 63.5 |
| C | 14 | 238 | 50765 | 671.22 | 315 | 317 | 75.2 |
| C | 3 | 233 | 17027 | 222.33 | 315 | 317 | 75.2 |
| C | 2 | 114 | 6131 | 77.36 | 315 | 317 | 75.2 |
| D | 8 | 195 | 91700 | 1180.83 | 319 | 312 | 77.4 |
| D | 7 | 80 | 84894 | 1092.89 | 319 | 312 | 77.4 |
| D | 13 | 249 | 18929 | 240.55 | 319 | 312 | 77.4 |
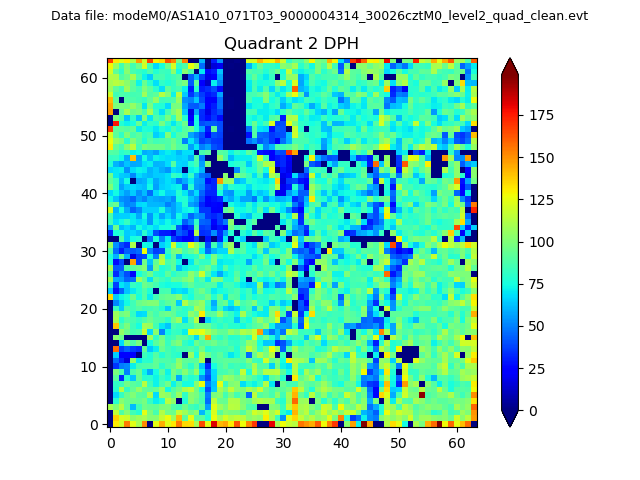
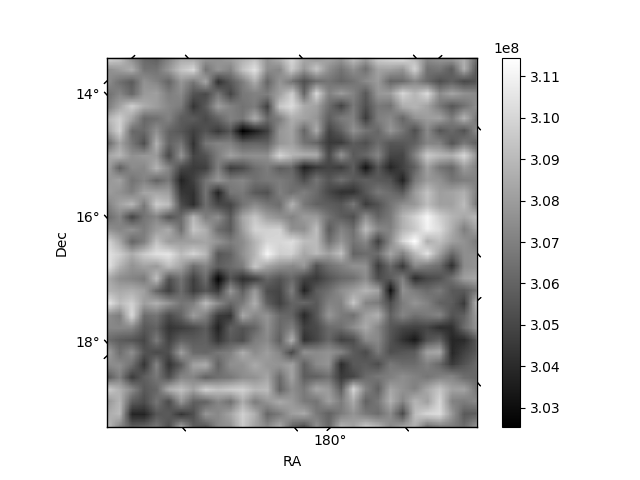
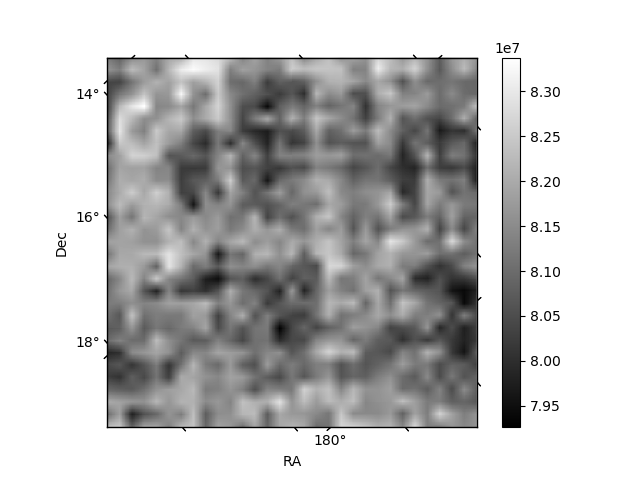
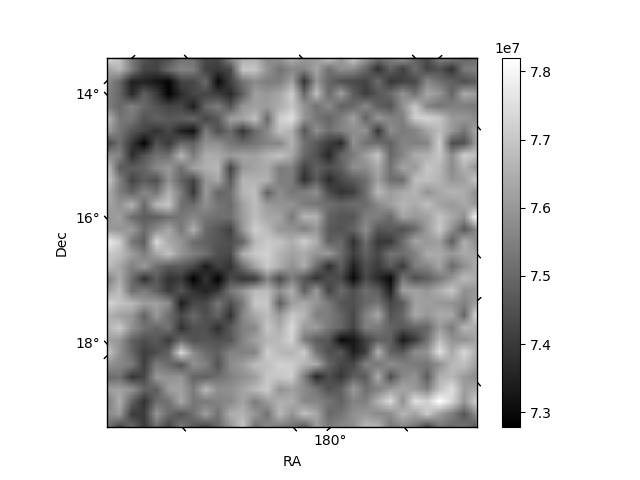
Histogram calculated using DETX and DETY for each event in the final _common_clean file
| Quadrant A | 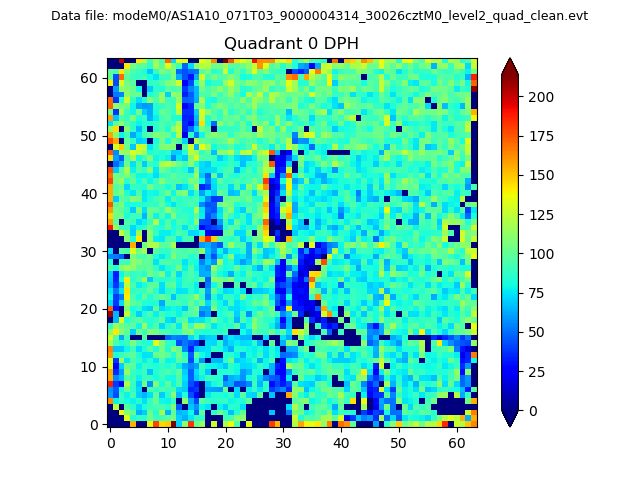 |
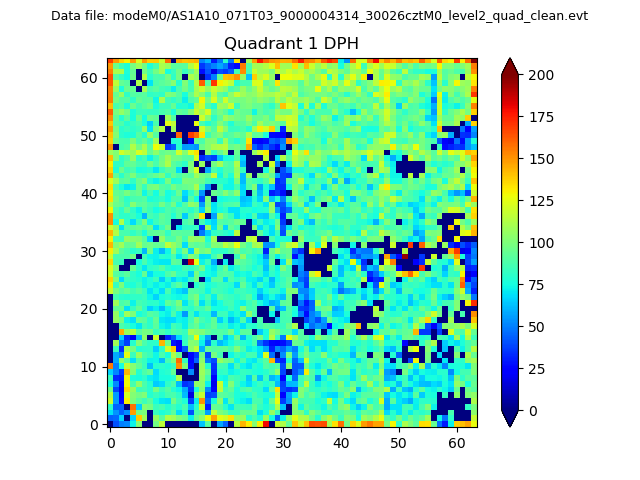 |
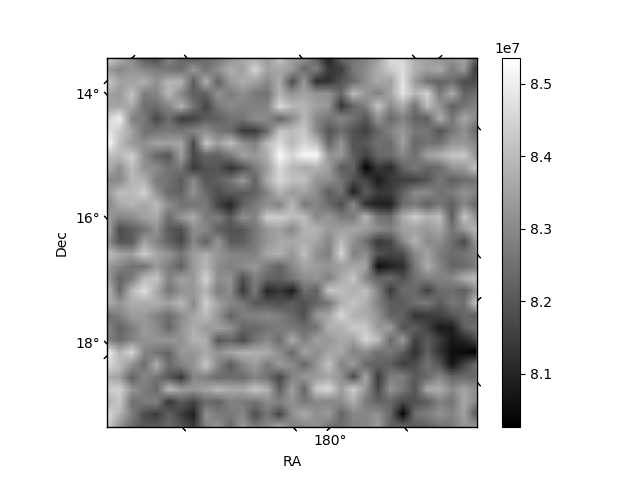
Quadrant B |
|---|---|---|---|
| Quadrant D | 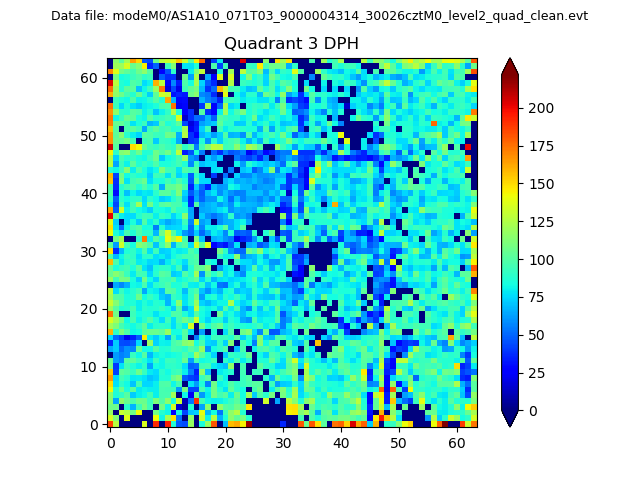 |
 |
Quadrant C |
| Plot type | Count rate plots | Images |
|---|---|---|
| Comparison with Poisson distribution Blue bars denote a histogram of data divided into 1 sec bins. Red curve is a Poisson curve with rate = median count rate of data. |
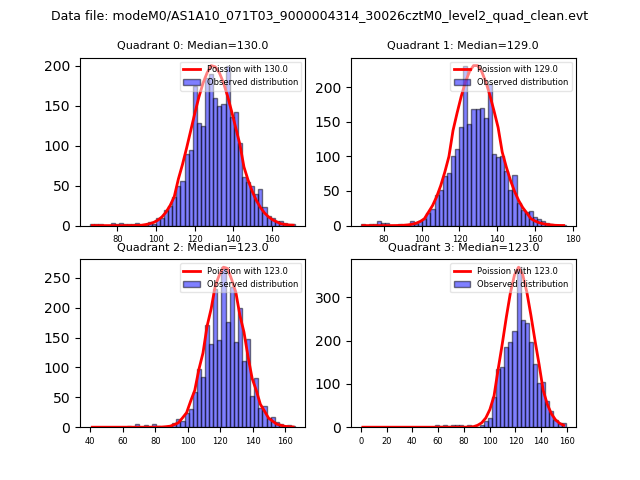 |
 |
| Quadrant-wise count rates Data is divided into 100 sec bins |
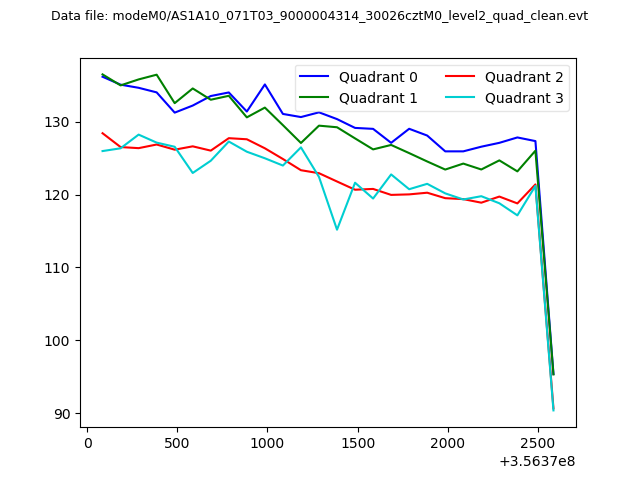 |
|
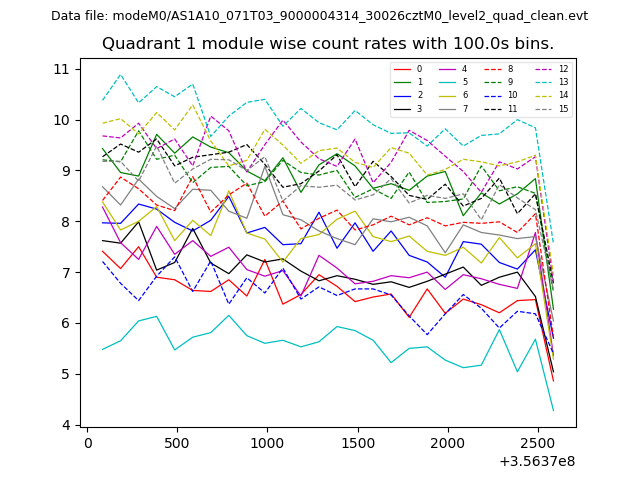
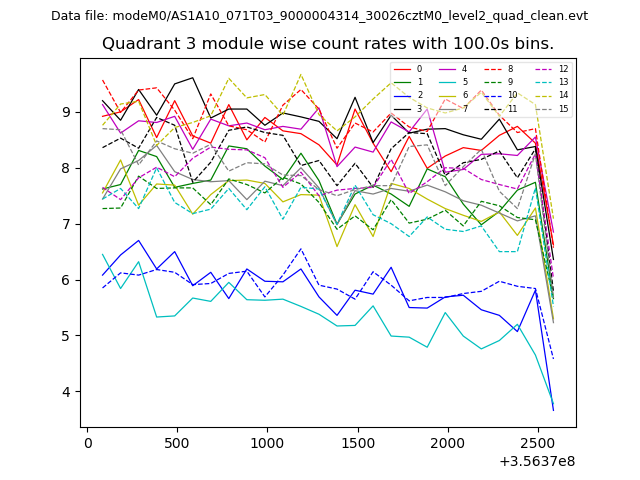
| Module-wise count rates for Quadrant A Data is divided into 100 sec bins |
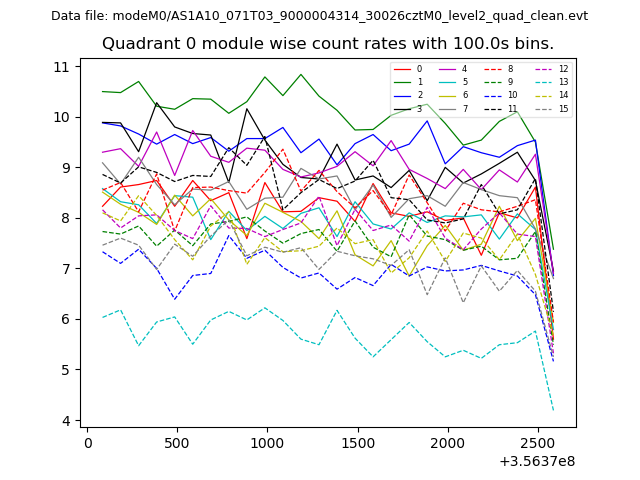 |
 |
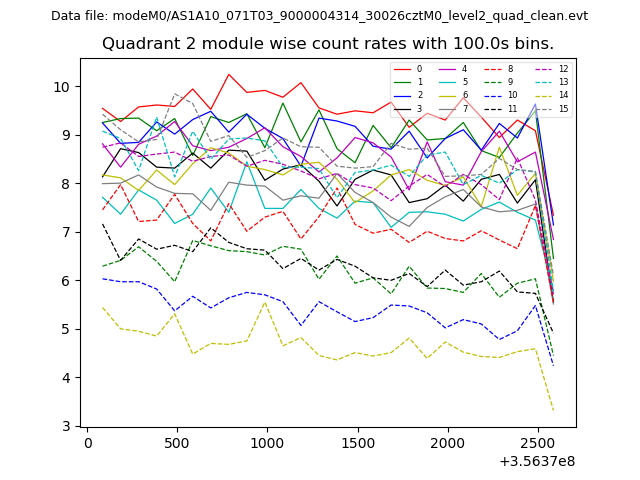
| Module-wise count rates for Quadrant B Data is divided into 100 sec bins |
 |
 |
| Module-wise count rates for Quadrant C Data is divided into 100 sec bins |
 |
 |
| Module-wise count rates for Quadrant D Data is divided into 100 sec bins |
 |
 |
| Parameter | Plot |
|---|---|
| CZT HV Monitor | 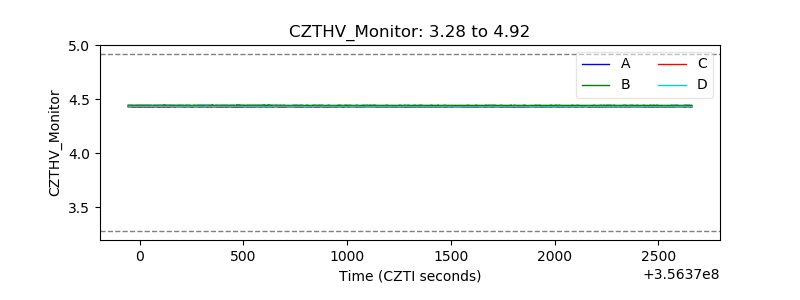 |
| D_VDD | 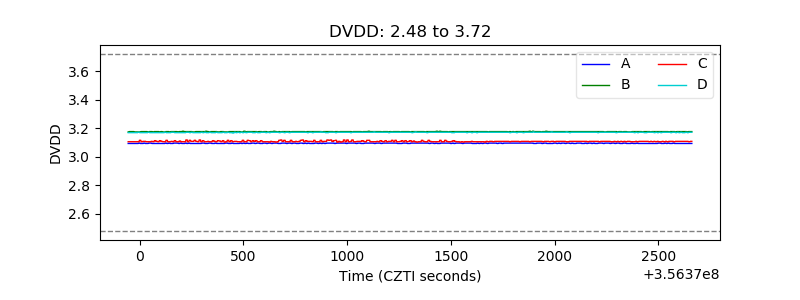 |
| Temperature 1 | 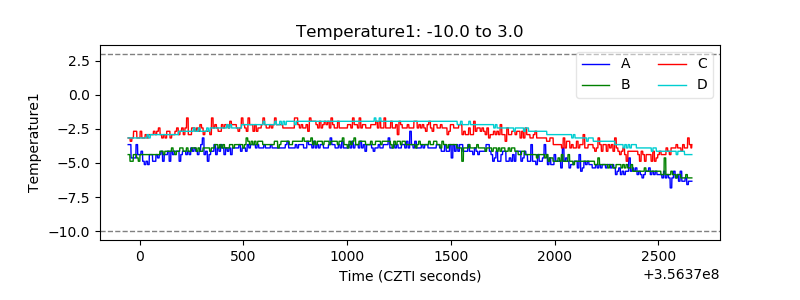 |
| Veto HV Monitor | 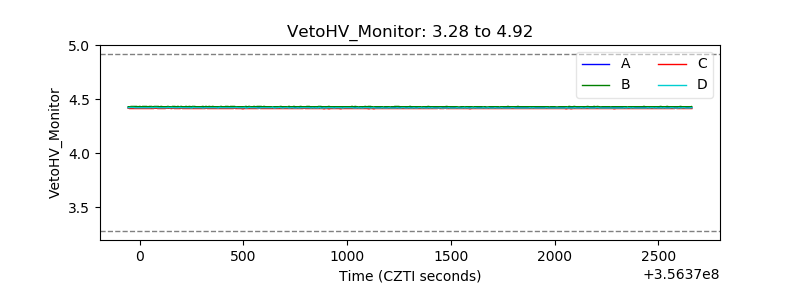 |
| Veto LLD | 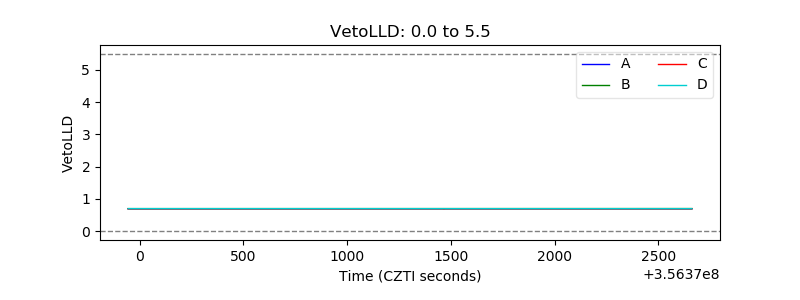 |
| Alpha Counter | 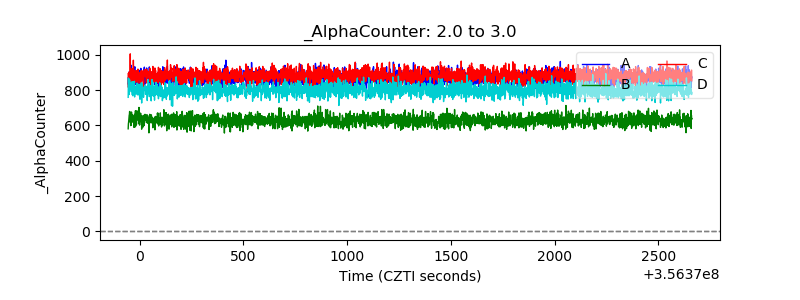 |
| _CPM_Rate | 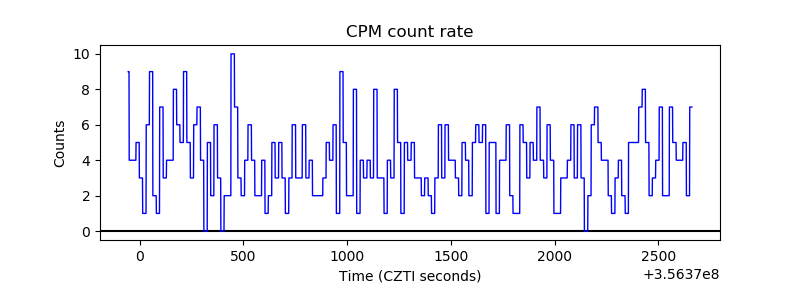 |
| CZT Counter | 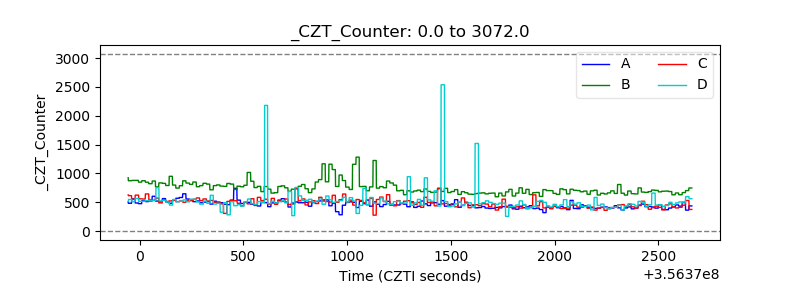 |
| +2.5 Volts monitor | 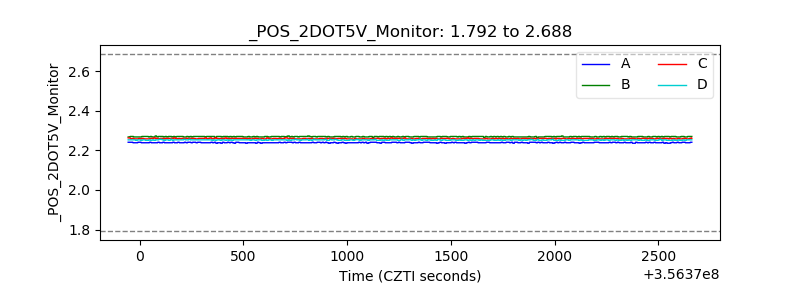 |
| +5 Volts monitor |  |
| _ROLL_ROT | 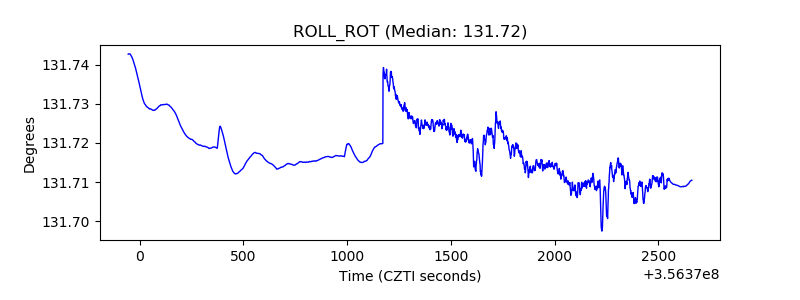 |
| _Roll_DEC | 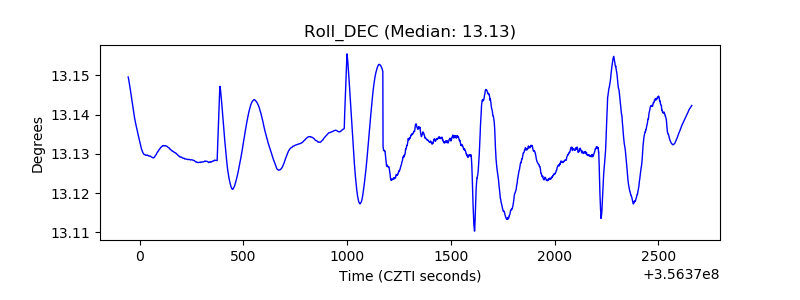 |
| _Roll_RA | 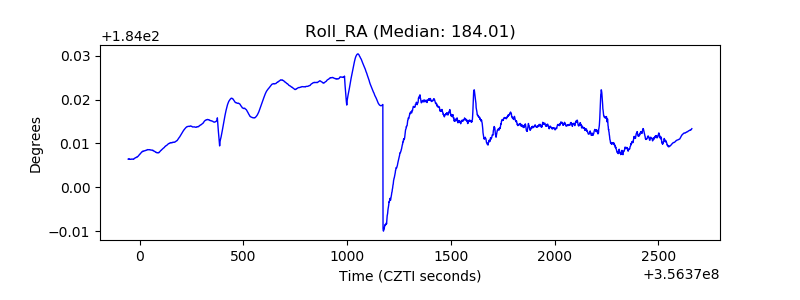 |
| Veto Counter | 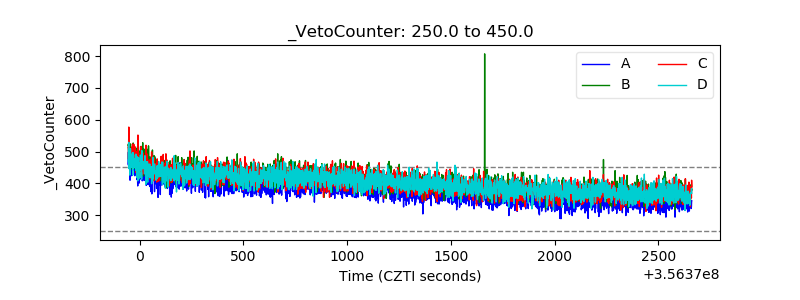 |