| Param | Original file | Final file |
|---|---|---|
| Filename | modeM0/AS1A10_071T04_9000004316cztM0_level2.fits | modeM0/AS1A10_071T04_9000004316cztM0_level2_quad_clean.evt |
| Size (bytes) | 605,741,760 | 448,729,920 |
| Size | 577.7 MB | 427.9 MB |
| Events in quadrant A | 3,826,386 | 2,519,760 |
| Events in quadrant B | 3,583,292 | 2,480,557 |
| Events in quadrant C | 3,624,648 | 2,336,917 |
| Events in quadrant D | 3,239,928 | 2,178,608 |
| Mode M9 | |||
|---|---|---|---|
| Quadrant | BADHDUFLAG | Total packets | Discarded packets |
| A | 0 | 99 | 0 |
| B | 0 | 99 | 0 |
| C | 0 | 99 | 0 |
| D | 0 | 99 | 0 |
| Mode SS | |||
|---|---|---|---|
| Quadrant | BADHDUFLAG | Total packets | Discarded packets |
| A | 0 | 1208 | 0 |
| B | 0 | 1208 | 0 |
| C | 0 | 1208 | 0 |
| D | 0 | 1208 | 0 |
| Mode M0 | |||
|---|---|---|---|
| Quadrant | BADHDUFLAG | Total packets | Discarded packets |
| A | 0 | 124353 | 0 |
| B | 0 | 179955 | 0 |
| C | 0 | 127803 | 0 |
| D | 0 | 131394 | 0 |
| Quadrant | Total seconds | Saturated seconds | Saturation percentage |
|---|---|---|---|
| A | 59358 | 723 | 1.218033% |
| B | 59358 | 1253 | 2.110920% |
| C | 59358 | 1381 | 2.326561% |
| D | 59358 | 571 | 0.961960% |
Noise dominated data is calculated using 1-second bins in cleaned event files. If a bin has >2000 counts, and if more than 50% of those come from <1% of pixels, then it is considered to be noise-dominated and hence unusable.
| Quadrant | # 1 sec bins | Bins with >0 counts | Bins with >2000 counts | High rate bins dominated by noise | Noise dominated (total time) | Noise dominated (detector-on time) | Marked lightcurve |
|---|---|---|---|---|---|---|---|
| A | 69098 | 59359 | 0 | 0 | 0.00% | 0.00% |  |
| B | 69098 | 59357 | 0 | 0 | 0.00% | 0.00% |  |
| C | 69098 | 59355 | 0 | 0 | 0.00% | 0.00% |  |
| D | 69098 | 59358 | 0 | 0 | 0.00% | 0.00% | 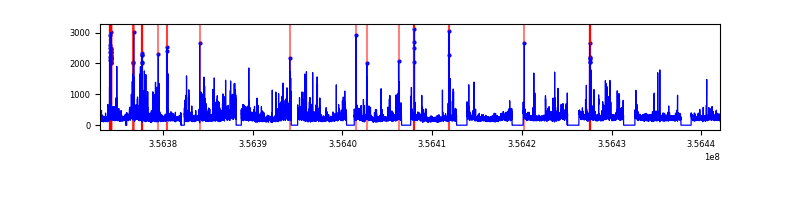 |
Top three noisy pixels from each quadrant. If the there are fewer than three noisy pixels in the level2.evt file, extra rows are filled as -1
| Pixel properties | Quadrant properties | ||||||
|---|---|---|---|---|---|---|---|
| Quadrant | DetID | PixID | Counts | Sigma | Mean | Median | Sigma |
| A | 0 | 29 | 3667 | 11.24 | 996 | 937 | 242.9 |
| A | 7 | 110 | 2983 | 8.42 | 996 | 937 | 242.9 |
| A | 0 | 30 | 2934 | 8.22 | 996 | 937 | 242.9 |
| B | 2 | 9 | 2813 | 10.1 | 946 | 904 | 188.9 |
| B | 2 | 8 | 2422 | 8.03 | 946 | 904 | 188.9 |
| B | 3 | 80 | 2347 | 7.64 | 946 | 904 | 188.9 |
| C | 1 | 81 | 2803 | 7.92 | 957 | 895 | 241.0 |
| C | 1 | 80 | 2781 | 7.82 | 957 | 895 | 241.0 |
| C | 9 | 209 | 2475 | 6.56 | 957 | 895 | 241.0 |
| D | 15 | 46 | 2352 | 6.19 | 925 | 845 | 243.3 |
| D | 10 | 189 | 2311 | 6.02 | 925 | 845 | 243.3 |
| D | 6 | 67 | 2300 | 5.98 | 925 | 845 | 243.3 |
Histogram calculated using DETX and DETY for each event in the final _common_clean file
| Quadrant A | 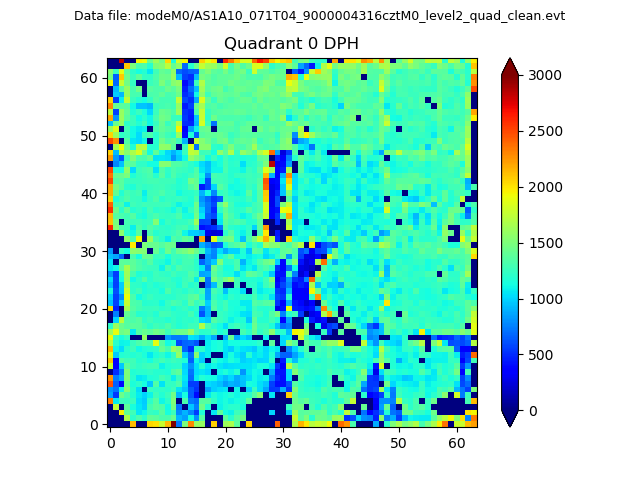 |
 |
Quadrant B |
|---|---|---|---|
| Quadrant D |  |
 |
Quadrant C |
| Plot type | Count rate plots | Images |
|---|---|---|
| Comparison with Poisson distribution Blue bars denote a histogram of data divided into 1 sec bins. Red curve is a Poisson curve with rate = median count rate of data. |
 |
 |
| Quadrant-wise count rates Data is divided into 100 sec bins |
 |
|
| Module-wise count rates for Quadrant A Data is divided into 100 sec bins |
 |
 |
| Module-wise count rates for Quadrant B Data is divided into 100 sec bins |
 |
 |
| Module-wise count rates for Quadrant C Data is divided into 100 sec bins |
 |
 |
| Module-wise count rates for Quadrant D Data is divided into 100 sec bins |
 |
 |
| Parameter | Plot |
|---|---|
| CZT HV Monitor |  |
| D_VDD |  |
| Temperature 1 |  |
| Veto HV Monitor |  |
| Veto LLD |  |
| Alpha Counter |  |
| _CPM_Rate |  |
| CZT Counter |  |
| +2.5 Volts monitor |  |
| +5 Volts monitor |  |
| _ROLL_ROT |  |
| _Roll_DEC |  |
| _Roll_RA |  |
| Veto Counter |  |