| Param | Original file | Final file |
|---|---|---|
| Filename | modeM0/AS1A10_071T04_9000004316_30033cztM0_level2.evt | modeM0/AS1A10_071T04_9000004316_30033cztM0_level2_quad_clean.evt |
| Size (bytes) | 508,380,480 | 83,272,320 |
| Size | 484.8 MB | 79.4 MB |
| Events in quadrant A | 3,204,468 | 532,958 |
| Events in quadrant B | 4,999,074 | 536,217 |
| Events in quadrant C | 3,558,811 | 506,309 |
| Events in quadrant D | 3,198,289 | 497,865 |
| Mode M9 | |||
|---|---|---|---|
| Quadrant | BADHDUFLAG | Total packets | Discarded packets |
| A | 0 | 19 | 0 |
| B | 0 | 20 | 0 |
| C | 0 | 20 | 0 |
| D | 0 | 20 | 0 |
| Mode SS | |||
|---|---|---|---|
| Quadrant | BADHDUFLAG | Total packets | Discarded packets |
| A | 0 | 130 | 0 |
| B | 0 | 130 | 0 |
| C | 0 | 130 | 0 |
| D | 0 | 130 | 0 |
| Mode M0 | |||
|---|---|---|---|
| Quadrant | BADHDUFLAG | Total packets | Discarded packets |
| A | 0 | 13368 | 2 |
| B | 0 | 19405 | 2 |
| C | 0 | 14504 | 2 |
| D | 0 | 13623 | 2 |
| Quadrant | Total seconds | Saturated seconds | Saturation percentage |
|---|---|---|---|
| A | 6427 | 33 | 0.513459% |
| B | 6427 | 41 | 0.637934% |
| C | 6427 | 96 | 1.493698% |
| D | 6427 | 15 | 0.233390% |
Noise dominated data is calculated using 1-second bins in cleaned event files. If a bin has >2000 counts, and if more than 50% of those come from <1% of pixels, then it is considered to be noise-dominated and hence unusable.
| Quadrant | # 1 sec bins | Bins with >0 counts | Bins with >2000 counts | High rate bins dominated by noise | Noise dominated (total time) | Noise dominated (detector-on time) | Marked lightcurve |
|---|---|---|---|---|---|---|---|
| A | 7592 | 6428 | 8 | 8 | 0.11% | 0.12% | 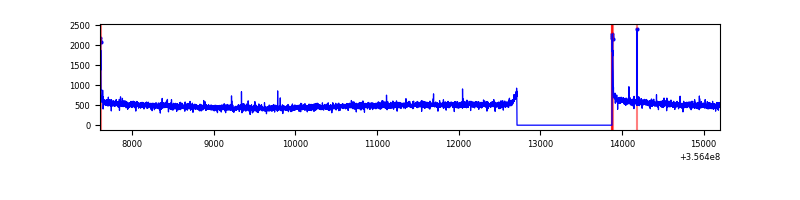 |
| B | 7592 | 6428 | 1 | 1 | 0.01% | 0.02% | 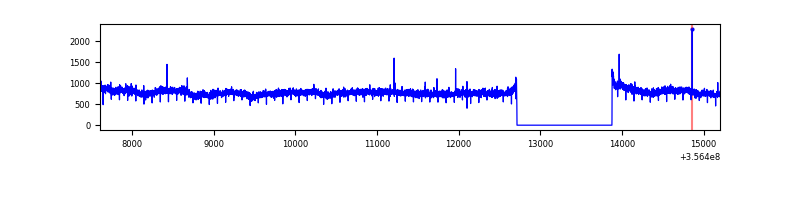 |
| C | 7592 | 6428 | 1 | 1 | 0.01% | 0.02% | 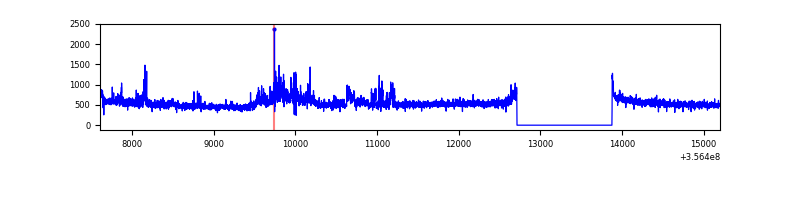 |
| D | 7592 | 6428 | 8 | 8 | 0.11% | 0.12% | 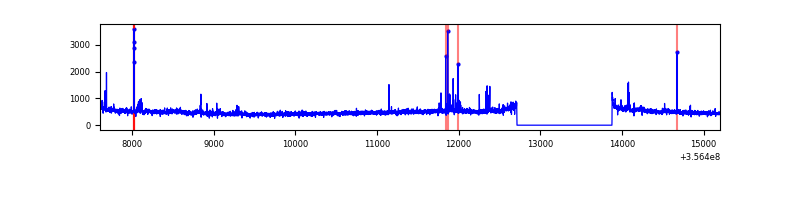 |
Top three noisy pixels from each quadrant. If the there are fewer than three noisy pixels in the level2.evt file, extra rows are filled as -1
| Pixel properties | Quadrant properties | ||||||
|---|---|---|---|---|---|---|---|
| Quadrant | DetID | PixID | Counts | Sigma | Mean | Median | Sigma |
| A | 8 | 192 | 32665 | 195.98 | 821 | 807 | 162.6 |
| A | 13 | 254 | 12217 | 70.19 | 821 | 807 | 162.6 |
| A | 3 | 137 | 7998 | 44.24 | 821 | 807 | 162.6 |
| B | 6 | 159 | 1785794 | 11405.64 | 815 | 796 | 156.5 |
| B | 12 | 111 | 19358 | 118.61 | 815 | 796 | 156.5 |
| B | 11 | 111 | 17905 | 109.32 | 815 | 796 | 156.5 |
| C | 3 | 233 | 315540 | 1736.27 | 778 | 785 | 181.3 |
| C | 14 | 238 | 144676 | 793.74 | 778 | 785 | 181.3 |
| C | 15 | 208 | 28953 | 155.38 | 778 | 785 | 181.3 |
| D | 8 | 195 | 133687 | 723.75 | 780 | 764 | 183.7 |
| D | 7 | 80 | 56555 | 303.77 | 780 | 764 | 183.7 |
| D | 2 | 234 | 21361 | 112.15 | 780 | 764 | 183.7 |
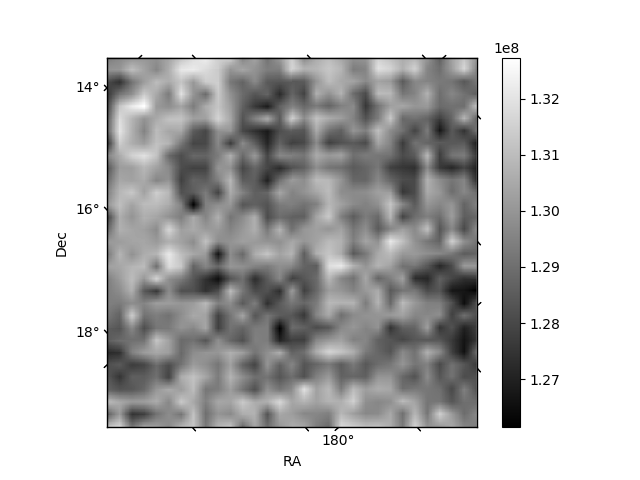
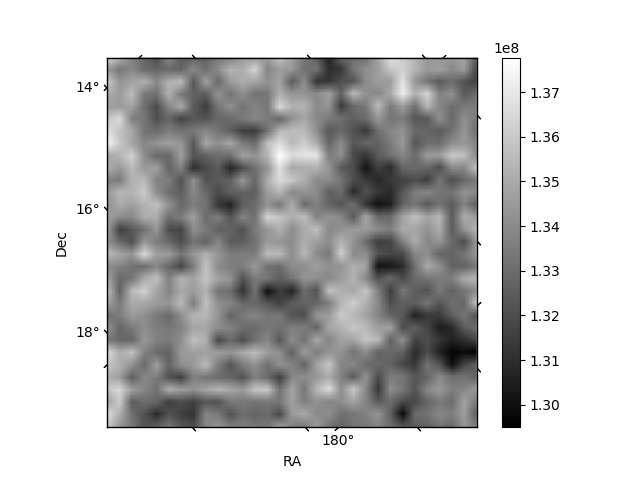
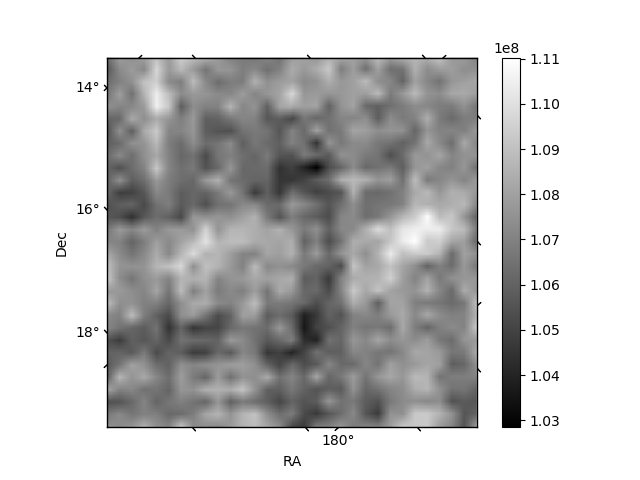
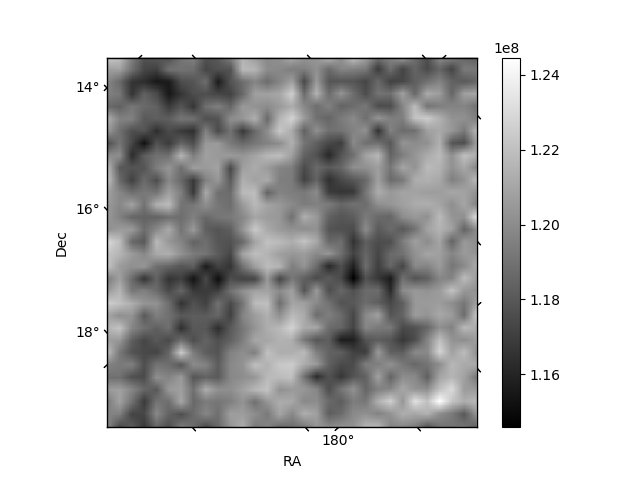
Histogram calculated using DETX and DETY for each event in the final _common_clean file
| Quadrant A | 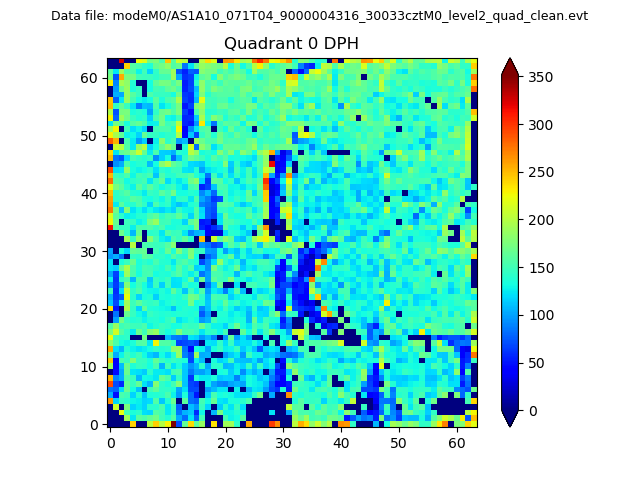 |
 |
Quadrant B |
|---|---|---|---|
| Quadrant D | 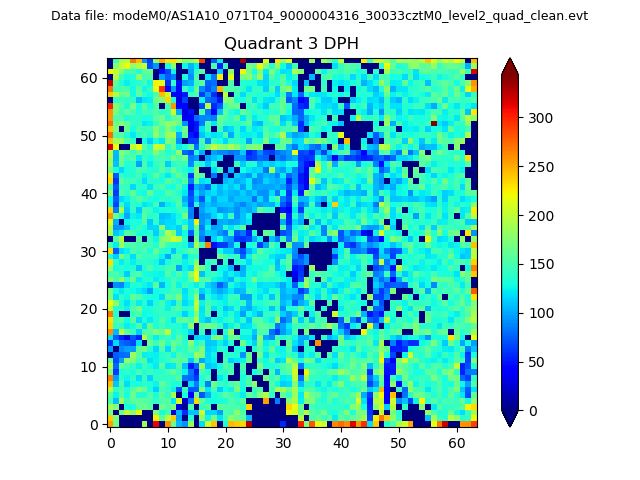 |
 |
Quadrant C |
| Plot type | Count rate plots | Images |
|---|---|---|
| Comparison with Poisson distribution Blue bars denote a histogram of data divided into 1 sec bins. Red curve is a Poisson curve with rate = median count rate of data. |
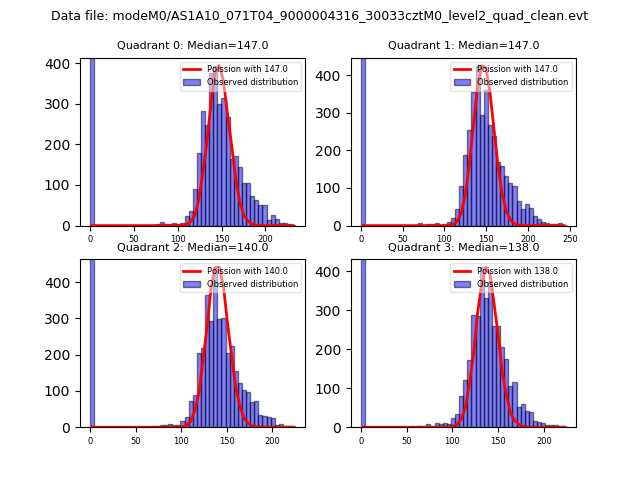 |
 |
| Quadrant-wise count rates Data is divided into 100 sec bins |
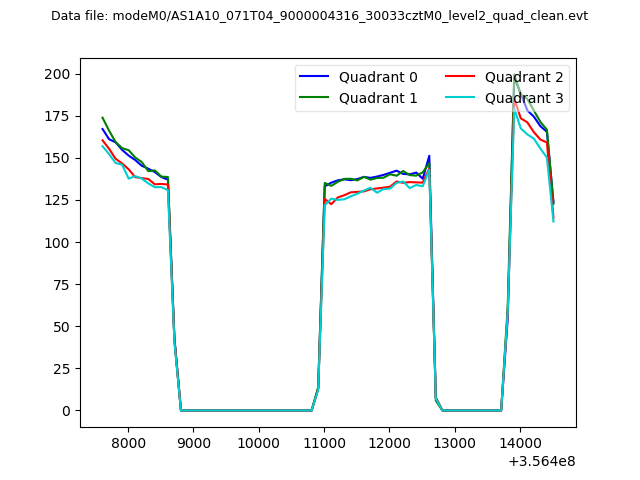 |
|
| Module-wise count rates for Quadrant A Data is divided into 100 sec bins |
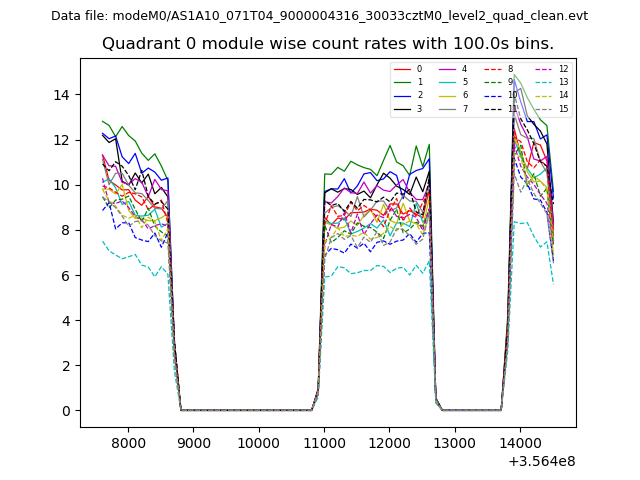 |
 |
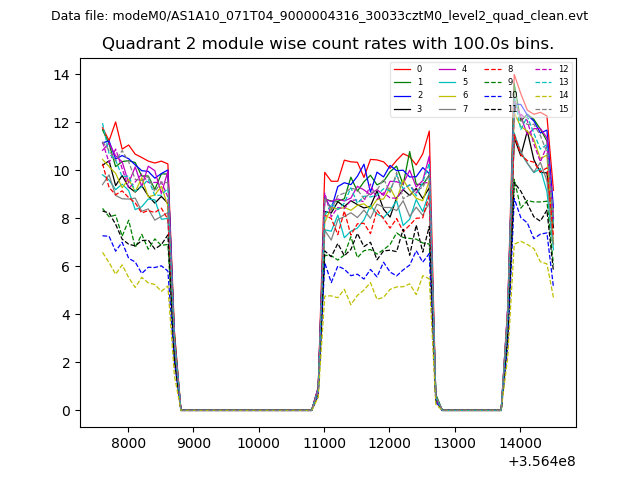
| Module-wise count rates for Quadrant B Data is divided into 100 sec bins |
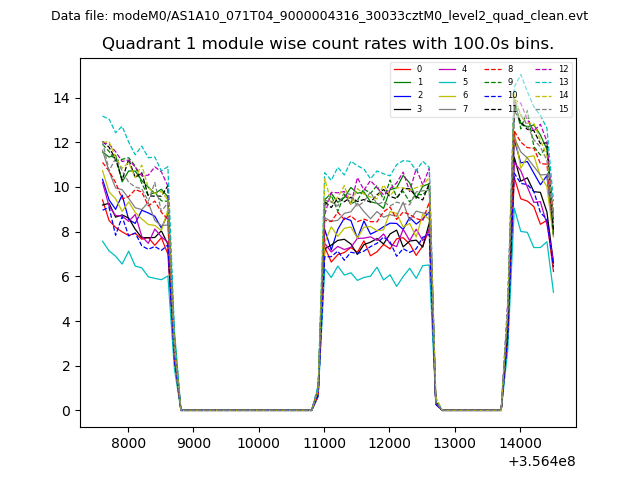 |
 |
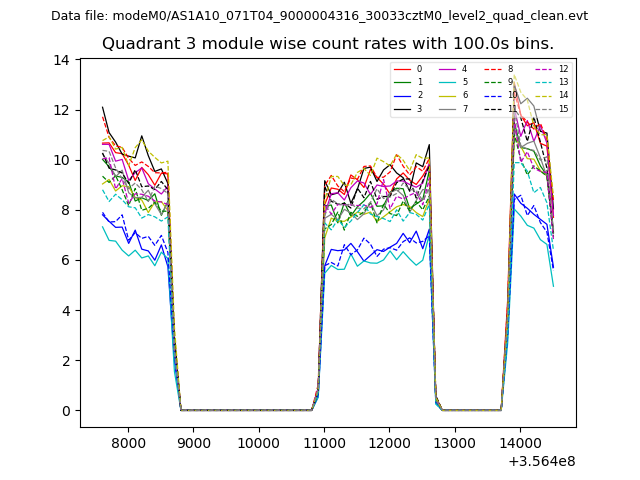
| Module-wise count rates for Quadrant C Data is divided into 100 sec bins |
 |
 |
| Module-wise count rates for Quadrant D Data is divided into 100 sec bins |
 |
 |
| Parameter | Plot |
|---|---|
| CZT HV Monitor | 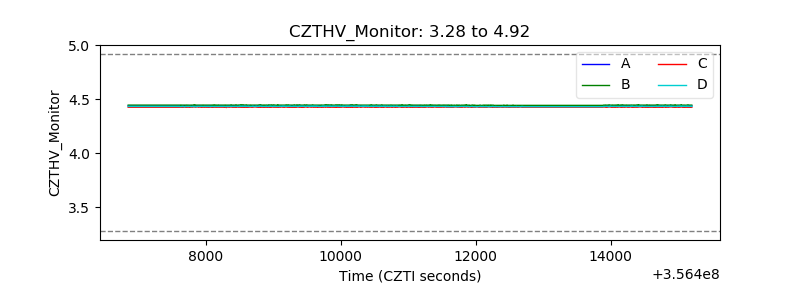 |
| D_VDD | 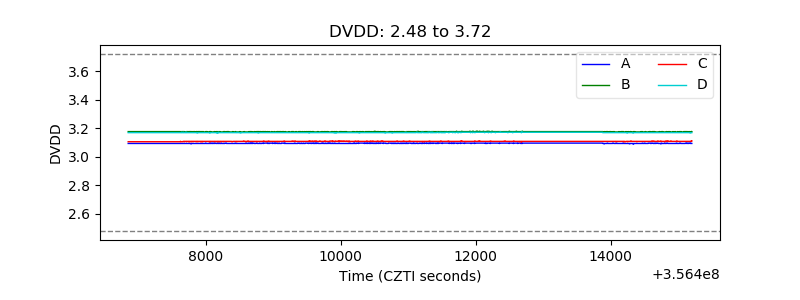 |
| Temperature 1 | 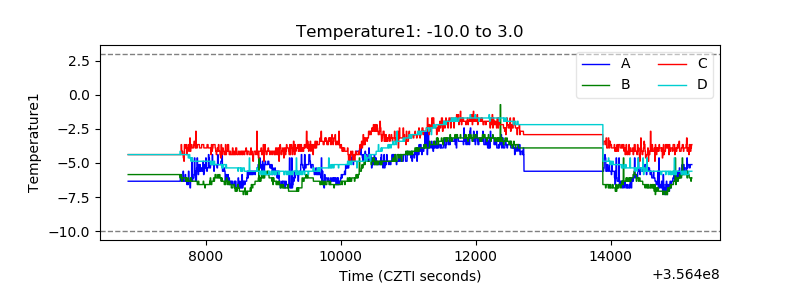 |
| Veto HV Monitor | 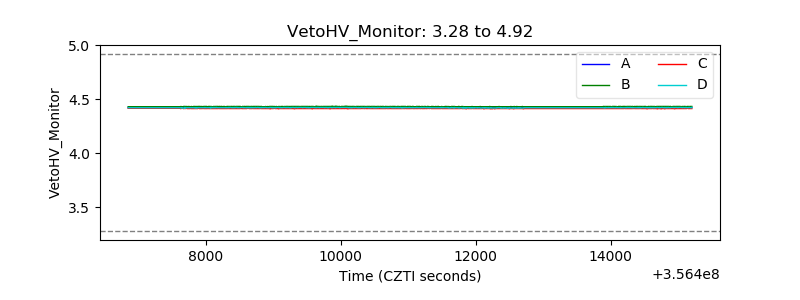 |
| Veto LLD | 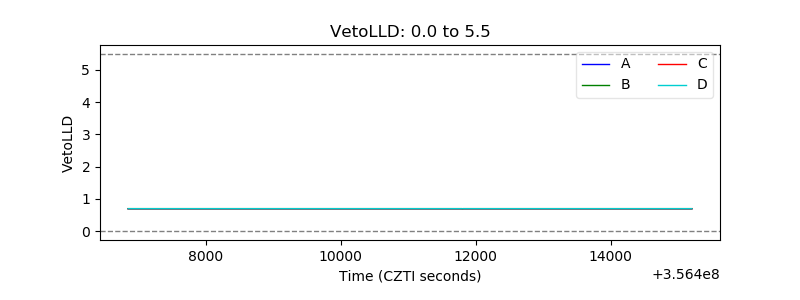 |
| Alpha Counter | 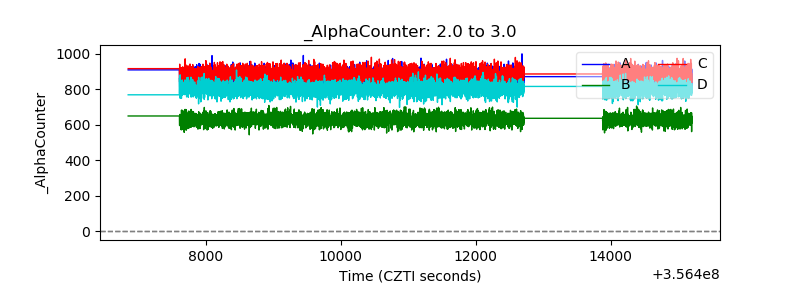 |
| _CPM_Rate | 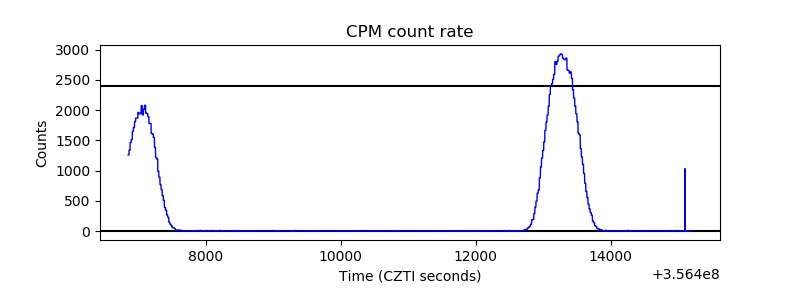 |
| CZT Counter | 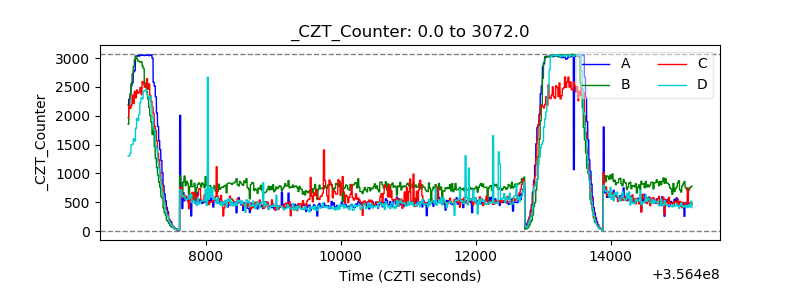 |
| +2.5 Volts monitor |  |
| +5 Volts monitor |  |
| _ROLL_ROT | 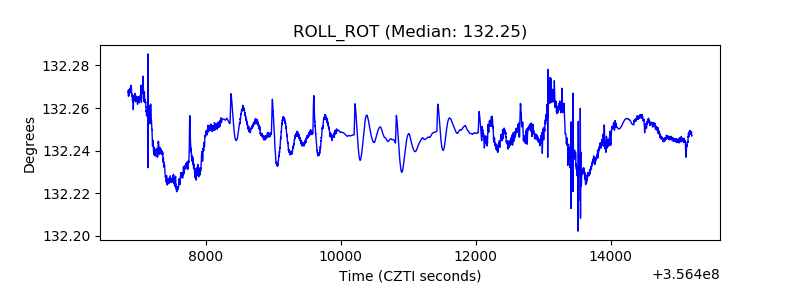 |
| _Roll_DEC | 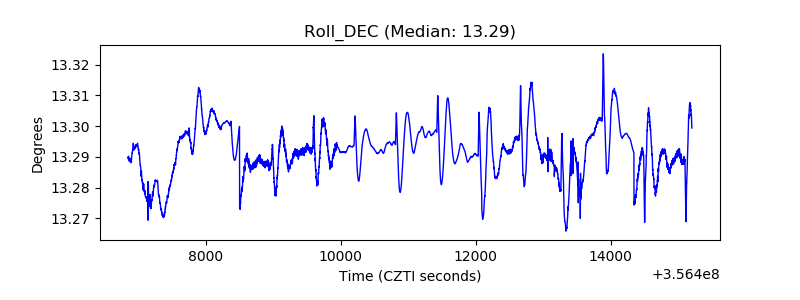 |
| _Roll_RA | 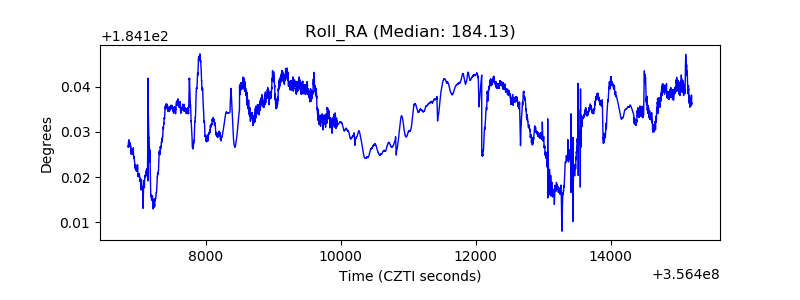 |
| Veto Counter | 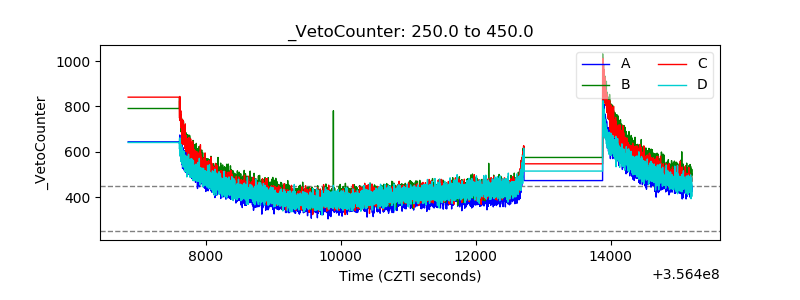 |