| Param | Original file | Final file |
|---|---|---|
| Filename | modeM0/AS1A10_071T04_9000004316_30035cztM0_level2.evt | modeM0/AS1A10_071T04_9000004316_30035cztM0_level2_quad_clean.evt |
| Size (bytes) | 523,350,720 | 67,340,160 |
| Size | 499.1 MB | 64.2 MB |
| Events in quadrant A | 3,416,411 | 413,831 |
| Events in quadrant B | 5,084,898 | 415,160 |
| Events in quadrant C | 3,458,338 | 389,453 |
| Events in quadrant D | 3,471,097 | 388,554 |
| Mode M9 | |||
|---|---|---|---|
| Quadrant | BADHDUFLAG | Total packets | Discarded packets |
| A | 0 | 17 | 0 |
| B | 0 | 18 | 0 |
| C | 0 | 18 | 0 |
| D | 0 | 18 | 0 |
| Mode SS | |||
|---|---|---|---|
| Quadrant | BADHDUFLAG | Total packets | Discarded packets |
| A | 0 | 126 | 0 |
| B | 0 | 126 | 0 |
| C | 0 | 126 | 0 |
| D | 0 | 126 | 0 |
| Mode M0 | |||
|---|---|---|---|
| Quadrant | BADHDUFLAG | Total packets | Discarded packets |
| A | 0 | 13709 | 2 |
| B | 0 | 19069 | 2 |
| C | 0 | 13787 | 4 |
| D | 0 | 13955 | 2 |
| Quadrant | Total seconds | Saturated seconds | Saturation percentage |
|---|---|---|---|
| A | 6193 | 66 | 1.065719% |
| B | 6193 | 120 | 1.937672% |
| C | 6192 | 153 | 2.470930% |
| D | 6192 | 61 | 0.985142% |
Noise dominated data is calculated using 1-second bins in cleaned event files. If a bin has >2000 counts, and if more than 50% of those come from <1% of pixels, then it is considered to be noise-dominated and hence unusable.
| Quadrant | # 1 sec bins | Bins with >0 counts | Bins with >2000 counts | High rate bins dominated by noise | Noise dominated (total time) | Noise dominated (detector-on time) | Marked lightcurve |
|---|---|---|---|---|---|---|---|
| A | 7473 | 6195 | 4 | 4 | 0.05% | 0.06% | 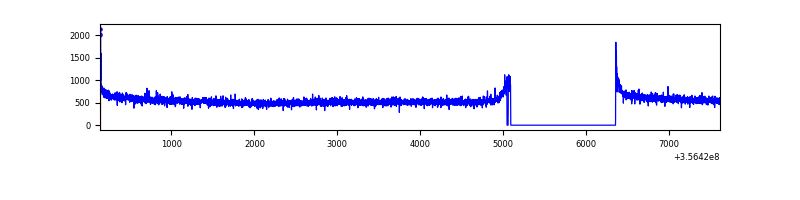 |
| B | 7473 | 6195 | 4 | 4 | 0.05% | 0.06% | 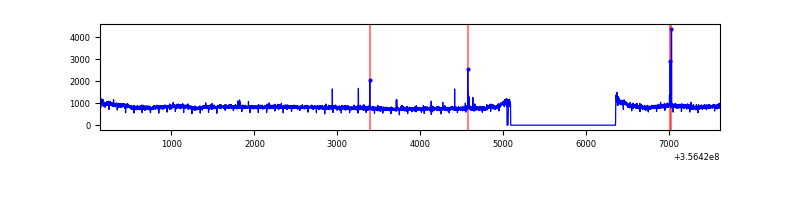 |
| C | 7472 | 6194 | 0 | 0 | 0.00% | 0.00% | 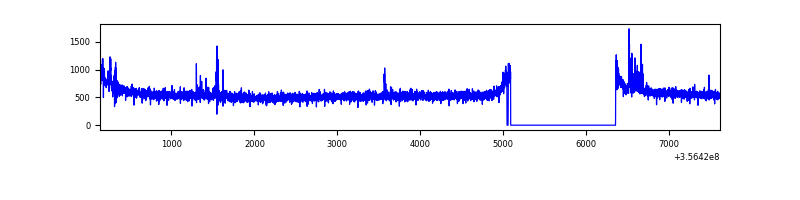 |
| D | 7472 | 6194 | 23 | 23 | 0.31% | 0.37% | 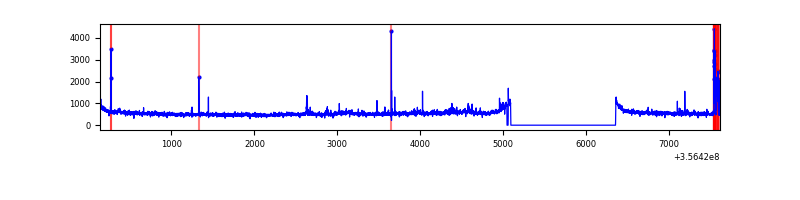 |
Top three noisy pixels from each quadrant. If the there are fewer than three noisy pixels in the level2.evt file, extra rows are filled as -1
| Pixel properties | Quadrant properties | ||||||
|---|---|---|---|---|---|---|---|
| Quadrant | DetID | PixID | Counts | Sigma | Mean | Median | Sigma |
| A | 8 | 192 | 23148 | 128.13 | 879 | 866 | 173.9 |
| A | 13 | 254 | 10681 | 56.44 | 879 | 866 | 173.9 |
| A | 3 | 137 | 8192 | 42.13 | 879 | 866 | 173.9 |
| B | 6 | 159 | 1650005 | 10082.04 | 868 | 847 | 163.6 |
| B | 10 | 247 | 30993 | 184.29 | 868 | 847 | 163.6 |
| B | 12 | 111 | 19321 | 112.94 | 868 | 847 | 163.6 |
| C | 14 | 238 | 153440 | 806.52 | 819 | 826 | 189.2 |
| C | 3 | 233 | 49075 | 254.98 | 819 | 826 | 189.2 |
| C | 15 | 208 | 30709 | 157.92 | 819 | 826 | 189.2 |
| D | 8 | 195 | 165079 | 849.57 | 827 | 811 | 193.4 |
| D | 7 | 80 | 151356 | 778.6 | 827 | 811 | 193.4 |
| D | 2 | 234 | 17933 | 88.55 | 827 | 811 | 193.4 |
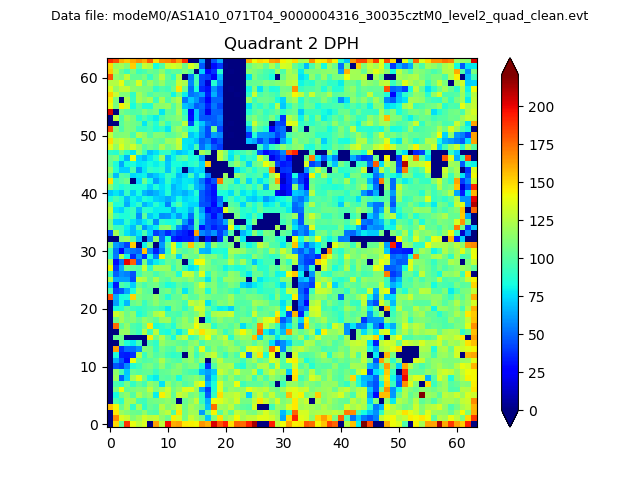
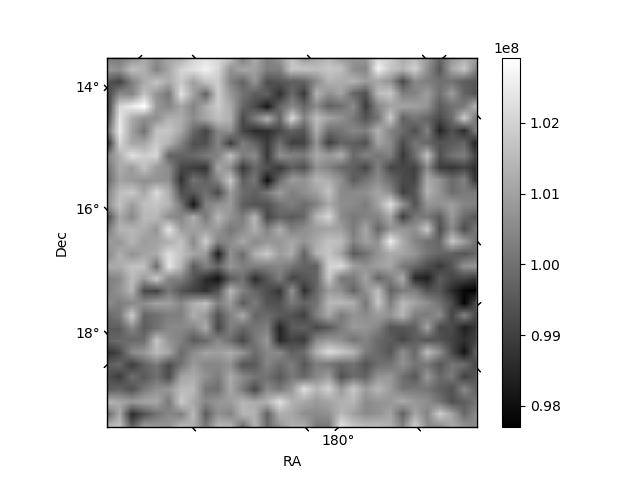
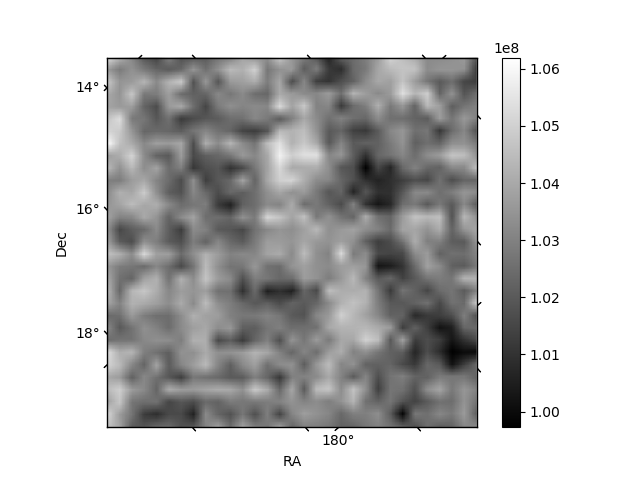
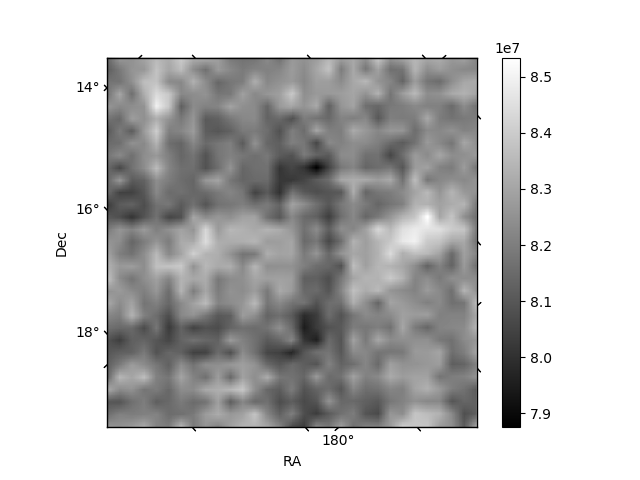
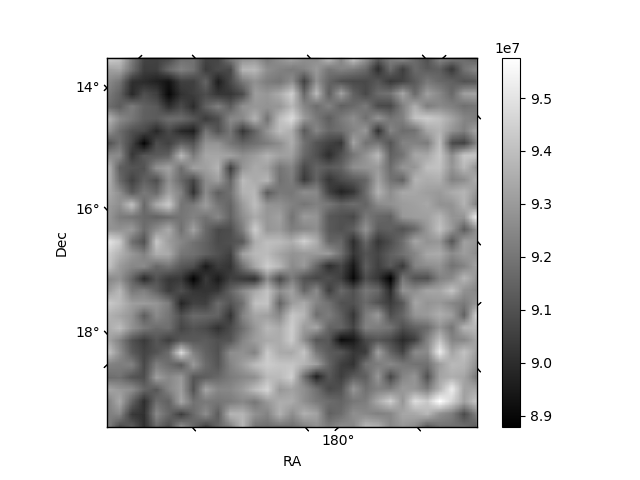
Histogram calculated using DETX and DETY for each event in the final _common_clean file
| Quadrant A | 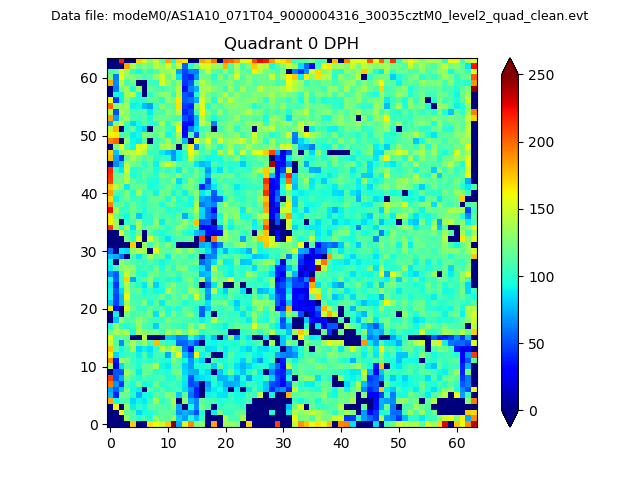 |
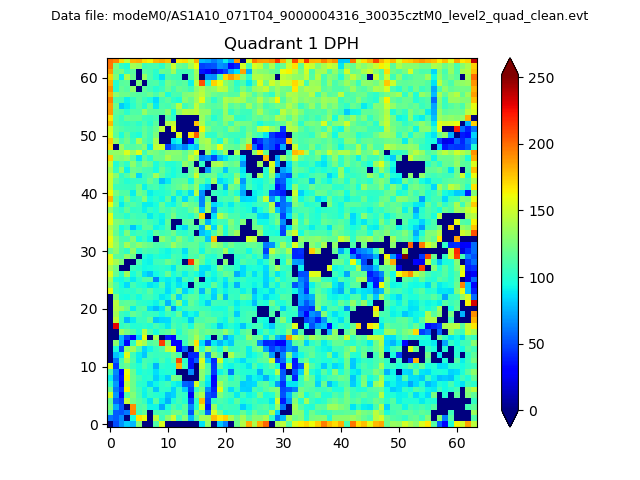 |
Quadrant B |
|---|---|---|---|
| Quadrant D | 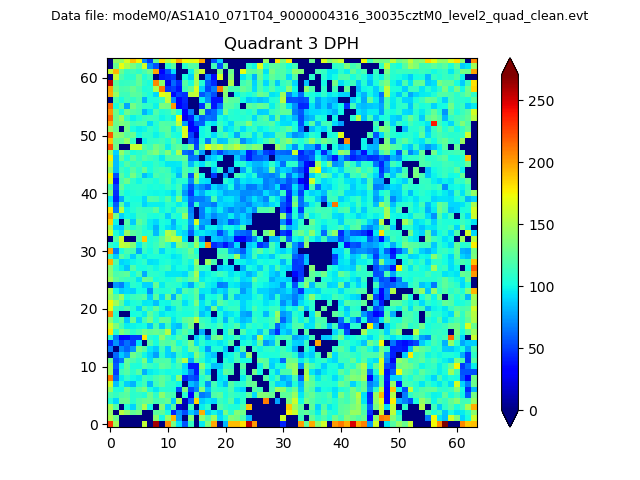 |
 |
Quadrant C |
| Plot type | Count rate plots | Images |
|---|---|---|
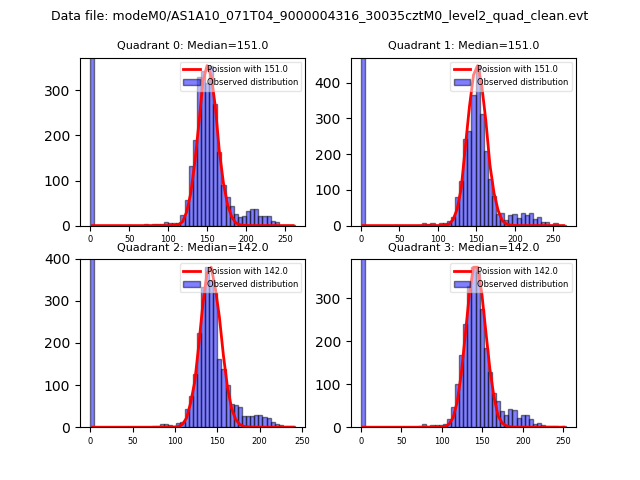
| Comparison with Poisson distribution Blue bars denote a histogram of data divided into 1 sec bins. Red curve is a Poisson curve with rate = median count rate of data. |
 |
 |
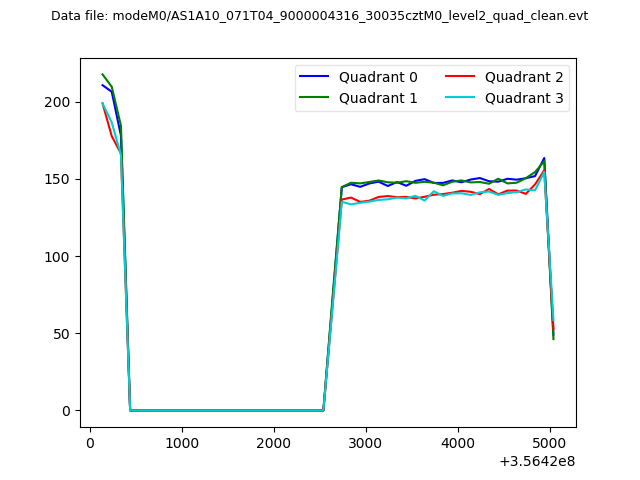
| Quadrant-wise count rates Data is divided into 100 sec bins |
 |
|
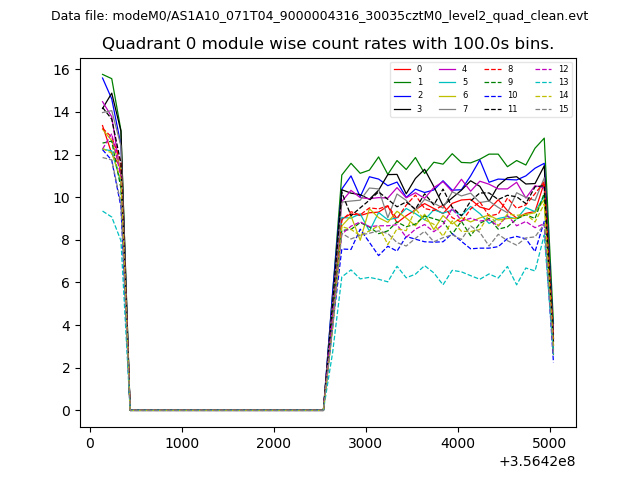
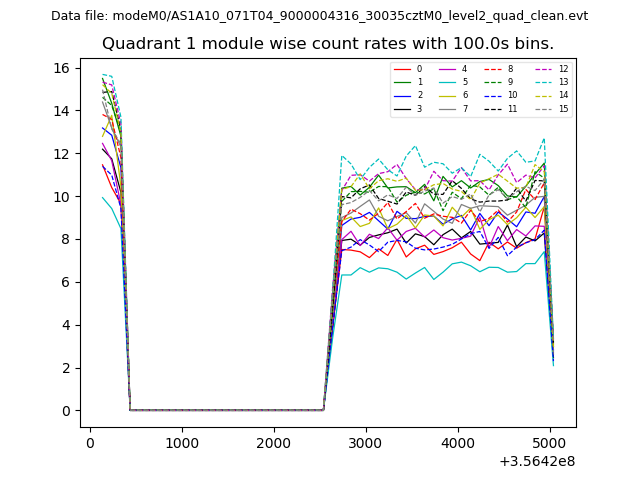
| Module-wise count rates for Quadrant A Data is divided into 100 sec bins |
 |
 |
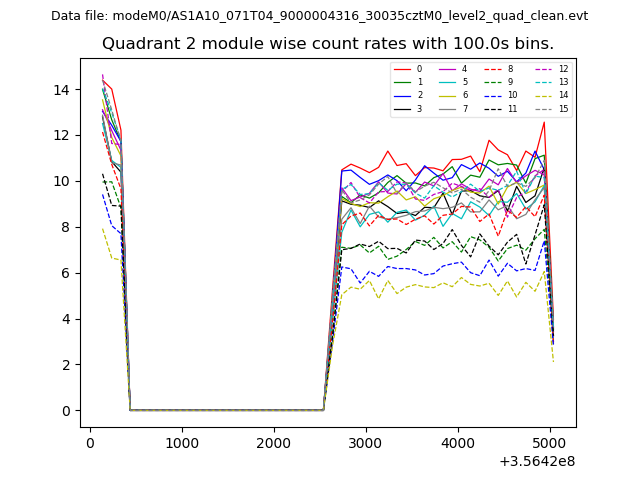
| Module-wise count rates for Quadrant B Data is divided into 100 sec bins |
 |
 |
| Module-wise count rates for Quadrant C Data is divided into 100 sec bins |
 |
 |
| Module-wise count rates for Quadrant D Data is divided into 100 sec bins |
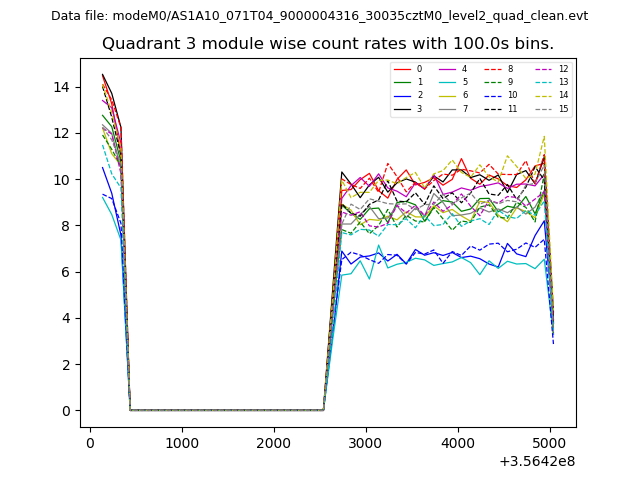 |
 |
| Parameter | Plot |
|---|---|
| CZT HV Monitor | 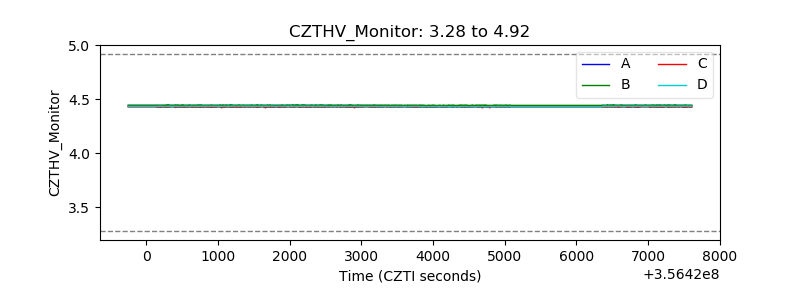 |
| D_VDD | 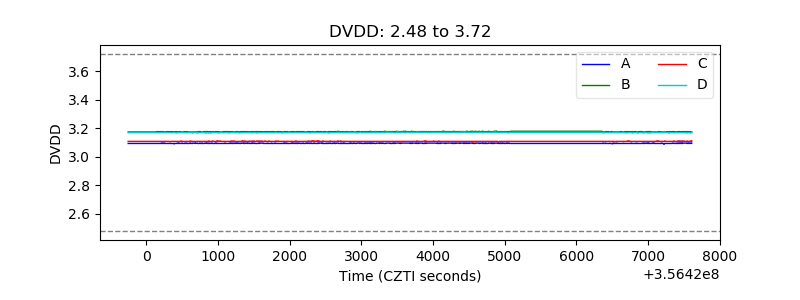 |
| Temperature 1 | 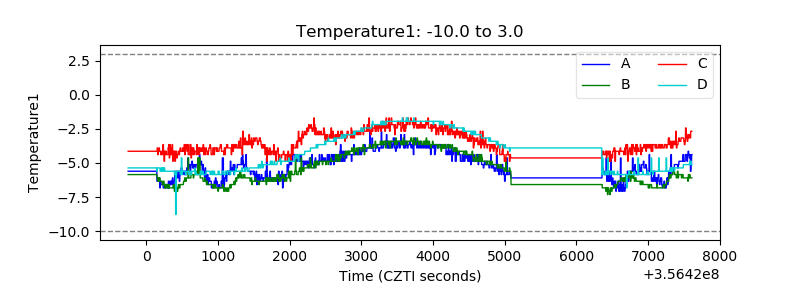 |
| Veto HV Monitor | 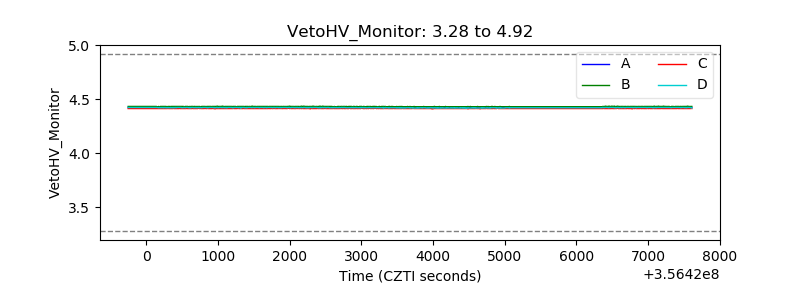 |
| Veto LLD | 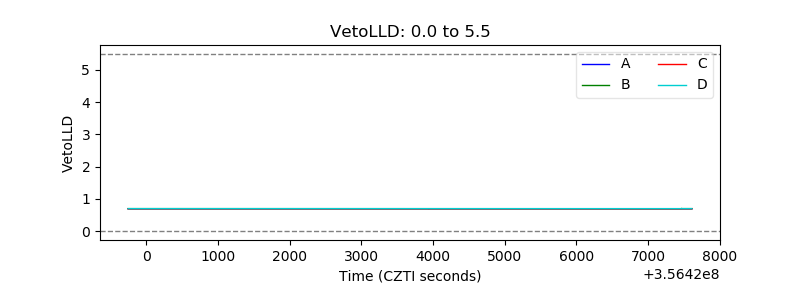 |
| Alpha Counter | 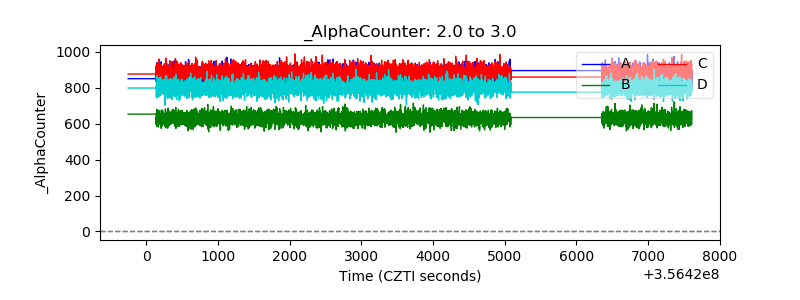 |
| _CPM_Rate | 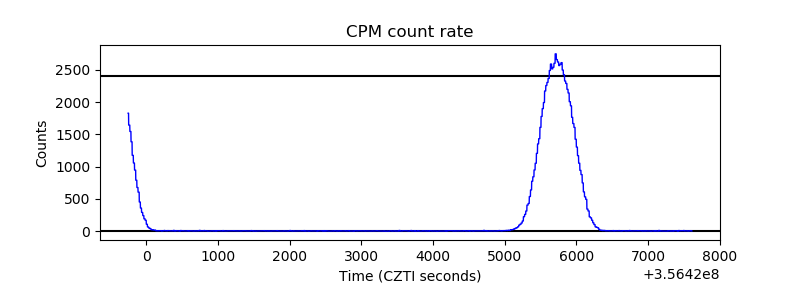 |
| CZT Counter | 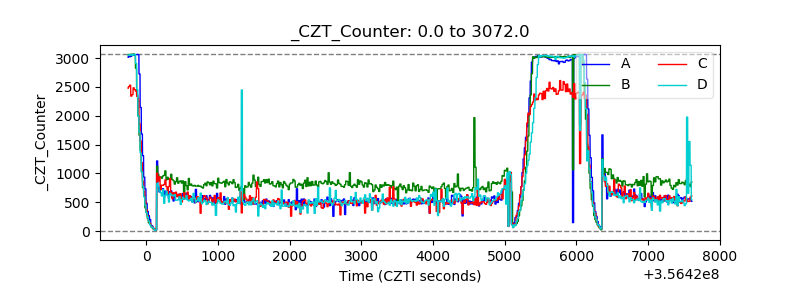 |
| +2.5 Volts monitor |  |
| +5 Volts monitor |  |
| _ROLL_ROT | 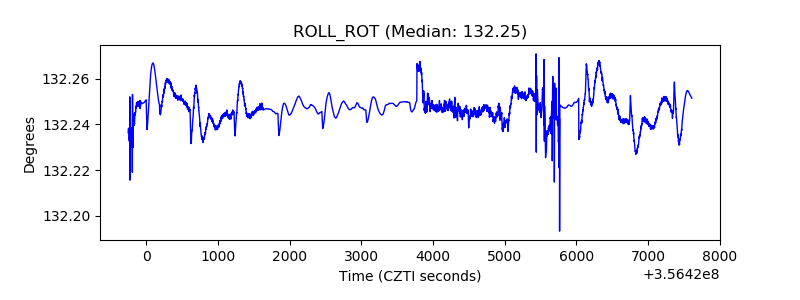 |
| _Roll_DEC | 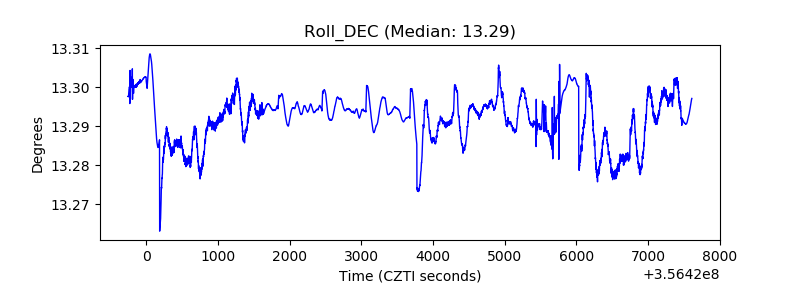 |
| _Roll_RA | 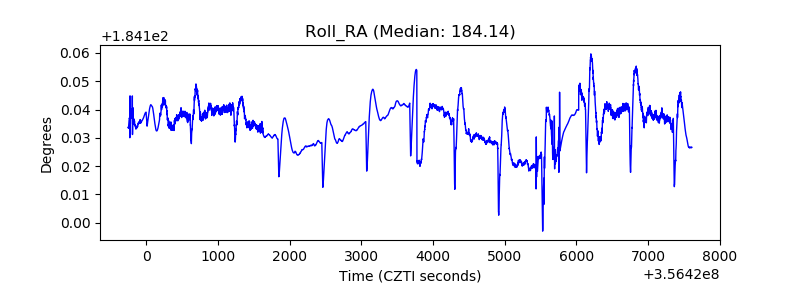 |
| Veto Counter | 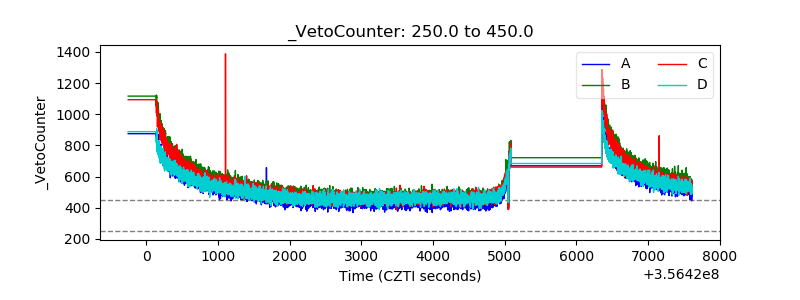 |