| Param | Original file | Final file |
|---|---|---|
| Filename | modeM0/AS1A10_071T04_9000004316_30037cztM0_level2.evt | modeM0/AS1A10_071T04_9000004316_30037cztM0_level2_quad_clean.evt |
| Size (bytes) | 557,553,600 | 84,525,120 |
| Size | 531.7 MB | 80.6 MB |
| Events in quadrant A | 3,661,411 | 539,957 |
| Events in quadrant B | 5,531,995 | 533,870 |
| Events in quadrant C | 3,666,641 | 506,148 |
| Events in quadrant D | 3,566,388 | 507,107 |
| Mode M9 | |||
|---|---|---|---|
| Quadrant | BADHDUFLAG | Total packets | Discarded packets |
| A | 0 | 12 | 0 |
| B | 0 | 12 | 0 |
| C | 0 | 12 | 0 |
| D | 0 | 12 | 0 |
| Mode SS | |||
|---|---|---|---|
| Quadrant | BADHDUFLAG | Total packets | Discarded packets |
| A | 0 | 136 | 0 |
| B | 0 | 136 | 0 |
| C | 0 | 136 | 0 |
| D | 0 | 136 | 0 |
| Mode M0 | |||
|---|---|---|---|
| Quadrant | BADHDUFLAG | Total packets | Discarded packets |
| A | 0 | 14718 | 2 |
| B | 0 | 20824 | 2 |
| C | 0 | 14663 | 2 |
| D | 0 | 14479 | 2 |
| Quadrant | Total seconds | Saturated seconds | Saturation percentage |
|---|---|---|---|
| A | 6782 | 144 | 2.123267% |
| B | 6783 | 223 | 3.287631% |
| C | 6783 | 197 | 2.904320% |
| D | 6783 | 95 | 1.400560% |
Noise dominated data is calculated using 1-second bins in cleaned event files. If a bin has >2000 counts, and if more than 50% of those come from <1% of pixels, then it is considered to be noise-dominated and hence unusable.
| Quadrant | # 1 sec bins | Bins with >0 counts | Bins with >2000 counts | High rate bins dominated by noise | Noise dominated (total time) | Noise dominated (detector-on time) | Marked lightcurve |
|---|---|---|---|---|---|---|---|
| A | 7927 | 6783 | 0 | 0 | 0.00% | 0.00% | 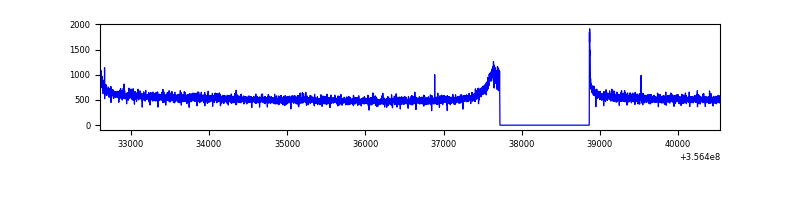 |
| B | 7928 | 6784 | 1 | 1 | 0.01% | 0.01% | 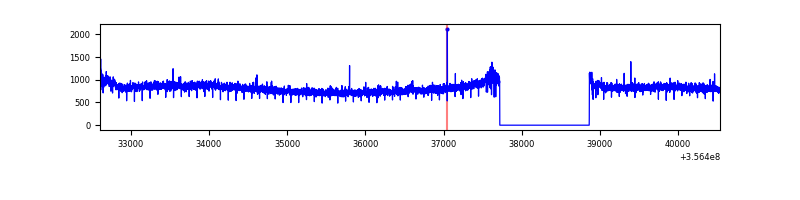 |
| C | 7928 | 6784 | 0 | 0 | 0.00% | 0.00% | 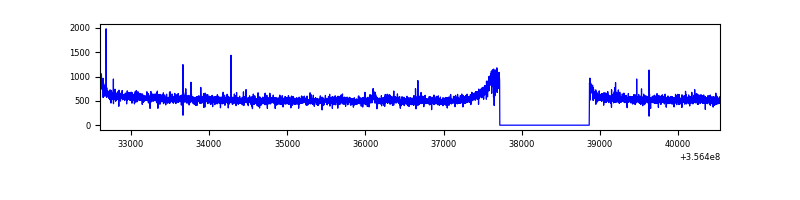 |
| D | 7928 | 6784 | 2 | 2 | 0.03% | 0.03% | 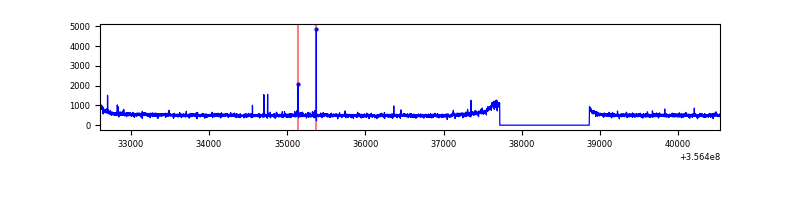 |
Top three noisy pixels from each quadrant. If the there are fewer than three noisy pixels in the level2.evt file, extra rows are filled as -1
| Pixel properties | Quadrant properties | ||||||
|---|---|---|---|---|---|---|---|
| Quadrant | DetID | PixID | Counts | Sigma | Mean | Median | Sigma |
| A | 8 | 192 | 13378 | 66.24 | 946 | 929 | 188.0 |
| A | 13 | 254 | 11710 | 57.36 | 946 | 929 | 188.0 |
| A | 3 | 137 | 9047 | 43.19 | 946 | 929 | 188.0 |
| B | 6 | 159 | 1888937 | 10821.12 | 922 | 901 | 174.5 |
| B | 12 | 111 | 21591 | 118.58 | 922 | 901 | 174.5 |
| B | 11 | 111 | 19994 | 109.43 | 922 | 901 | 174.5 |
| C | 14 | 238 | 149395 | 714.68 | 886 | 894 | 207.8 |
| C | 3 | 233 | 45783 | 216.03 | 886 | 894 | 207.8 |
| C | 2 | 114 | 15787 | 71.67 | 886 | 894 | 207.8 |
| D | 8 | 195 | 117500 | 548.61 | 901 | 884 | 212.6 |
| D | 2 | 234 | 22519 | 101.78 | 901 | 884 | 212.6 |
| D | 2 | 250 | 20771 | 93.56 | 901 | 884 | 212.6 |
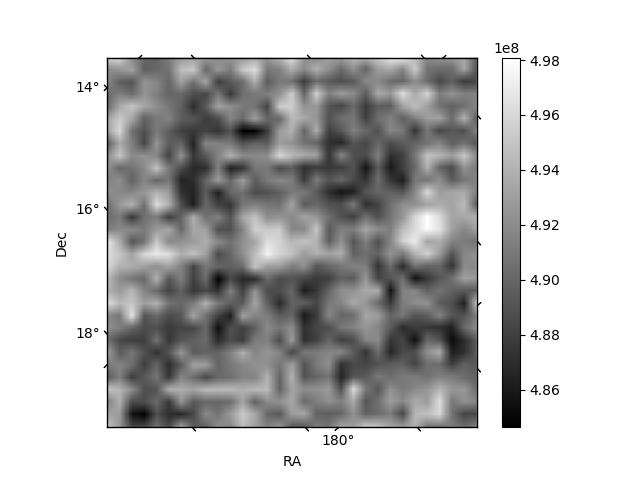
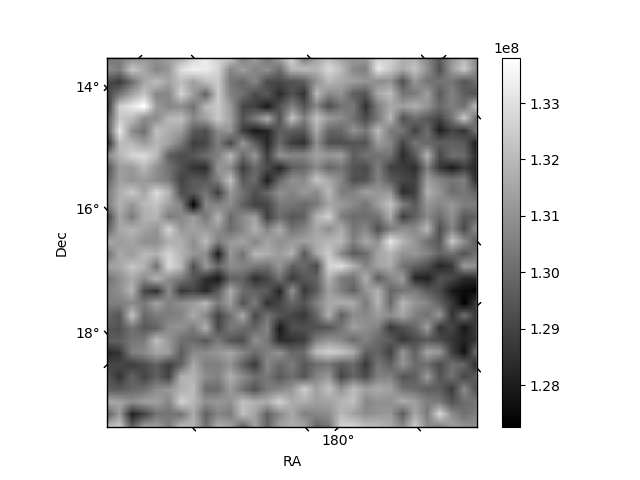
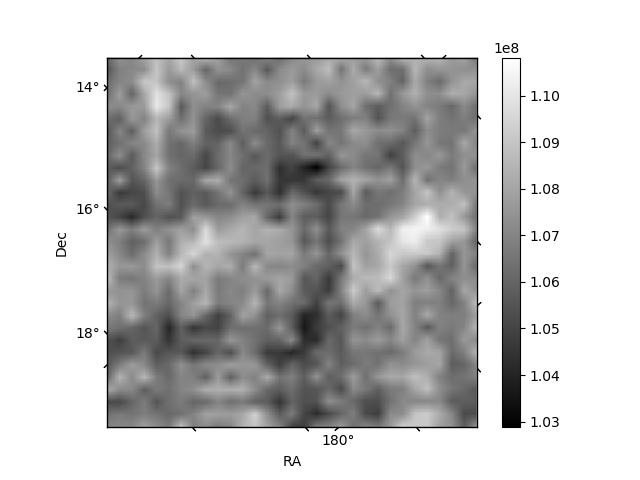
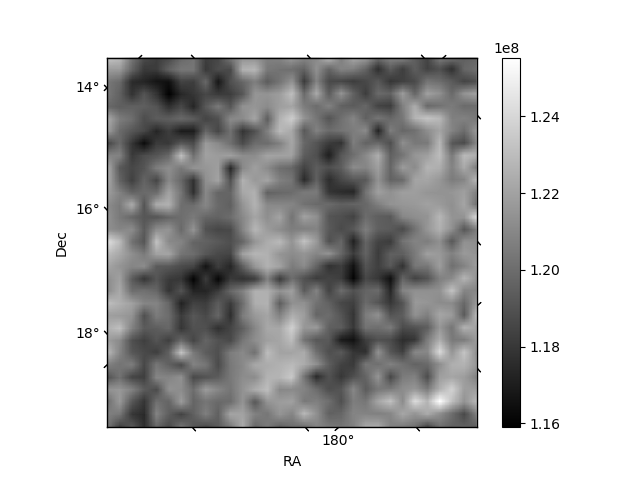
Histogram calculated using DETX and DETY for each event in the final _common_clean file
| Quadrant A | 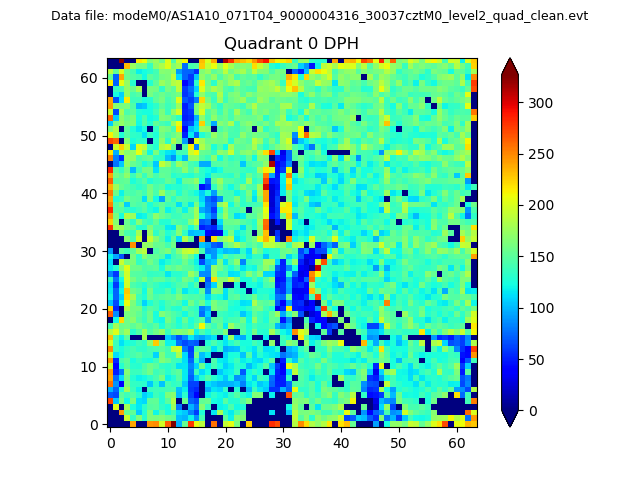 |
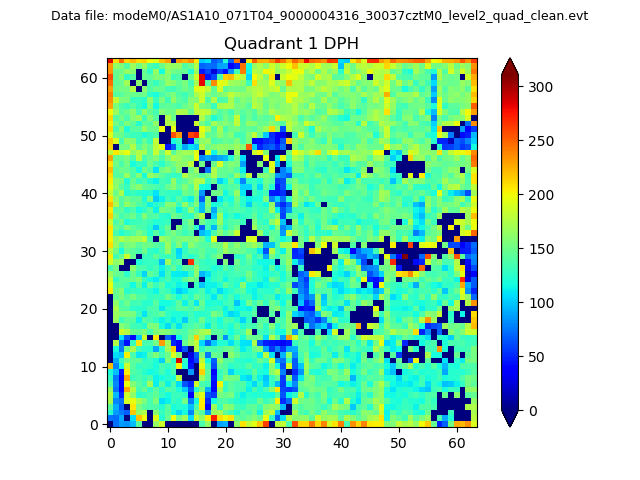 |
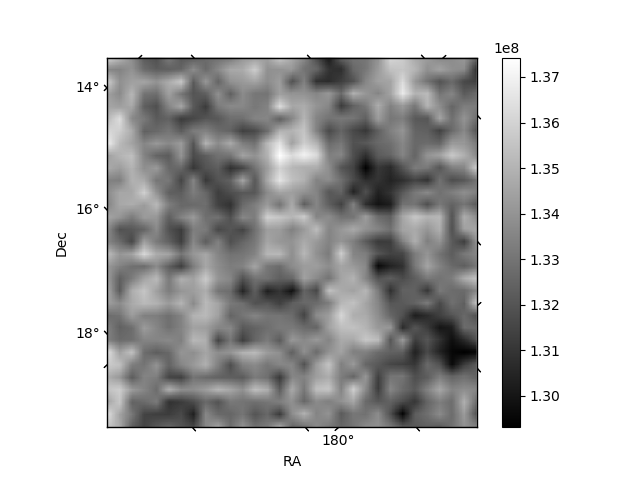
Quadrant B |
|---|---|---|---|
| Quadrant D | 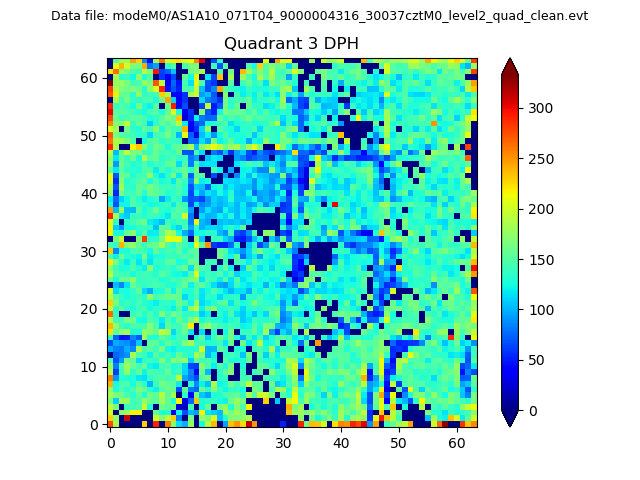 |
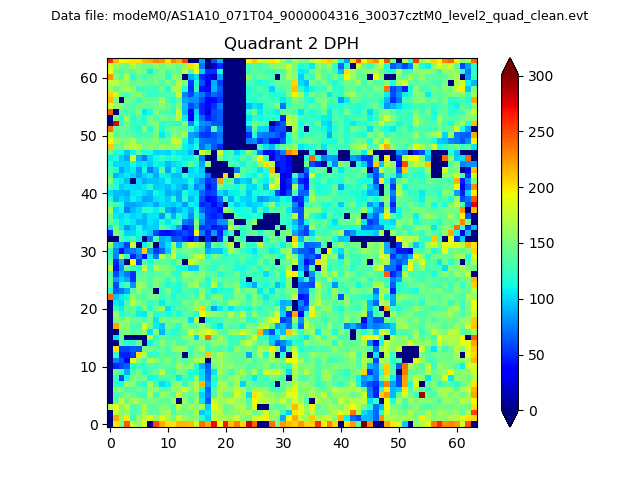 |
Quadrant C |
| Plot type | Count rate plots | Images |
|---|---|---|
| Comparison with Poisson distribution Blue bars denote a histogram of data divided into 1 sec bins. Red curve is a Poisson curve with rate = median count rate of data. |
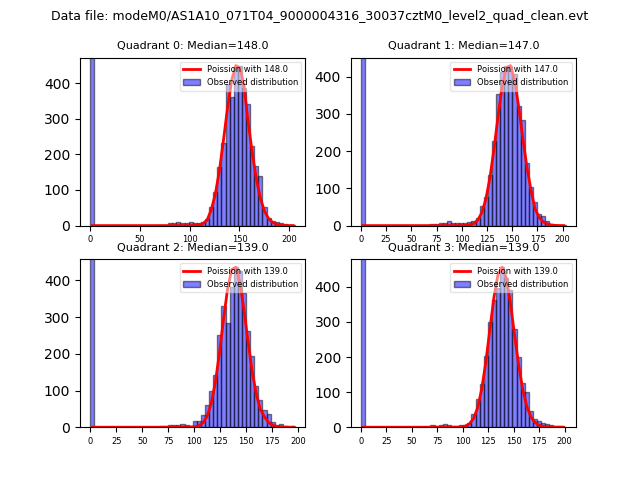 |
 |
| Quadrant-wise count rates Data is divided into 100 sec bins |
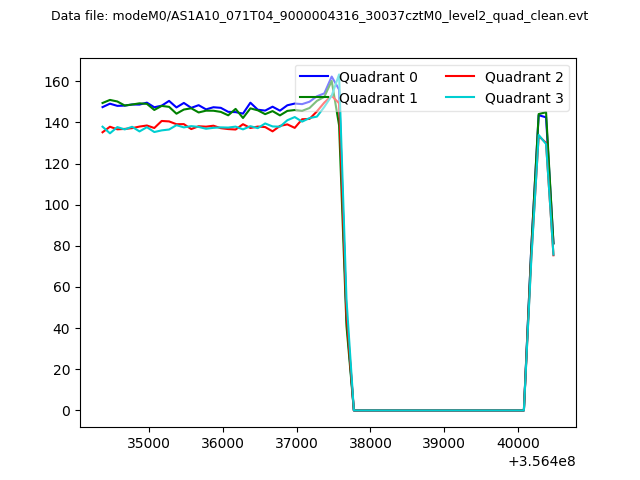 |
|
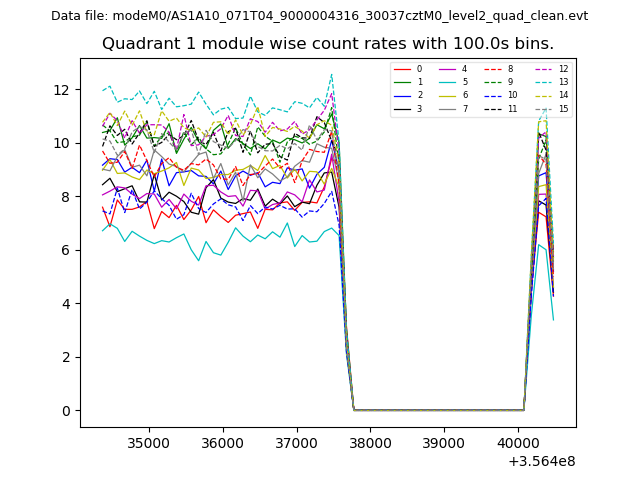
| Module-wise count rates for Quadrant A Data is divided into 100 sec bins |
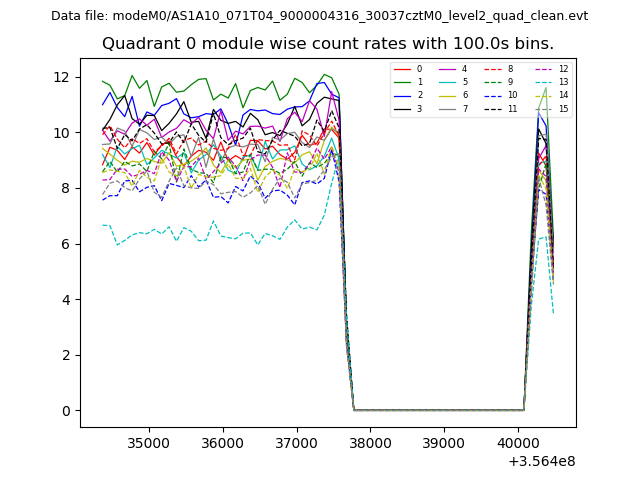 |
 |
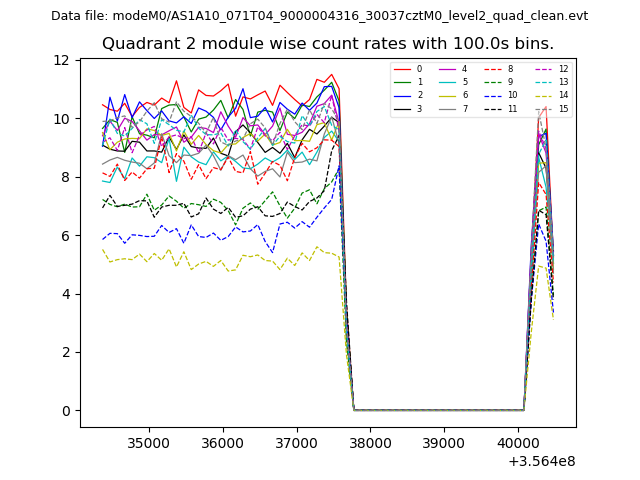
| Module-wise count rates for Quadrant B Data is divided into 100 sec bins |
 |
 |
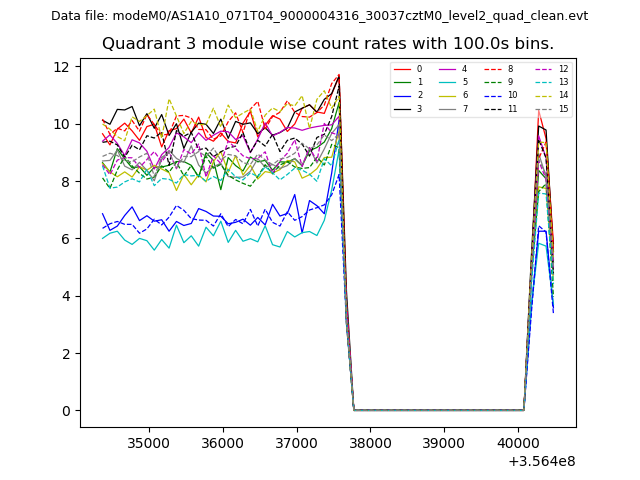
| Module-wise count rates for Quadrant C Data is divided into 100 sec bins |
 |
 |
| Module-wise count rates for Quadrant D Data is divided into 100 sec bins |
 |
 |
| Parameter | Plot |
|---|---|
| CZT HV Monitor | 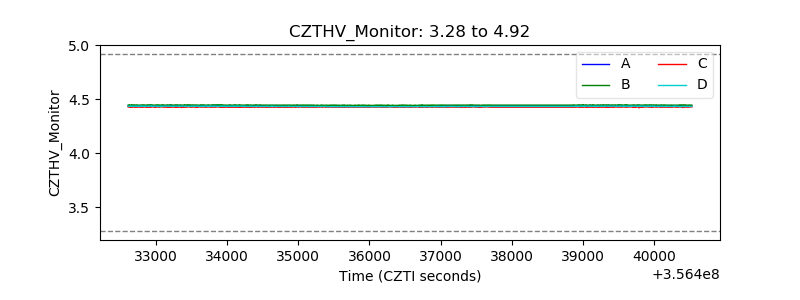 |
| D_VDD | 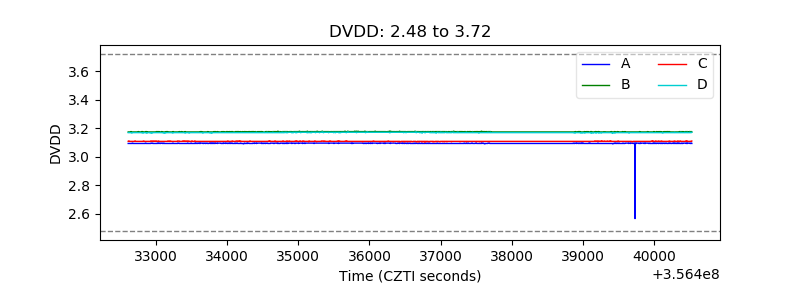 |
| Temperature 1 | 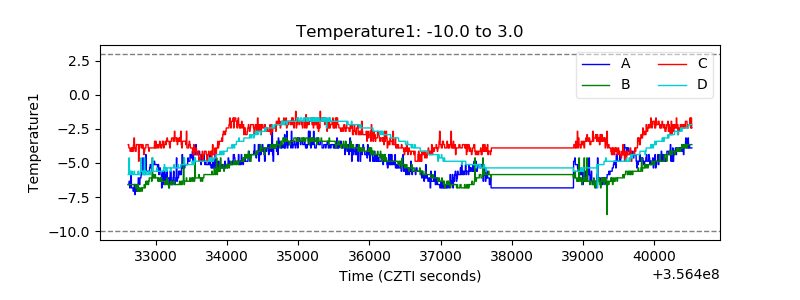 |
| Veto HV Monitor | 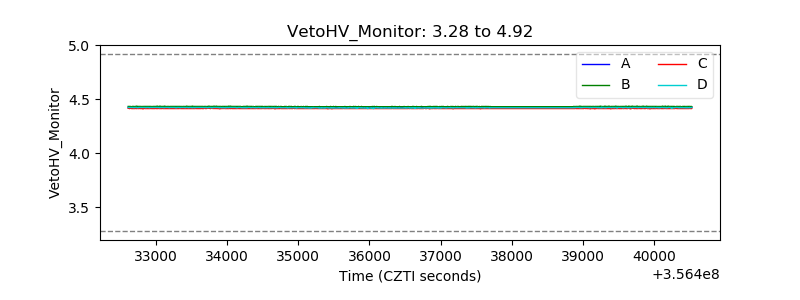 |
| Veto LLD | 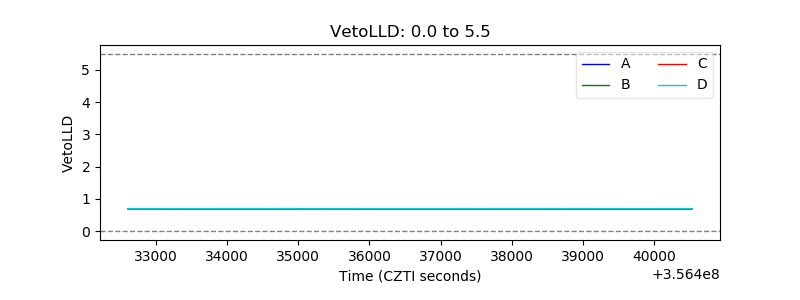 |
| Alpha Counter | 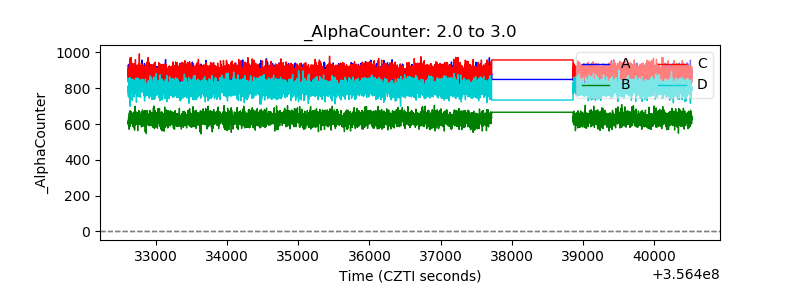 |
| _CPM_Rate | 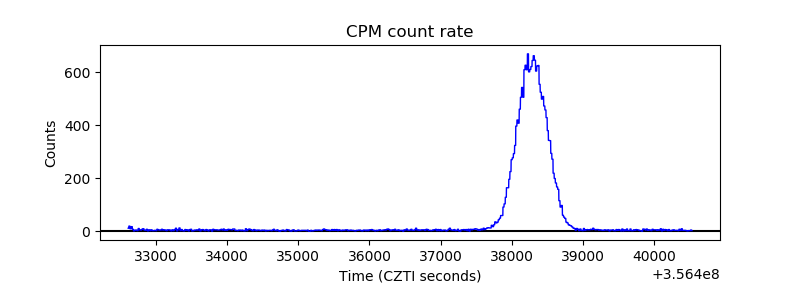 |
| CZT Counter | 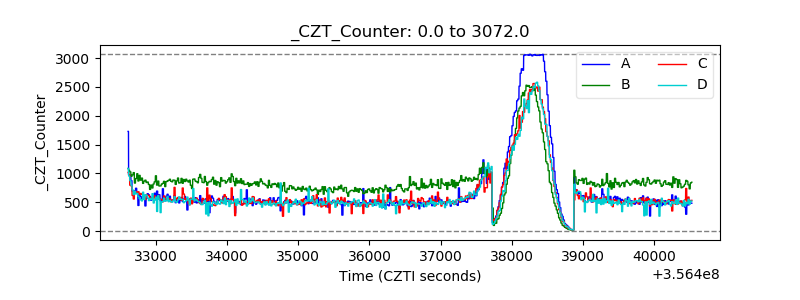 |
| +2.5 Volts monitor |  |
| +5 Volts monitor |  |
| _ROLL_ROT | 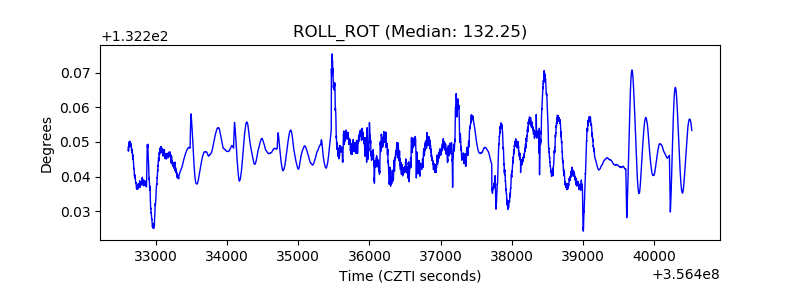 |
| _Roll_DEC | 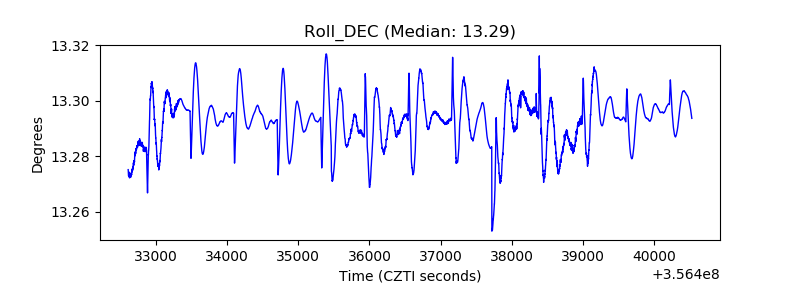 |
| _Roll_RA | 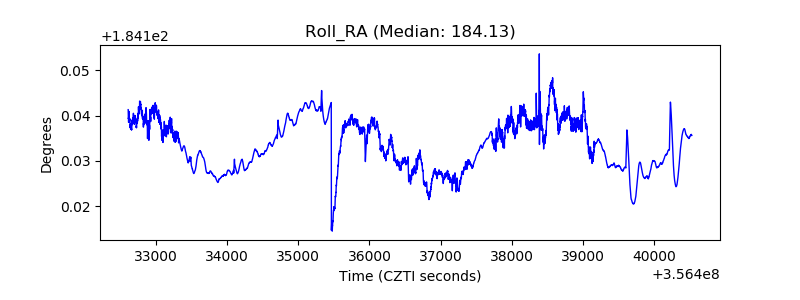 |
| Veto Counter | 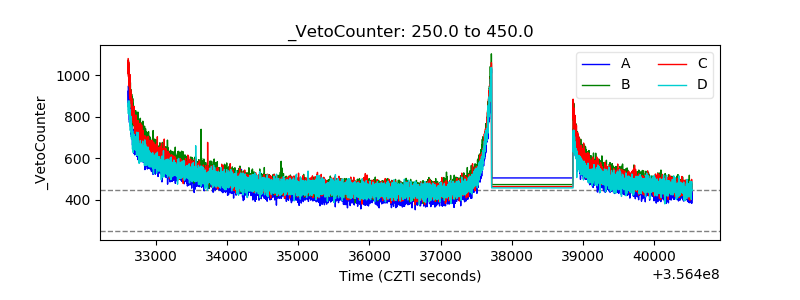 |