| Param | Original file | Final file |
|---|---|---|
| Filename | modeM0/AS1A10_071T09_9000004320cztM0_level2.fits | modeM0/AS1A10_071T09_9000004320cztM0_level2_quad_clean.evt |
| Size (bytes) | 590,500,800 | 449,830,080 |
| Size | 563.1 MB | 429.0 MB |
| Events in quadrant A | 3,744,200 | 2,561,004 |
| Events in quadrant B | 3,496,072 | 2,524,101 |
| Events in quadrant C | 3,536,168 | 2,366,138 |
| Events in quadrant D | 3,152,640 | 2,214,474 |
| Mode SS | |||
|---|---|---|---|
| Quadrant | BADHDUFLAG | Total packets | Discarded packets |
| A | 0 | 1180 | 0 |
| B | 0 | 1180 | 0 |
| C | 0 | 1180 | 0 |
| D | 0 | 1180 | 0 |
| Mode M0 | |||
|---|---|---|---|
| Quadrant | BADHDUFLAG | Total packets | Discarded packets |
| A | 0 | 120406 | 0 |
| B | 0 | 175013 | 0 |
| C | 0 | 122945 | 0 |
| D | 0 | 122684 | 0 |
| Mode M9 | |||
|---|---|---|---|
| Quadrant | BADHDUFLAG | Total packets | Discarded packets |
| A | 0 | 104 | 0 |
| B | 0 | 104 | 0 |
| C | 0 | 104 | 0 |
| D | 0 | 104 | 0 |
| Quadrant | Total seconds | Saturated seconds | Saturation percentage |
|---|---|---|---|
| A | 57634 | 662 | 1.148628% |
| B | 57634 | 1164 | 2.019641% |
| C | 57634 | 1333 | 2.312871% |
| D | 57634 | 427 | 0.740882% |
Noise dominated data is calculated using 1-second bins in cleaned event files. If a bin has >2000 counts, and if more than 50% of those come from <1% of pixels, then it is considered to be noise-dominated and hence unusable.
| Quadrant | # 1 sec bins | Bins with >0 counts | Bins with >2000 counts | High rate bins dominated by noise | Noise dominated (total time) | Noise dominated (detector-on time) | Marked lightcurve |
|---|---|---|---|---|---|---|---|
| A | 68279 | 57634 | 0 | 0 | 0.00% | 0.00% |  |
| B | 68279 | 57634 | 0 | 0 | 0.00% | 0.00% |  |
| C | 68279 | 57619 | 0 | 0 | 0.00% | 0.00% |  |
| D | 68279 | 57634 | 0 | 0 | 0.00% | 0.00% |  |
Top three noisy pixels from each quadrant. If the there are fewer than three noisy pixels in the level2.evt file, extra rows are filled as -1
| Pixel properties | Quadrant properties | ||||||
|---|---|---|---|---|---|---|---|
| Quadrant | DetID | PixID | Counts | Sigma | Mean | Median | Sigma |
| A | 0 | 29 | 3523 | 11.02 | 974 | 916 | 236.6 |
| A | 7 | 110 | 2867 | 8.25 | 974 | 916 | 236.6 |
| A | 9 | 19 | 2767 | 7.82 | 974 | 916 | 236.6 |
| B | 2 | 9 | 2848 | 10.61 | 925 | 883 | 185.2 |
| B | 2 | 8 | 2359 | 7.97 | 925 | 883 | 185.2 |
| B | 5 | 225 | 2271 | 7.49 | 925 | 883 | 185.2 |
| C | 1 | 81 | 2701 | 7.67 | 934 | 876 | 237.9 |
| C | 1 | 80 | 2690 | 7.63 | 934 | 876 | 237.9 |
| C | 3 | 202 | 2672 | 7.55 | 934 | 876 | 237.9 |
| D | 15 | 46 | 2369 | 6.48 | 900 | 820 | 238.9 |
| D | 6 | 67 | 2218 | 5.85 | 900 | 820 | 238.9 |
| D | 10 | 189 | 2191 | 5.74 | 900 | 820 | 238.9 |
Histogram calculated using DETX and DETY for each event in the final _common_clean file
| Quadrant A | 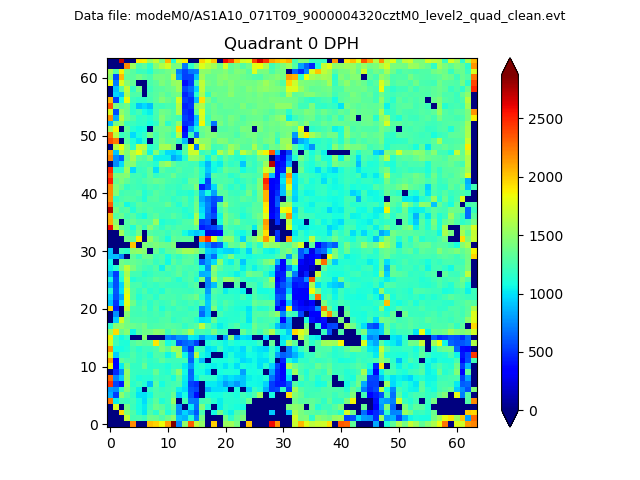 |
 |
Quadrant B |
|---|---|---|---|
| Quadrant D |  |
 |
Quadrant C |
| Plot type | Count rate plots | Images |
|---|---|---|
| Comparison with Poisson distribution Blue bars denote a histogram of data divided into 1 sec bins. Red curve is a Poisson curve with rate = median count rate of data. |
 |
 |
| Quadrant-wise count rates Data is divided into 100 sec bins |
 |
|
| Module-wise count rates for Quadrant A Data is divided into 100 sec bins |
 |
 |
| Module-wise count rates for Quadrant B Data is divided into 100 sec bins |
 |
 |
| Module-wise count rates for Quadrant C Data is divided into 100 sec bins |
 |
 |
| Module-wise count rates for Quadrant D Data is divided into 100 sec bins |
 |
 |
| Parameter | Plot |
|---|---|
| CZT HV Monitor |  |
| D_VDD |  |
| Temperature 1 |  |
| Veto HV Monitor |  |
| Veto LLD |  |
| Alpha Counter |  |
| _CPM_Rate |  |
| CZT Counter |  |
| +2.5 Volts monitor |  |
| +5 Volts monitor |  |
| _ROLL_ROT |  |
| _Roll_DEC |  |
| _Roll_RA |  |
| Veto Counter |  |