| Param | Original file | Final file |
|---|---|---|
| Filename | modeM0/AS1A10_071T09_9000004320_30044cztM0_level2.evt | modeM0/AS1A10_071T09_9000004320_30044cztM0_level2_quad_clean.evt |
| Size (bytes) | 739,350,720 | 113,299,200 |
| Size | 705.1 MB | 108.1 MB |
| Events in quadrant A | 4,668,166 | 701,881 |
| Events in quadrant B | 7,551,293 | 701,119 |
| Events in quadrant C | 4,776,254 | 672,960 |
| Events in quadrant D | 4,728,524 | 672,090 |
| Mode SS | |||
|---|---|---|---|
| Quadrant | BADHDUFLAG | Total packets | Discarded packets |
| A | 0 | 202 | 0 |
| B | 0 | 202 | 0 |
| C | 0 | 202 | 0 |
| D | 0 | 202 | 0 |
| Mode M0 | |||
|---|---|---|---|
| Quadrant | BADHDUFLAG | Total packets | Discarded packets |
| A | 0 | 20318 | 2 |
| B | 0 | 29732 | 2 |
| C | 0 | 20490 | 2 |
| D | 0 | 20656 | 2 |
| Mode M9 | |||
|---|---|---|---|
| Quadrant | BADHDUFLAG | Total packets | Discarded packets |
| A | 0 | 14 | 0 |
| B | 0 | 14 | 0 |
| C | 0 | 14 | 0 |
| D | 0 | 14 | 0 |
| Quadrant | Total seconds | Saturated seconds | Saturation percentage |
|---|---|---|---|
| A | 9852 | 83 | 0.842469% |
| B | 9852 | 145 | 1.471782% |
| C | 9852 | 162 | 1.644336% |
| D | 9852 | 55 | 0.558262% |
Noise dominated data is calculated using 1-second bins in cleaned event files. If a bin has >2000 counts, and if more than 50% of those come from <1% of pixels, then it is considered to be noise-dominated and hence unusable.
| Quadrant | # 1 sec bins | Bins with >0 counts | Bins with >2000 counts | High rate bins dominated by noise | Noise dominated (total time) | Noise dominated (detector-on time) | Marked lightcurve |
|---|---|---|---|---|---|---|---|
| A | 11292 | 9854 | 2 | 2 | 0.02% | 0.02% | 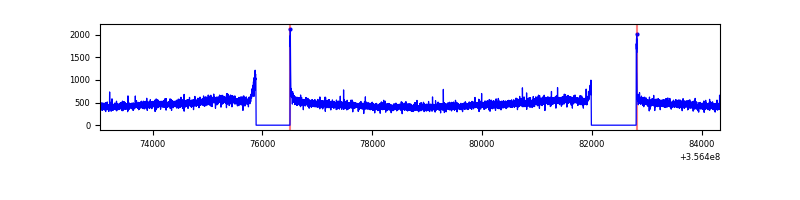 |
| B | 11292 | 9854 | 1 | 1 | 0.01% | 0.01% | 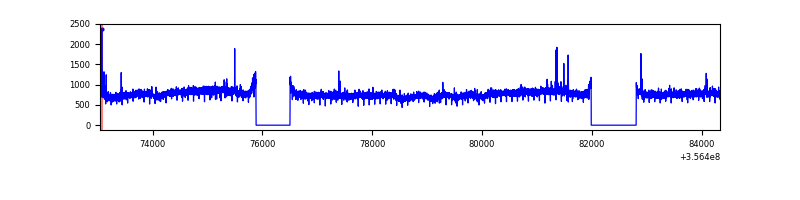 |
| C | 11292 | 9854 | 1 | 1 | 0.01% | 0.01% | 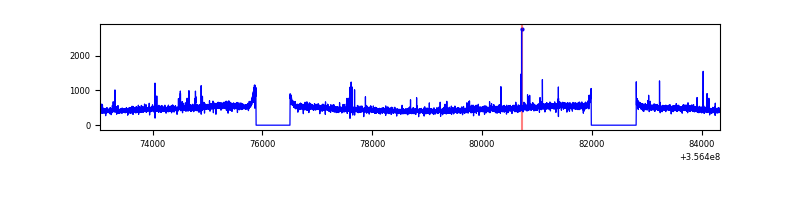 |
| D | 11292 | 9854 | 11 | 11 | 0.10% | 0.11% | 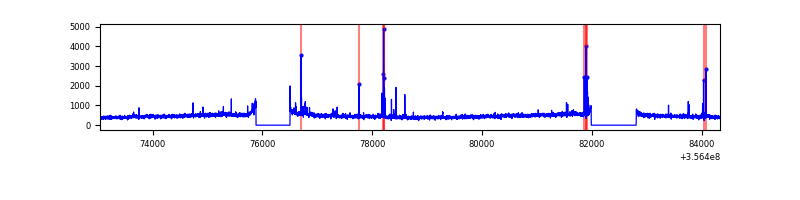 |
Top three noisy pixels from each quadrant. If the there are fewer than three noisy pixels in the level2.evt file, extra rows are filled as -1
| Pixel properties | Quadrant properties | ||||||
|---|---|---|---|---|---|---|---|
| Quadrant | DetID | PixID | Counts | Sigma | Mean | Median | Sigma |
| A | 8 | 192 | 27506 | 109.04 | 1202 | 1177 | 241.5 |
| A | 13 | 254 | 18470 | 71.62 | 1202 | 1177 | 241.5 |
| A | 3 | 137 | 12552 | 47.11 | 1202 | 1177 | 241.5 |
| B | 6 | 159 | 2834582 | 12378.72 | 1184 | 1153 | 228.9 |
| B | 12 | 111 | 29380 | 123.32 | 1184 | 1153 | 228.9 |
| B | 11 | 111 | 27203 | 113.81 | 1184 | 1153 | 228.9 |
| C | 14 | 238 | 207374 | 761.74 | 1147 | 1154 | 270.7 |
| C | 14 | 254 | 34629 | 123.65 | 1147 | 1154 | 270.7 |
| C | 2 | 114 | 22721 | 79.66 | 1147 | 1154 | 270.7 |
| D | 8 | 195 | 224529 | 808.13 | 1158 | 1131 | 276.4 |
| D | 2 | 250 | 93824 | 335.31 | 1158 | 1131 | 276.4 |
| D | 2 | 234 | 38712 | 135.95 | 1158 | 1131 | 276.4 |
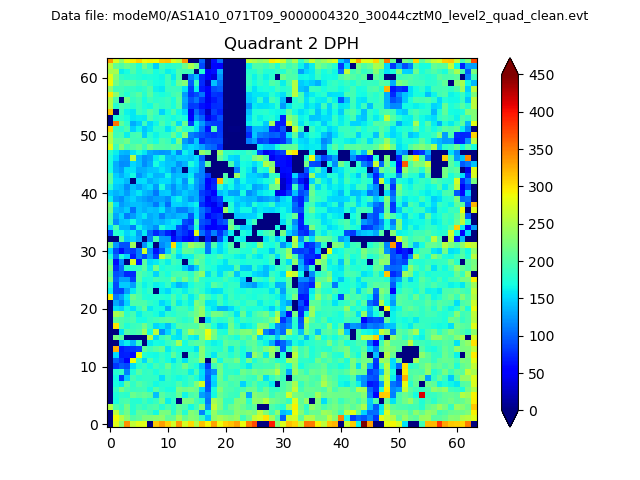
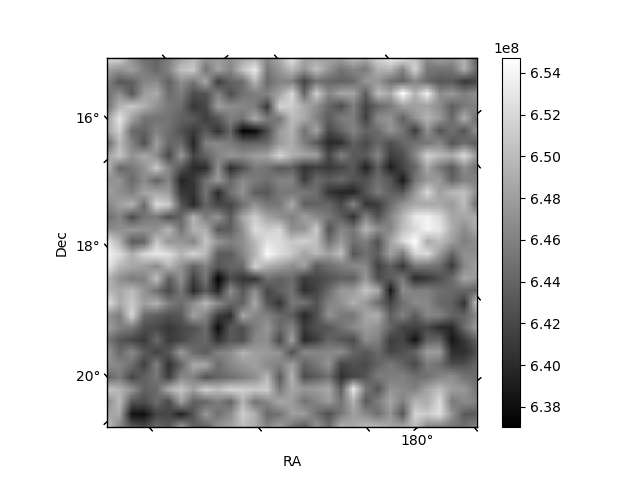
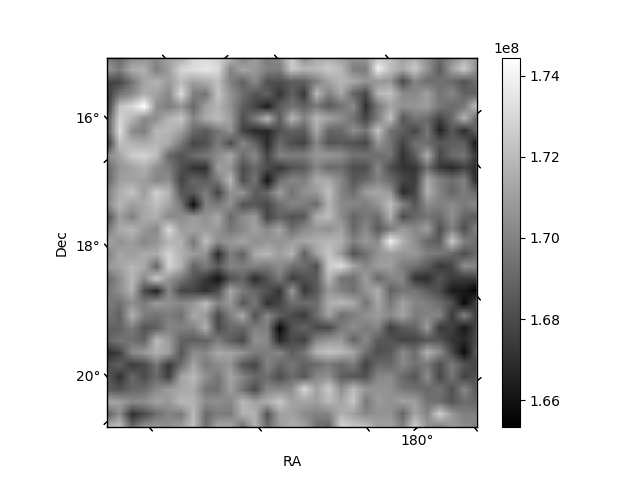
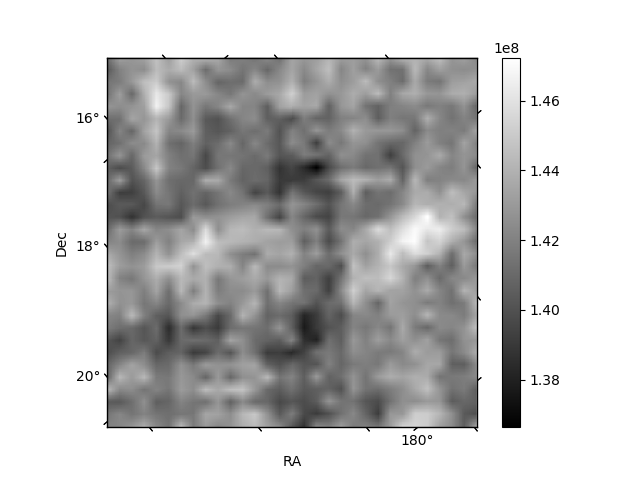
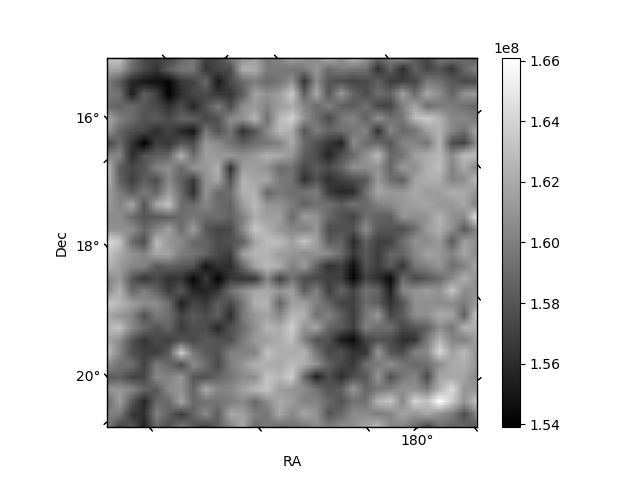
Histogram calculated using DETX and DETY for each event in the final _common_clean file
| Quadrant A | 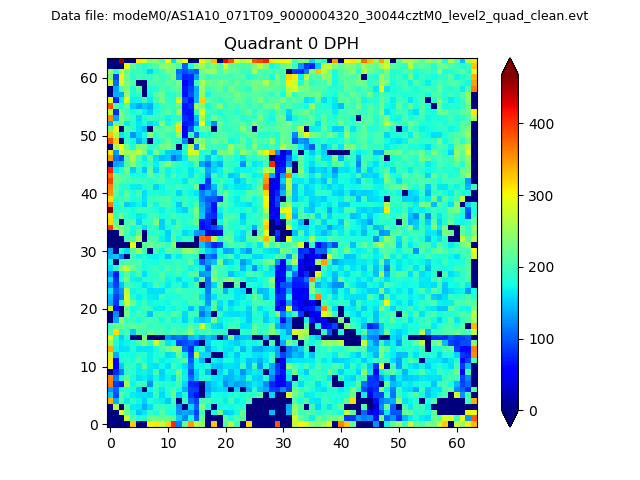 |
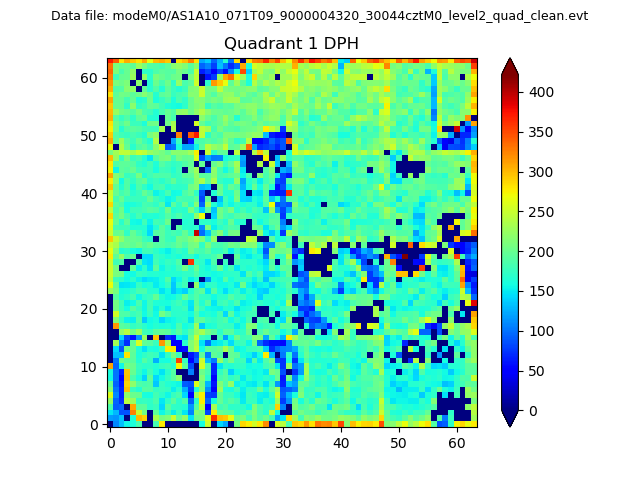 |
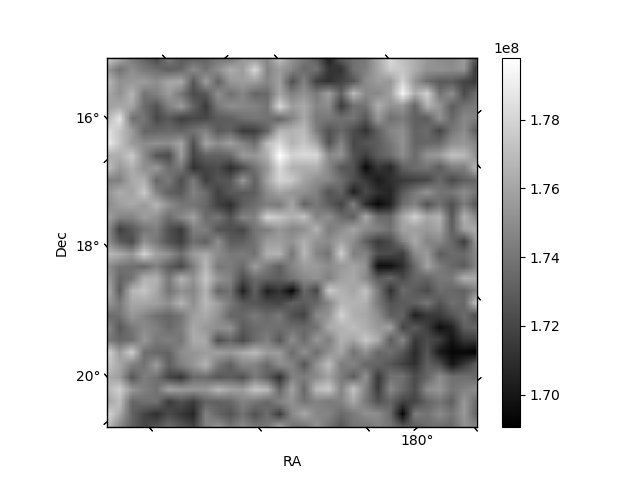
Quadrant B |
|---|---|---|---|
| Quadrant D | 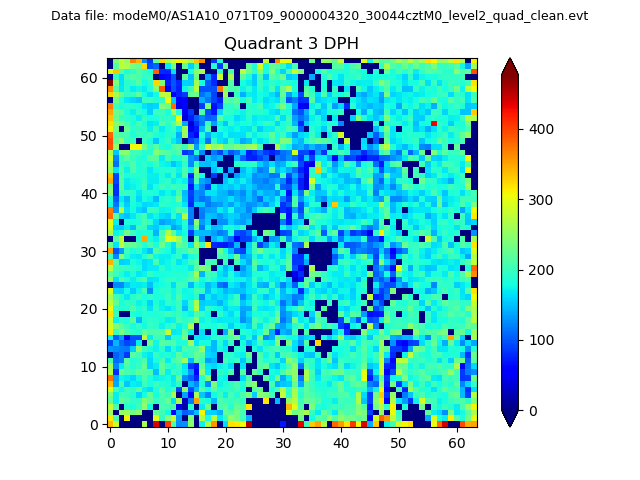 |
 |
Quadrant C |
| Plot type | Count rate plots | Images |
|---|---|---|
| Comparison with Poisson distribution Blue bars denote a histogram of data divided into 1 sec bins. Red curve is a Poisson curve with rate = median count rate of data. |
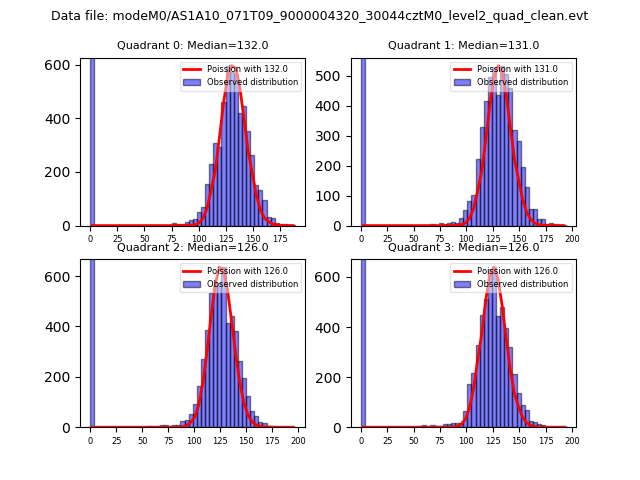 |
 |
| Quadrant-wise count rates Data is divided into 100 sec bins |
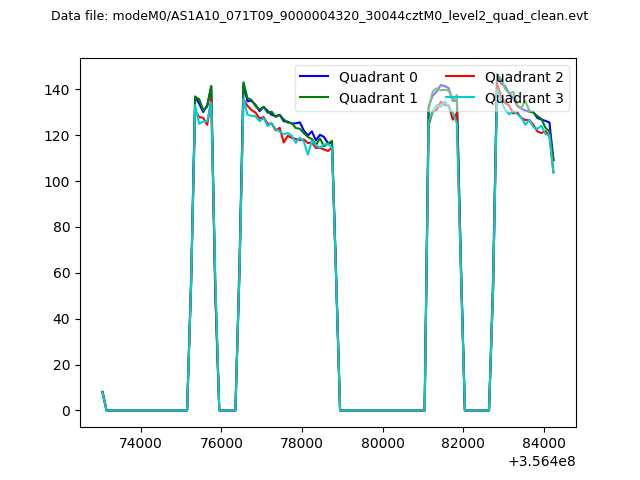 |
|
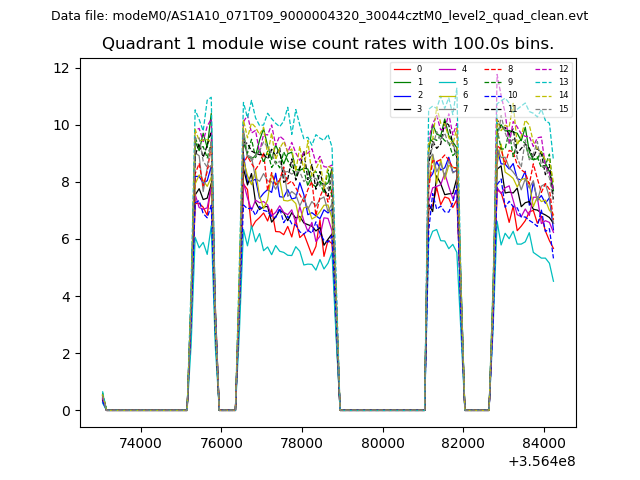
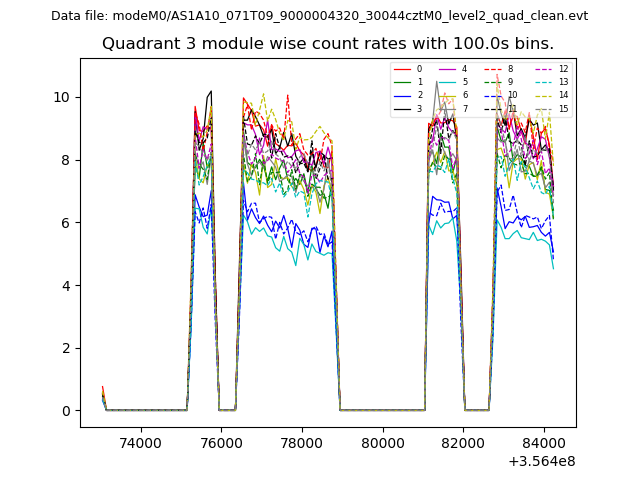
| Module-wise count rates for Quadrant A Data is divided into 100 sec bins |
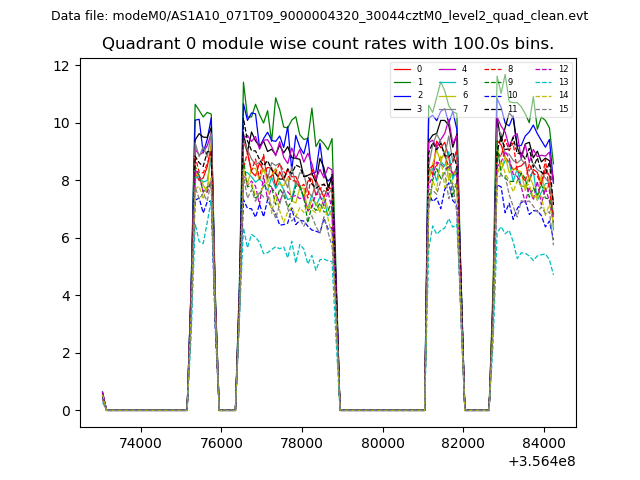 |
 |
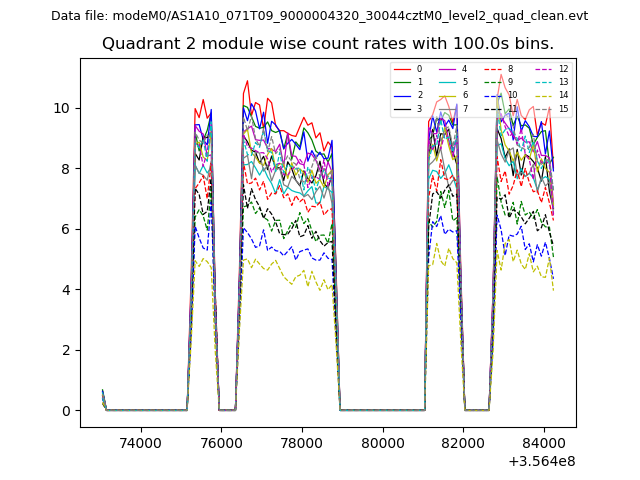
| Module-wise count rates for Quadrant B Data is divided into 100 sec bins |
 |
 |
| Module-wise count rates for Quadrant C Data is divided into 100 sec bins |
 |
 |
| Module-wise count rates for Quadrant D Data is divided into 100 sec bins |
 |
 |
| Parameter | Plot |
|---|---|
| CZT HV Monitor | 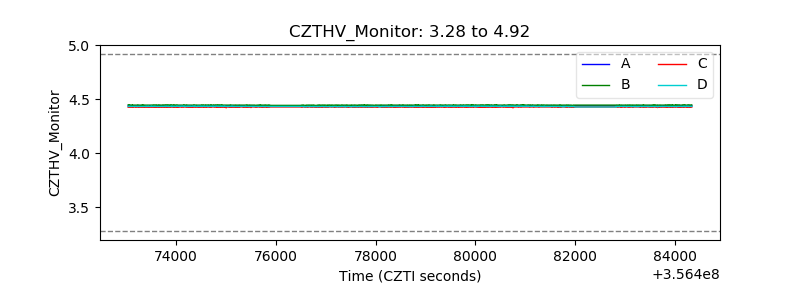 |
| D_VDD | 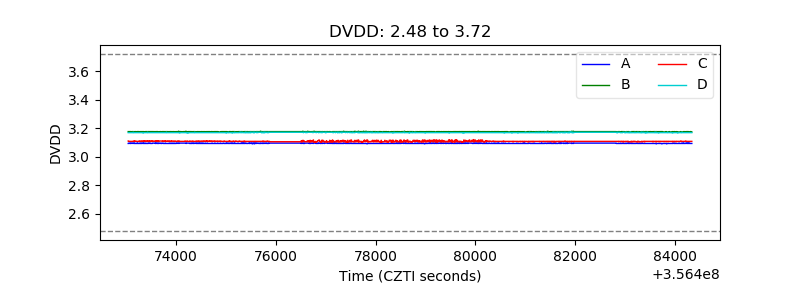 |
| Temperature 1 | 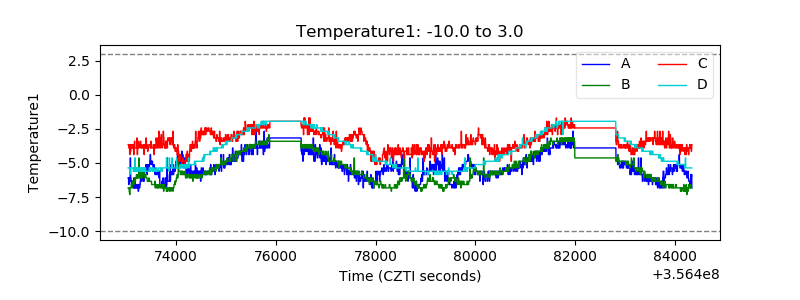 |
| Veto HV Monitor |  |
| Veto LLD | 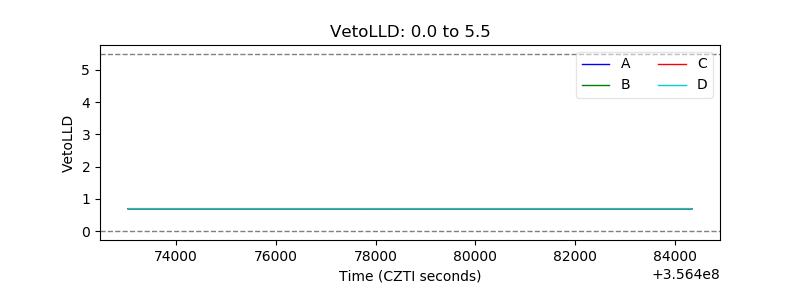 |
| Alpha Counter | 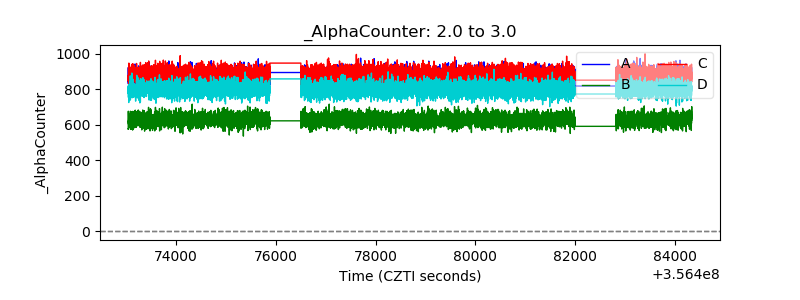 |
| _CPM_Rate | 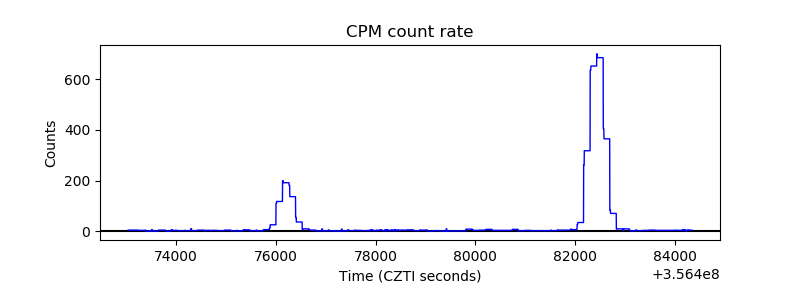 |
| CZT Counter |  |
| +2.5 Volts monitor |  |
| +5 Volts monitor |  |
| _ROLL_ROT | 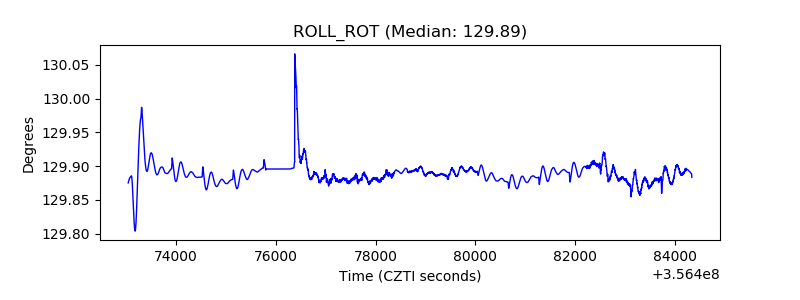 |
| _Roll_DEC | 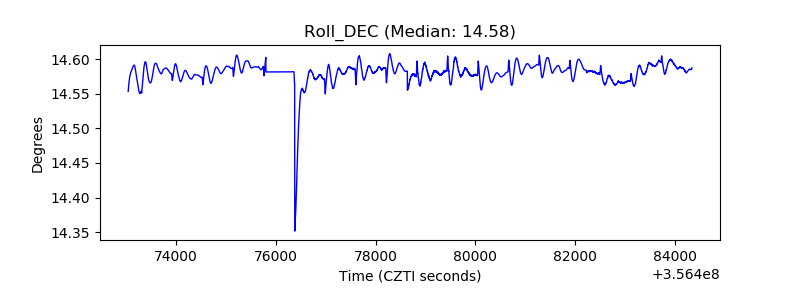 |
| _Roll_RA | 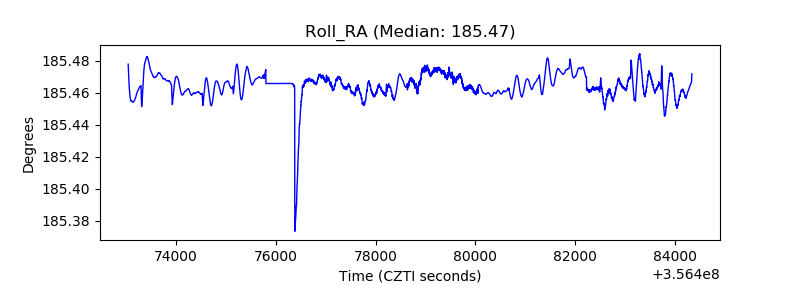 |
| Veto Counter | 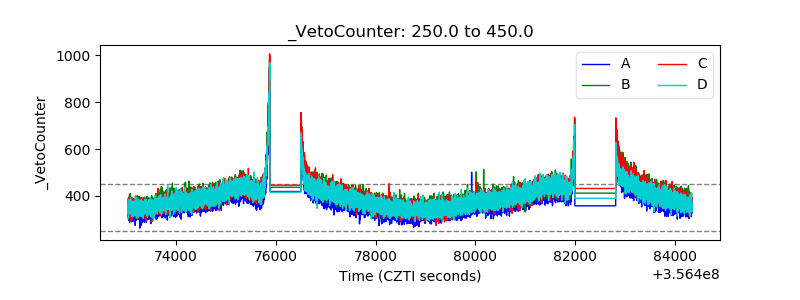 |