| Param | Original file | Final file |
|---|---|---|
| Filename | modeM0/AS1A10_071T09_9000004320_30047cztM0_level2.evt | modeM0/AS1A10_071T09_9000004320_30047cztM0_level2_quad_clean.evt |
| Size (bytes) | 490,176,000 | 88,375,680 |
| Size | 467.5 MB | 84.3 MB |
| Events in quadrant A | 3,123,523 | 574,376 |
| Events in quadrant B | 4,934,696 | 574,954 |
| Events in quadrant C | 3,283,620 | 537,022 |
| Events in quadrant D | 3,066,404 | 540,705 |
| Mode SS | |||
|---|---|---|---|
| Quadrant | BADHDUFLAG | Total packets | Discarded packets |
| A | 0 | 132 | 0 |
| B | 0 | 132 | 0 |
| C | 0 | 132 | 0 |
| D | 0 | 132 | 0 |
| Mode M0 | |||
|---|---|---|---|
| Quadrant | BADHDUFLAG | Total packets | Discarded packets |
| A | 0 | 13250 | 2 |
| B | 0 | 19386 | 2 |
| C | 0 | 13691 | 2 |
| D | 0 | 13326 | 2 |
| Mode M9 | |||
|---|---|---|---|
| Quadrant | BADHDUFLAG | Total packets | Discarded packets |
| A | 0 | 15 | 0 |
| B | 0 | 16 | 0 |
| C | 0 | 16 | 0 |
| D | 0 | 16 | 0 |
| Quadrant | Total seconds | Saturated seconds | Saturation percentage |
|---|---|---|---|
| A | 6433 | 27 | 0.419711% |
| B | 6433 | 58 | 0.901601% |
| C | 6433 | 190 | 2.953521% |
| D | 6432 | 6 | 0.093284% |
Noise dominated data is calculated using 1-second bins in cleaned event files. If a bin has >2000 counts, and if more than 50% of those come from <1% of pixels, then it is considered to be noise-dominated and hence unusable.
| Quadrant | # 1 sec bins | Bins with >0 counts | Bins with >2000 counts | High rate bins dominated by noise | Noise dominated (total time) | Noise dominated (detector-on time) | Marked lightcurve |
|---|---|---|---|---|---|---|---|
| A | 7538 | 6434 | 6 | 6 | 0.08% | 0.09% | 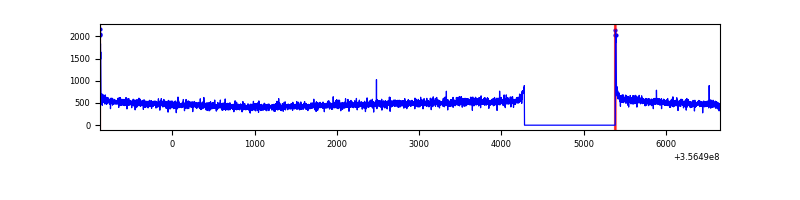 |
| B | 7538 | 6434 | 2 | 2 | 0.03% | 0.03% | 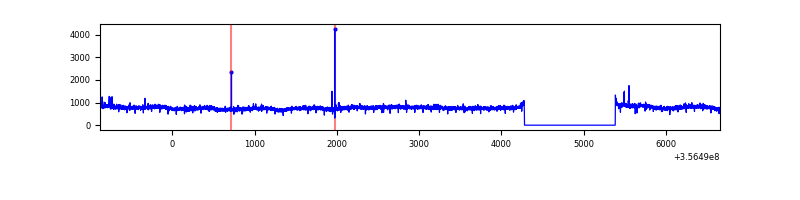 |
| C | 7538 | 6434 | 12 | 12 | 0.16% | 0.19% | 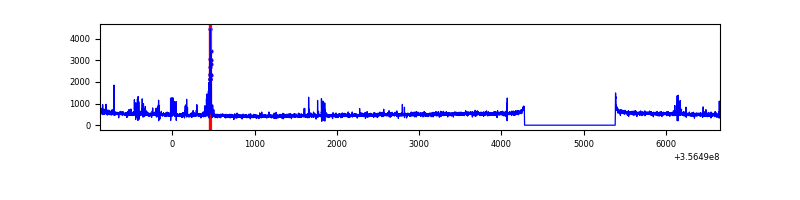 |
| D | 7537 | 6433 | 2 | 2 | 0.03% | 0.03% | 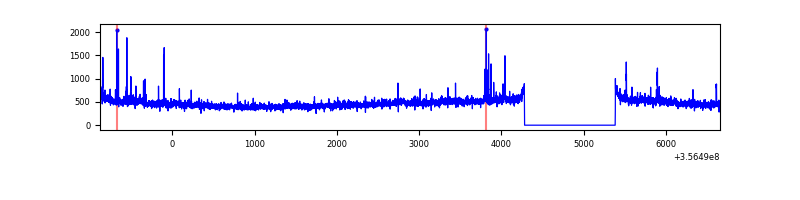 |
Top three noisy pixels from each quadrant. If the there are fewer than three noisy pixels in the level2.evt file, extra rows are filled as -1
| Pixel properties | Quadrant properties | ||||||
|---|---|---|---|---|---|---|---|
| Quadrant | DetID | PixID | Counts | Sigma | Mean | Median | Sigma |
| A | 8 | 192 | 27954 | 168.31 | 802 | 787 | 161.4 |
| A | 13 | 254 | 12585 | 73.09 | 802 | 787 | 161.4 |
| A | 3 | 137 | 8132 | 45.51 | 802 | 787 | 161.4 |
| B | 6 | 159 | 1771183 | 11661.38 | 794 | 773 | 151.8 |
| B | 5 | 255 | 31068 | 199.55 | 794 | 773 | 151.8 |
| B | 12 | 111 | 18921 | 119.54 | 794 | 773 | 151.8 |
| C | 14 | 238 | 167659 | 938.27 | 756 | 762 | 177.9 |
| C | 14 | 254 | 64779 | 359.89 | 756 | 762 | 177.9 |
| C | 15 | 208 | 64555 | 358.63 | 756 | 762 | 177.9 |
| D | 8 | 195 | 120980 | 665.17 | 764 | 746 | 180.8 |
| D | 2 | 250 | 38159 | 206.98 | 764 | 746 | 180.8 |
| D | 2 | 234 | 22195 | 118.66 | 764 | 746 | 180.8 |
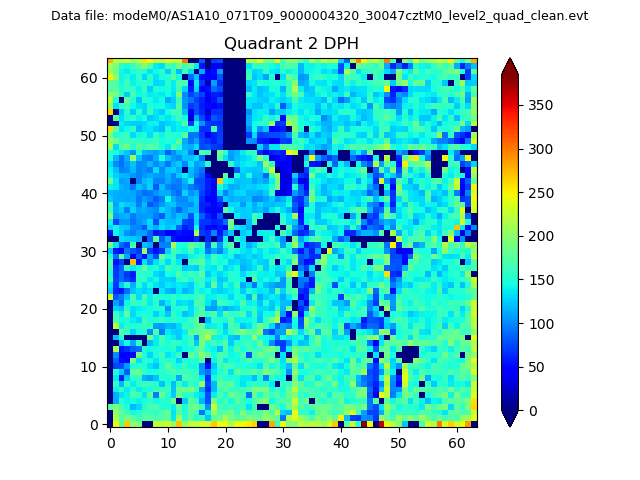
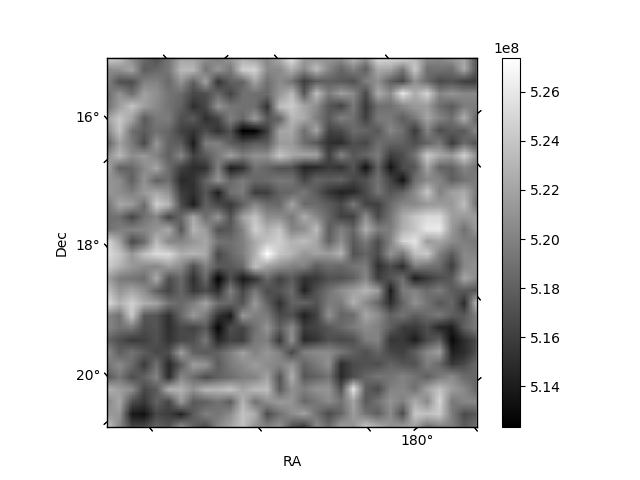
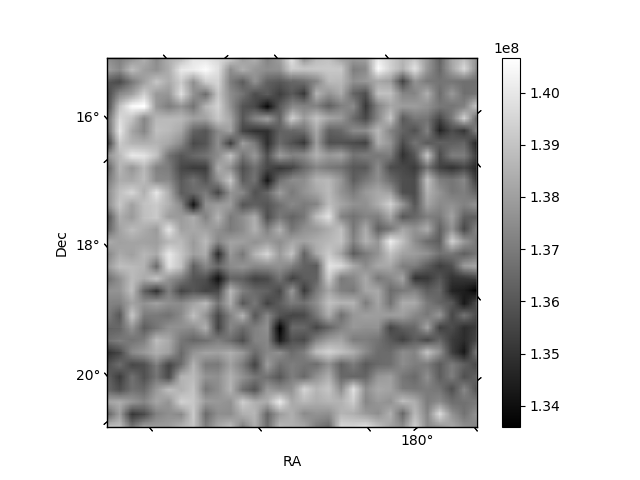
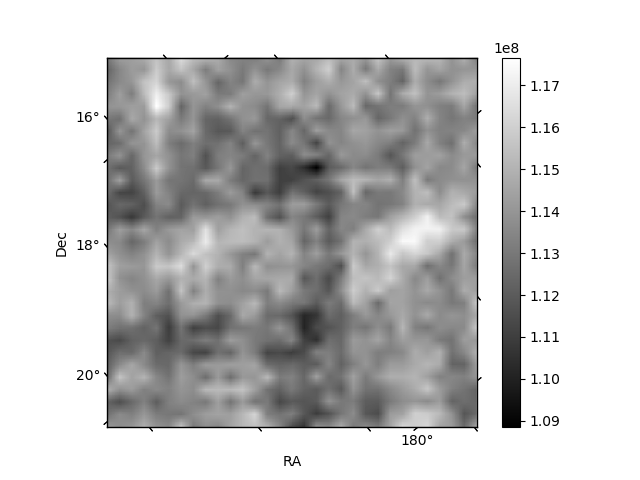
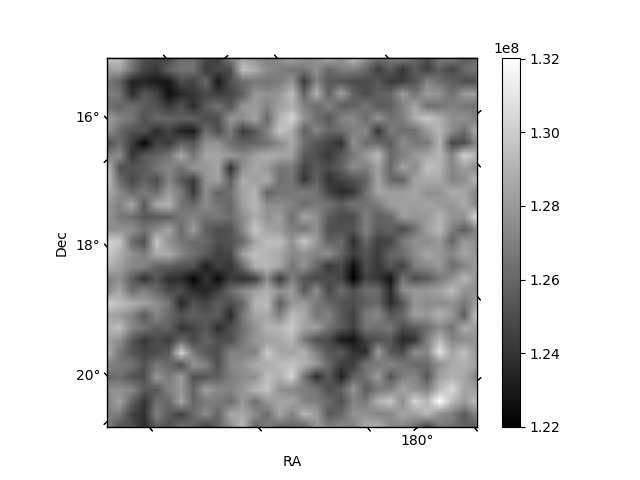
Histogram calculated using DETX and DETY for each event in the final _common_clean file
| Quadrant A | 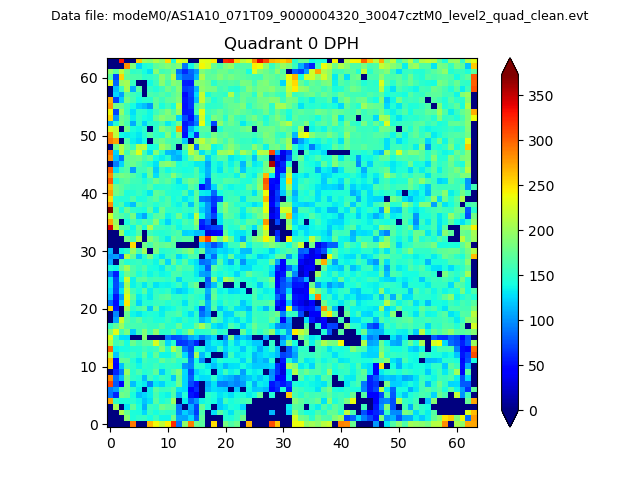 |
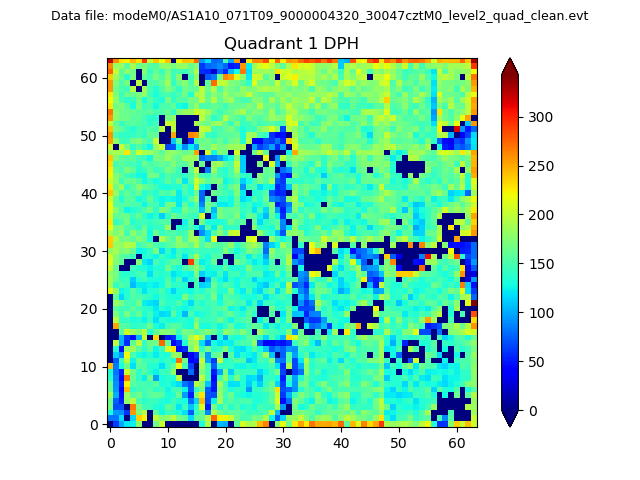 |
Quadrant B |
|---|---|---|---|
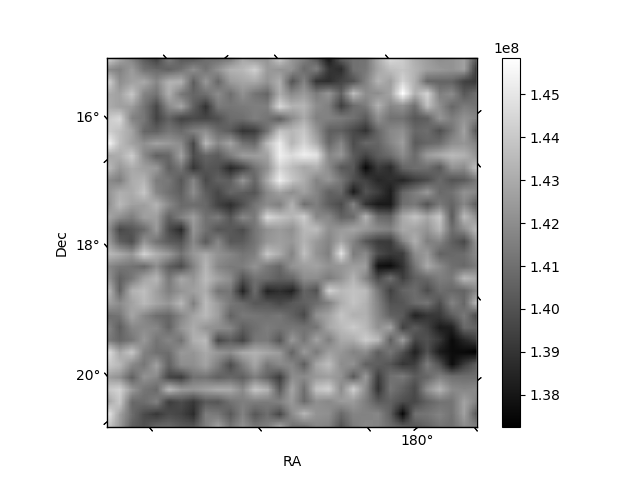
| Quadrant D | 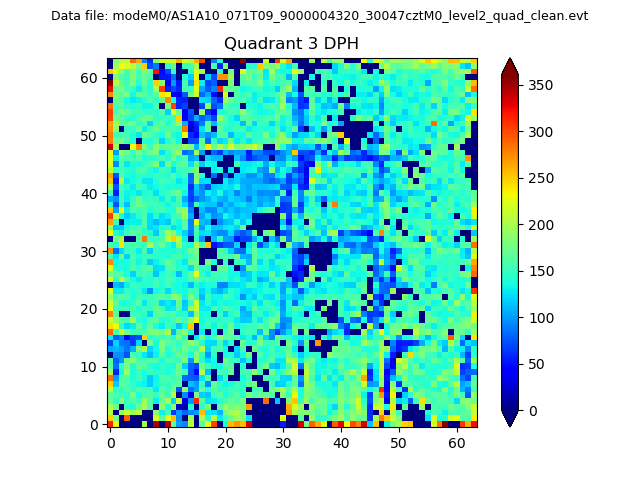 |
 |
Quadrant C |
| Plot type | Count rate plots | Images |
|---|---|---|
| Comparison with Poisson distribution Blue bars denote a histogram of data divided into 1 sec bins. Red curve is a Poisson curve with rate = median count rate of data. |
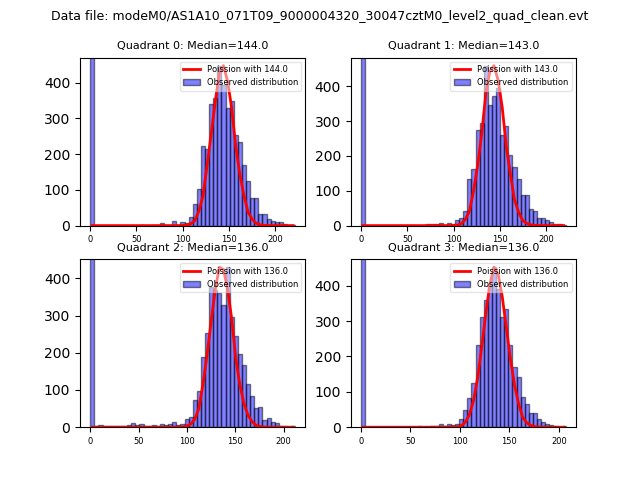 |
 |
| Quadrant-wise count rates Data is divided into 100 sec bins |
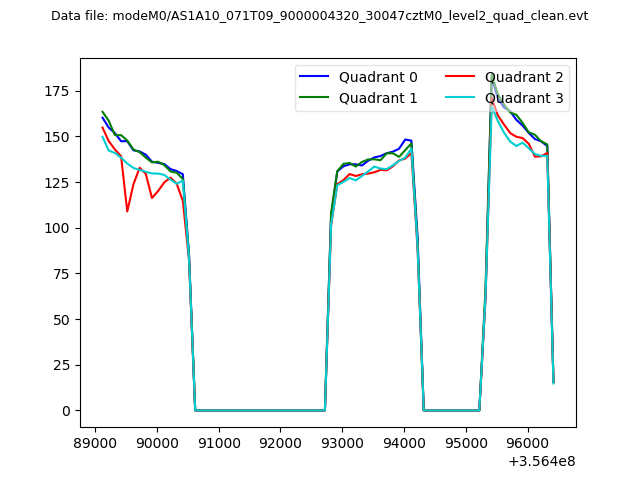 |
|
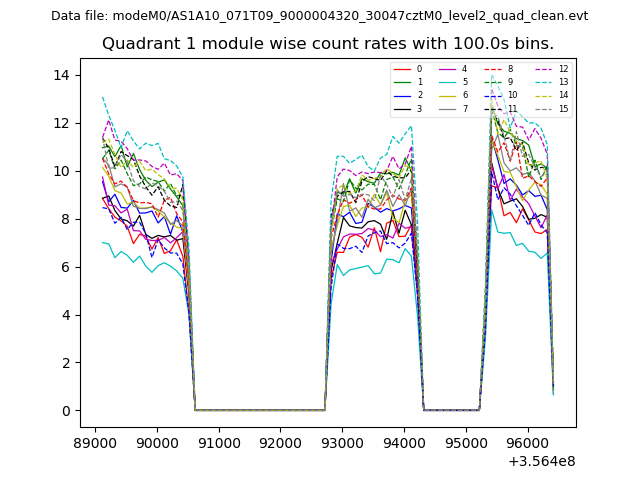
| Module-wise count rates for Quadrant A Data is divided into 100 sec bins |
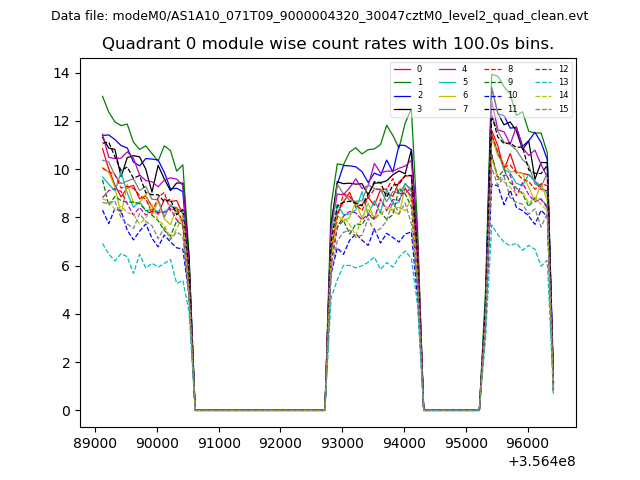 |
 |
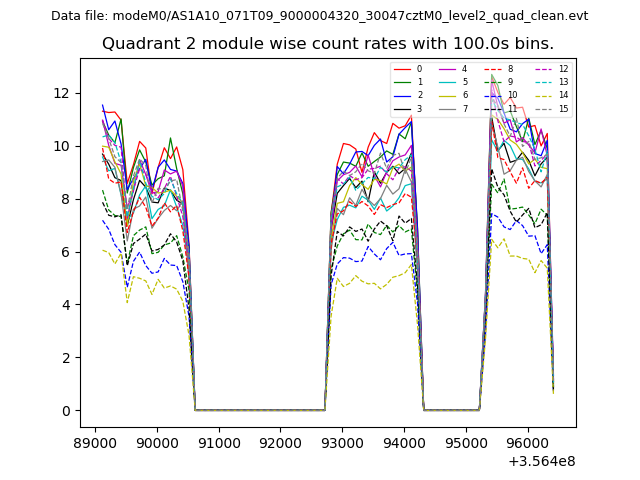
| Module-wise count rates for Quadrant B Data is divided into 100 sec bins |
 |
 |
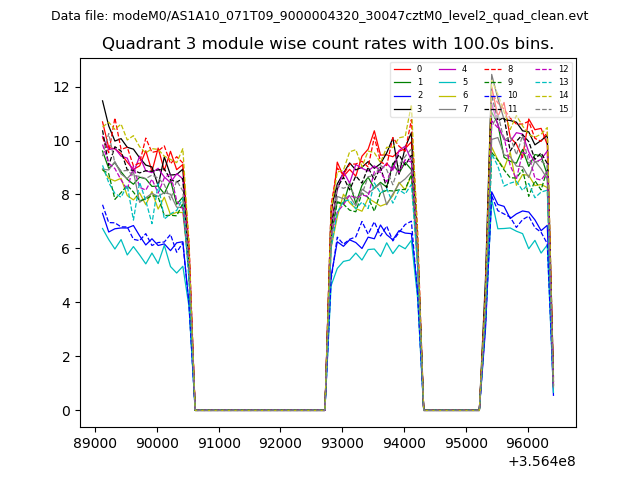
| Module-wise count rates for Quadrant C Data is divided into 100 sec bins |
 |
 |
| Module-wise count rates for Quadrant D Data is divided into 100 sec bins |
 |
 |
| Parameter | Plot |
|---|---|
| CZT HV Monitor | 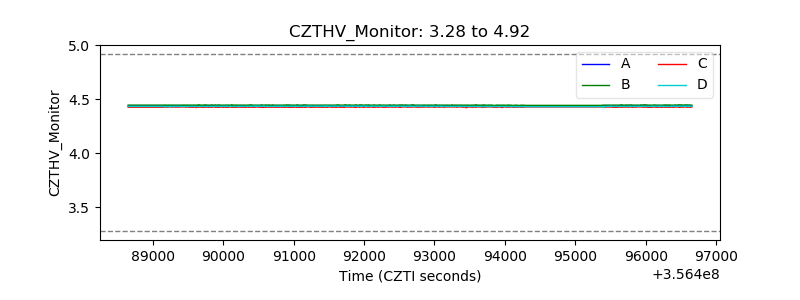 |
| D_VDD | 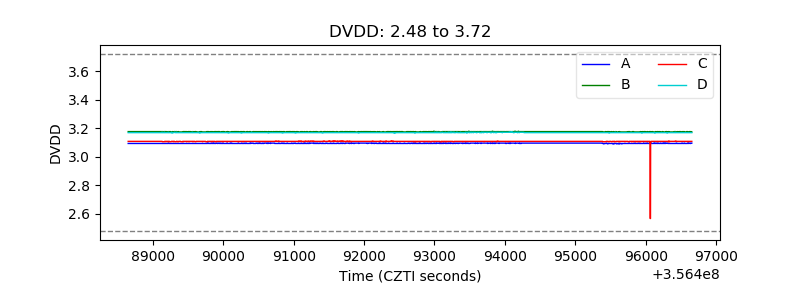 |
| Temperature 1 | 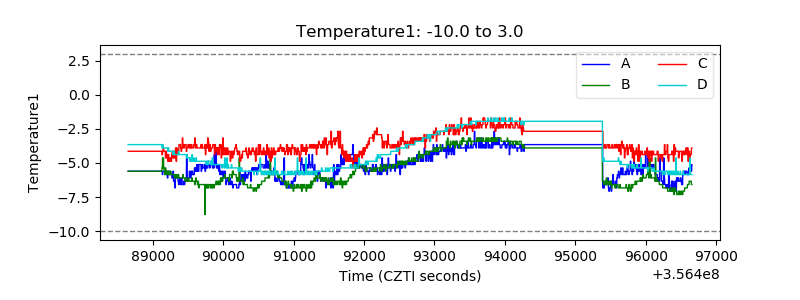 |
| Veto HV Monitor | 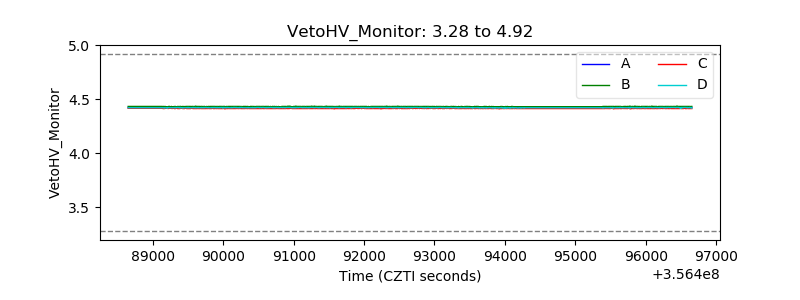 |
| Veto LLD | 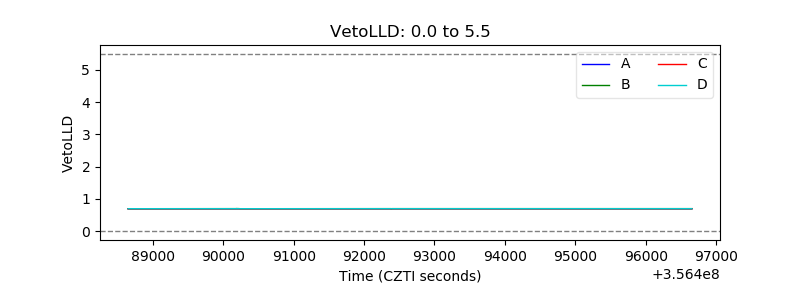 |
| Alpha Counter | 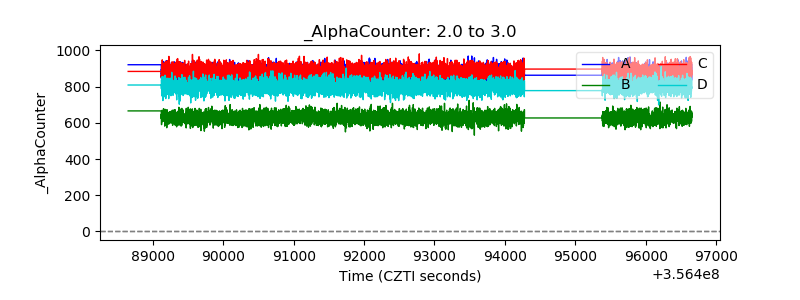 |
| _CPM_Rate | 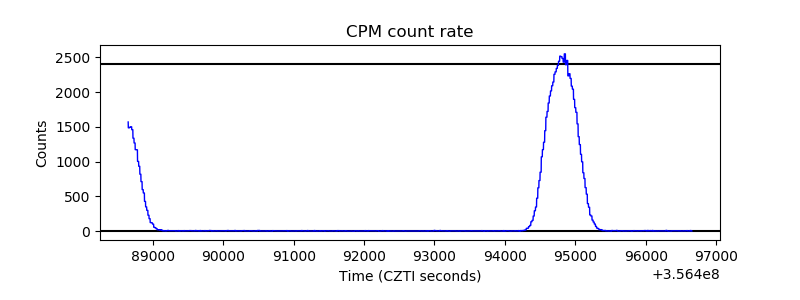 |
| CZT Counter | 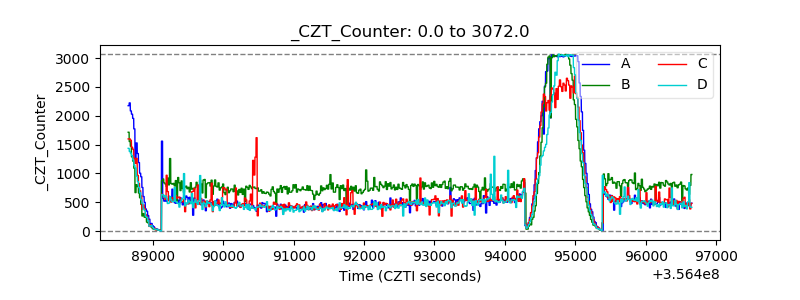 |
| +2.5 Volts monitor |  |
| +5 Volts monitor | 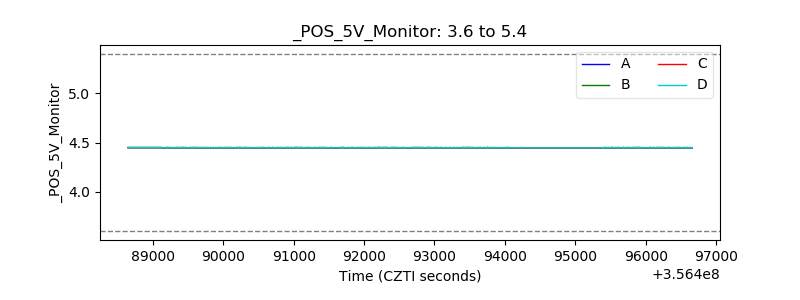 |
| _ROLL_ROT | 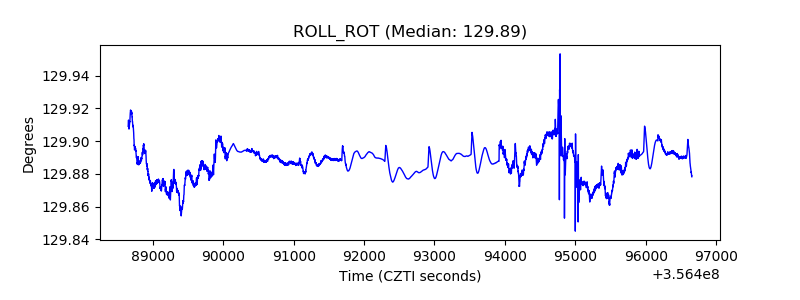 |
| _Roll_DEC | 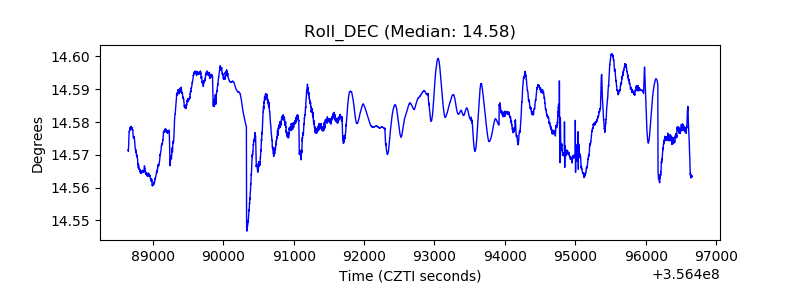 |
| _Roll_RA | 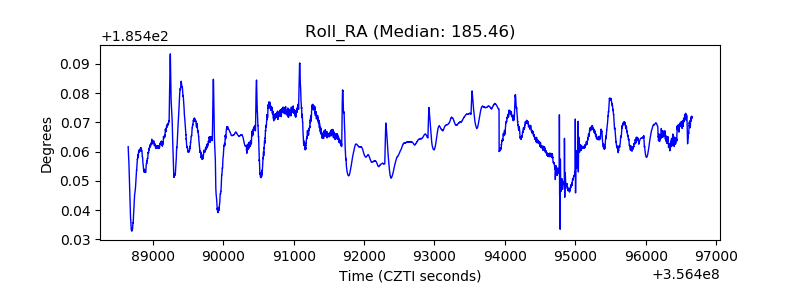 |
| Veto Counter | 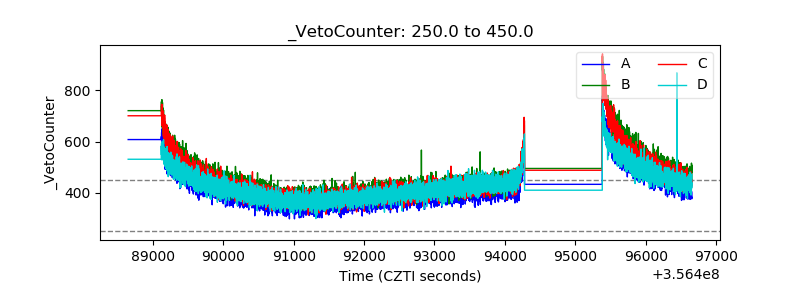 |