| Param | Original file | Final file |
|---|---|---|
| Filename | modeM0/AS1A10_071T09_9000004320_30048cztM0_level2.evt | modeM0/AS1A10_071T09_9000004320_30048cztM0_level2_quad_clean.evt |
| Size (bytes) | 498,821,760 | 82,958,400 |
| Size | 475.7 MB | 79.1 MB |
| Events in quadrant A | 3,214,263 | 533,067 |
| Events in quadrant B | 4,979,897 | 537,427 |
| Events in quadrant C | 3,290,608 | 502,587 |
| Events in quadrant D | 3,195,272 | 499,758 |
| Mode SS | |||
|---|---|---|---|
| Quadrant | BADHDUFLAG | Total packets | Discarded packets |
| A | 0 | 128 | 0 |
| B | 0 | 128 | 0 |
| C | 0 | 128 | 0 |
| D | 0 | 128 | 0 |
| Mode M0 | |||
|---|---|---|---|
| Quadrant | BADHDUFLAG | Total packets | Discarded packets |
| A | 0 | 13261 | 2 |
| B | 0 | 19101 | 2 |
| C | 0 | 13490 | 2 |
| D | 0 | 13441 | 2 |
| Mode M9 | |||
|---|---|---|---|
| Quadrant | BADHDUFLAG | Total packets | Discarded packets |
| A | 0 | 13 | 0 |
| B | 0 | 14 | 0 |
| C | 0 | 14 | 0 |
| D | 0 | 14 | 0 |
| Quadrant | Total seconds | Saturated seconds | Saturation percentage |
|---|---|---|---|
| A | 6293 | 37 | 0.587955% |
| B | 6293 | 65 | 1.032894% |
| C | 6293 | 142 | 2.256475% |
| D | 6293 | 24 | 0.381376% |
Noise dominated data is calculated using 1-second bins in cleaned event files. If a bin has >2000 counts, and if more than 50% of those come from <1% of pixels, then it is considered to be noise-dominated and hence unusable.
| Quadrant | # 1 sec bins | Bins with >0 counts | Bins with >2000 counts | High rate bins dominated by noise | Noise dominated (total time) | Noise dominated (detector-on time) | Marked lightcurve |
|---|---|---|---|---|---|---|---|
| A | 7483 | 6294 | 3 | 3 | 0.04% | 0.05% | 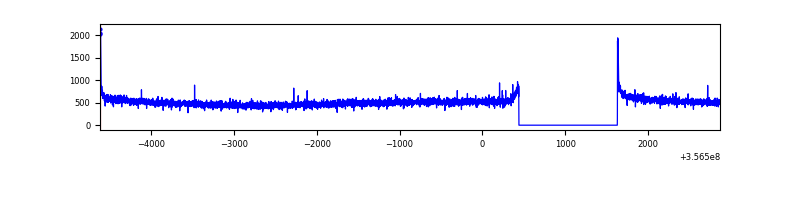 |
| B | 7483 | 6294 | 2 | 2 | 0.03% | 0.03% | 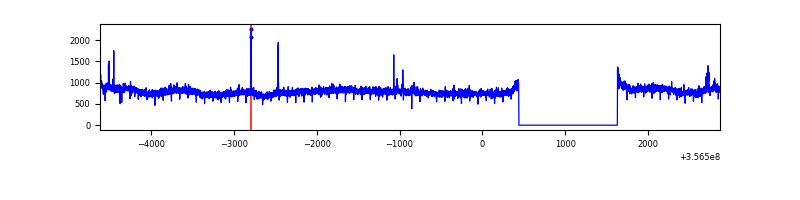 |
| C | 7483 | 6294 | 3 | 3 | 0.04% | 0.05% | 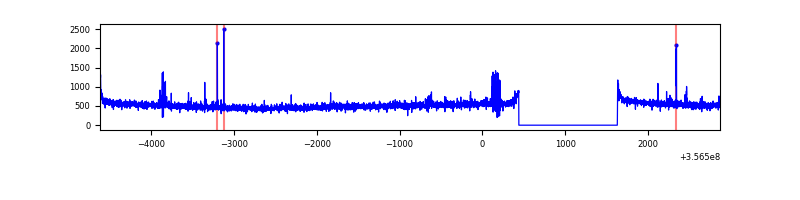 |
| D | 7483 | 6294 | 8 | 8 | 0.11% | 0.13% | 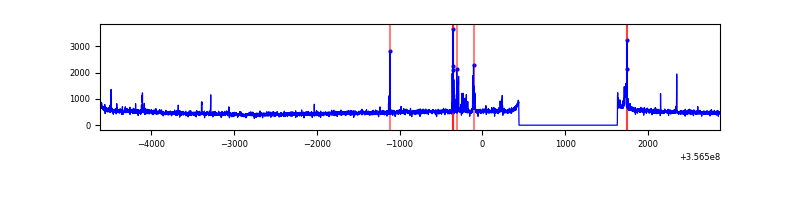 |
Top three noisy pixels from each quadrant. If the there are fewer than three noisy pixels in the level2.evt file, extra rows are filled as -1
| Pixel properties | Quadrant properties | ||||||
|---|---|---|---|---|---|---|---|
| Quadrant | DetID | PixID | Counts | Sigma | Mean | Median | Sigma |
| A | 8 | 192 | 27256 | 160.63 | 825 | 811 | 164.6 |
| A | 13 | 254 | 11165 | 62.89 | 825 | 811 | 164.6 |
| A | 3 | 137 | 7907 | 43.1 | 825 | 811 | 164.6 |
| B | 6 | 159 | 1725895 | 11094.06 | 817 | 796 | 155.5 |
| B | 10 | 247 | 31413 | 196.9 | 817 | 796 | 155.5 |
| B | 12 | 111 | 19061 | 117.46 | 817 | 796 | 155.5 |
| C | 14 | 238 | 160264 | 869.06 | 778 | 784 | 183.5 |
| C | 14 | 254 | 45251 | 242.32 | 778 | 784 | 183.5 |
| C | 3 | 233 | 24077 | 126.93 | 778 | 784 | 183.5 |
| D | 8 | 195 | 113538 | 612.67 | 781 | 764 | 184.1 |
| D | 2 | 250 | 76651 | 412.27 | 781 | 764 | 184.1 |
| D | 2 | 234 | 21940 | 115.04 | 781 | 764 | 184.1 |
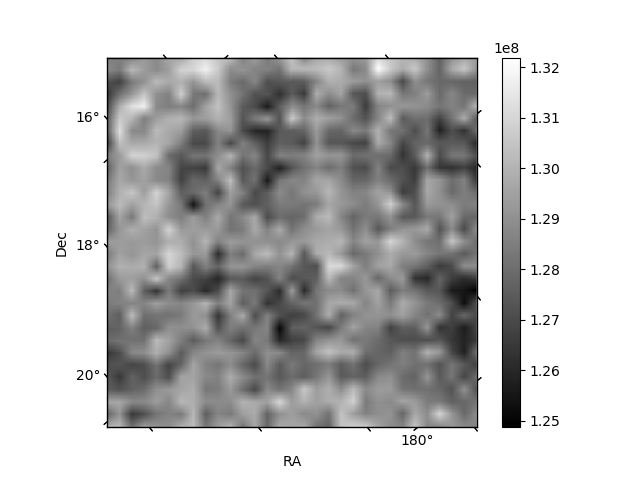
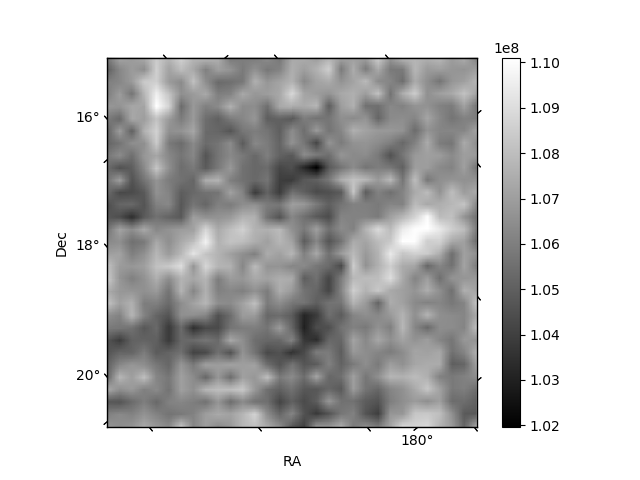
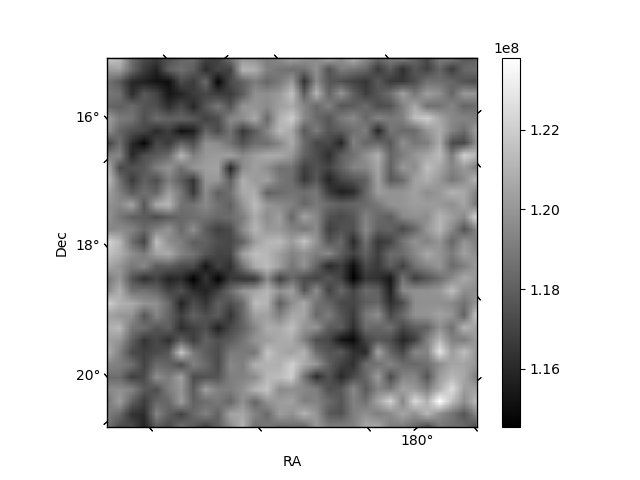
Histogram calculated using DETX and DETY for each event in the final _common_clean file
| Quadrant A |  |
 |
Quadrant B |
|---|---|---|---|
| Quadrant D | 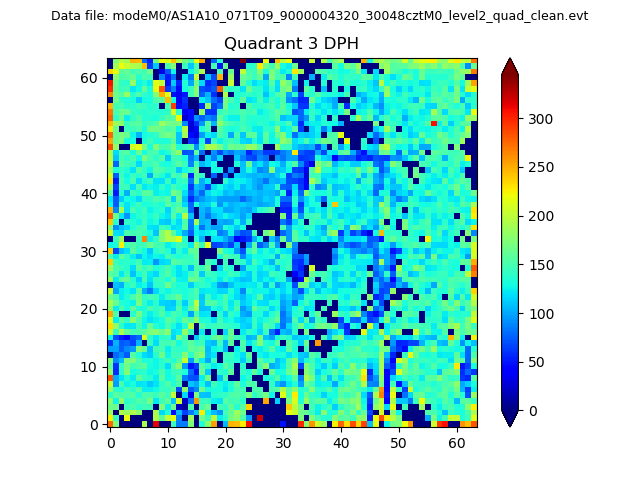 |
 |
Quadrant C |
| Plot type | Count rate plots | Images |
|---|---|---|
| Comparison with Poisson distribution Blue bars denote a histogram of data divided into 1 sec bins. Red curve is a Poisson curve with rate = median count rate of data. |
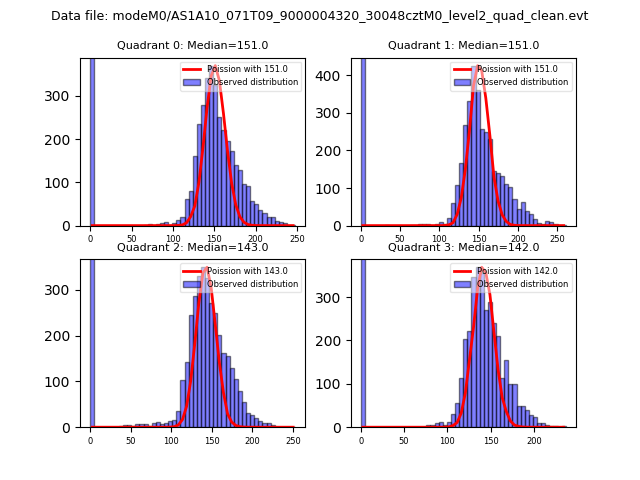 |
 |
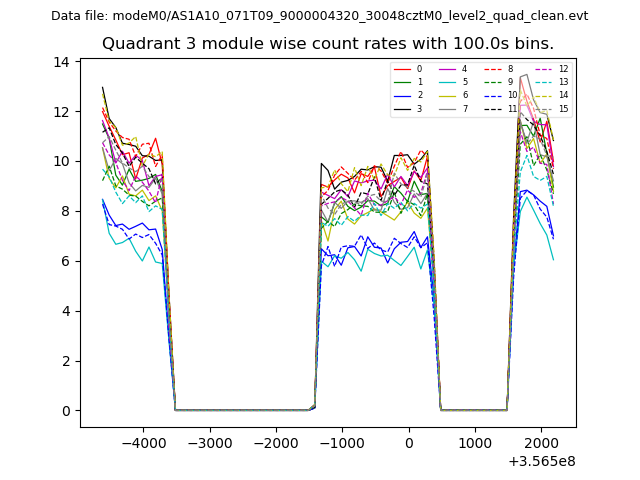
| Quadrant-wise count rates Data is divided into 100 sec bins |
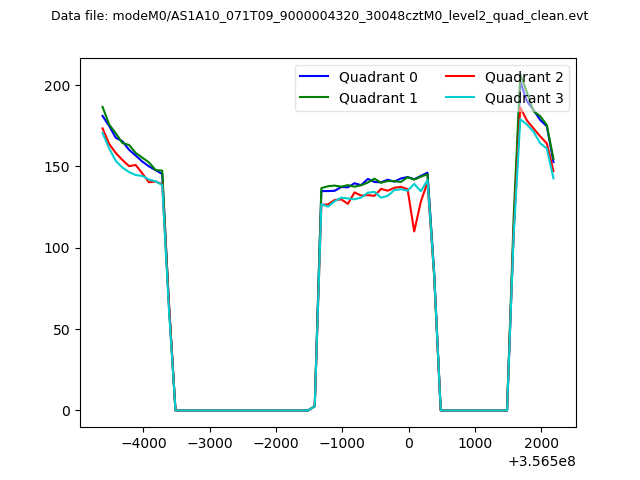 |
|
| Module-wise count rates for Quadrant A Data is divided into 100 sec bins |
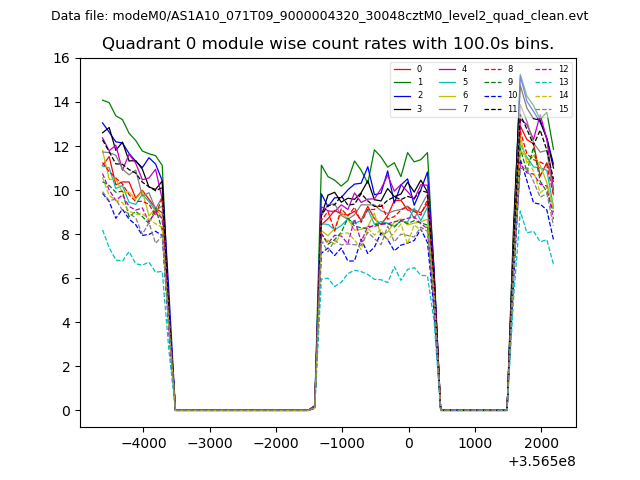 |
 |
| Module-wise count rates for Quadrant B Data is divided into 100 sec bins |
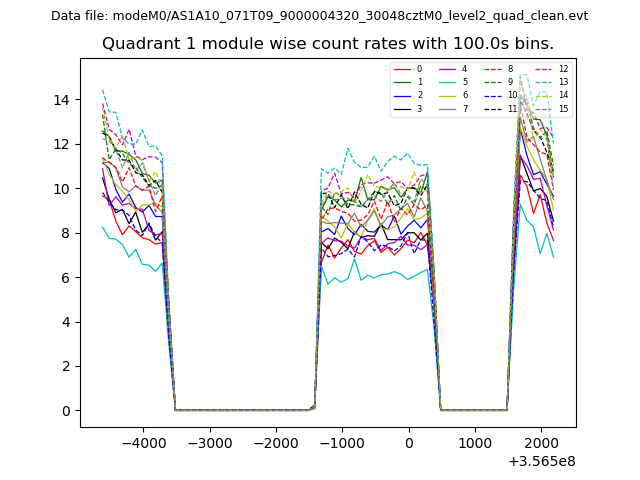 |
 |
| Module-wise count rates for Quadrant C Data is divided into 100 sec bins |
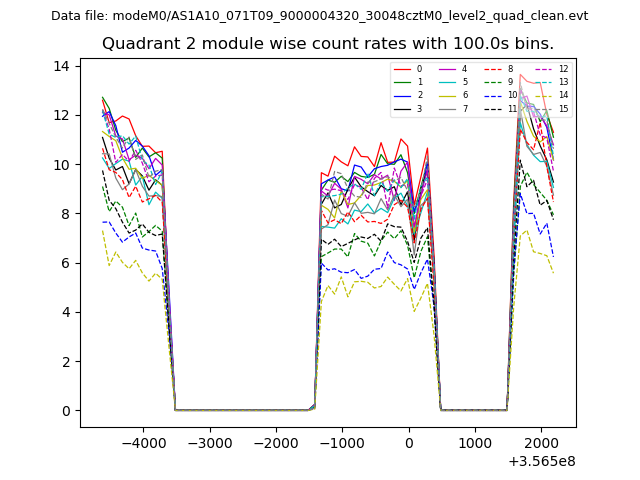 |
 |
| Module-wise count rates for Quadrant D Data is divided into 100 sec bins |
 |
 |
| Parameter | Plot |
|---|---|
| CZT HV Monitor |  |
| D_VDD | 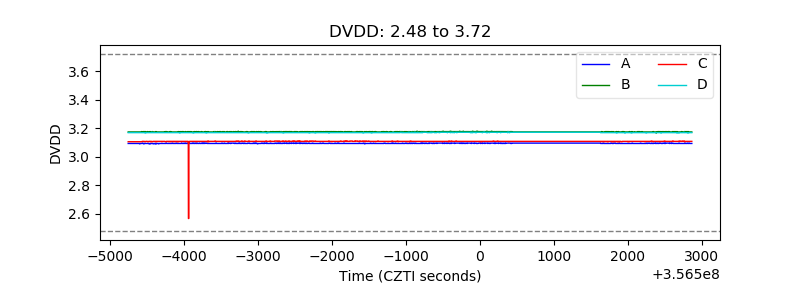 |
| Temperature 1 | 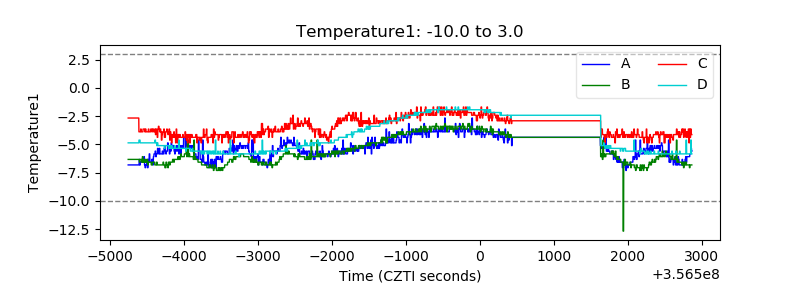 |
| Veto HV Monitor | 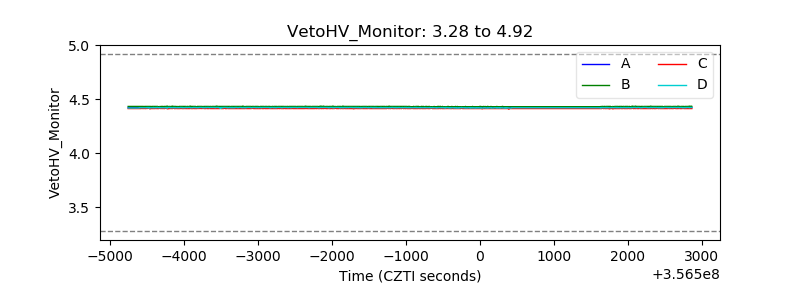 |
| Veto LLD | 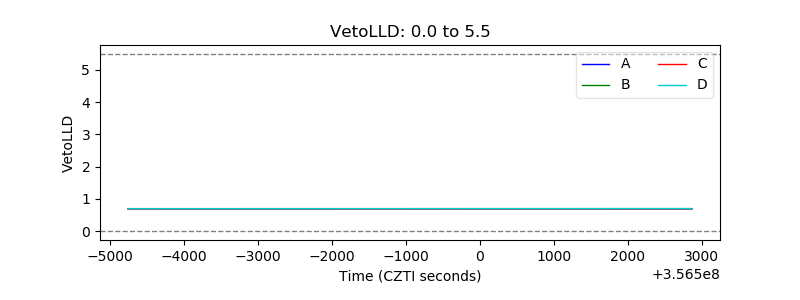 |
| Alpha Counter | 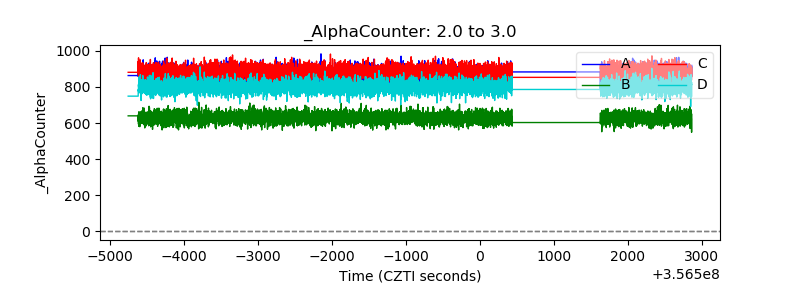 |
| _CPM_Rate | 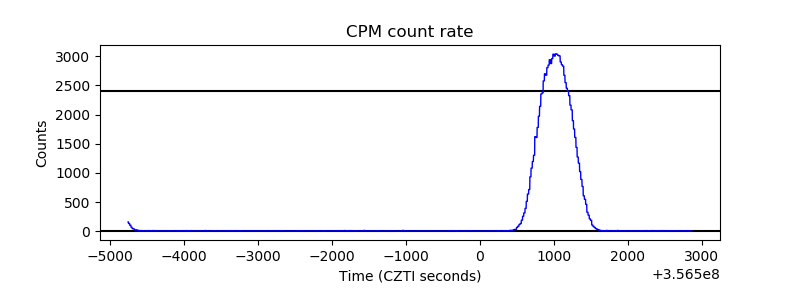 |
| CZT Counter | 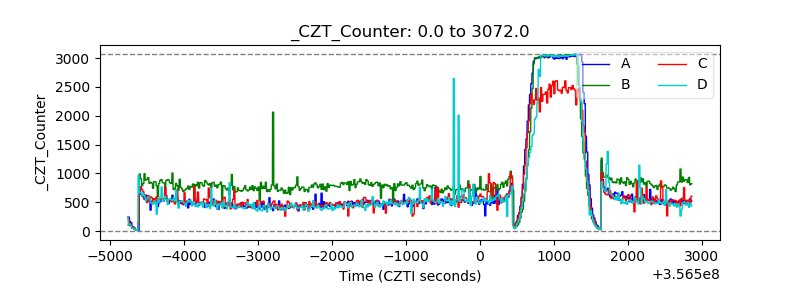 |
| +2.5 Volts monitor |  |
| +5 Volts monitor |  |
| _ROLL_ROT | 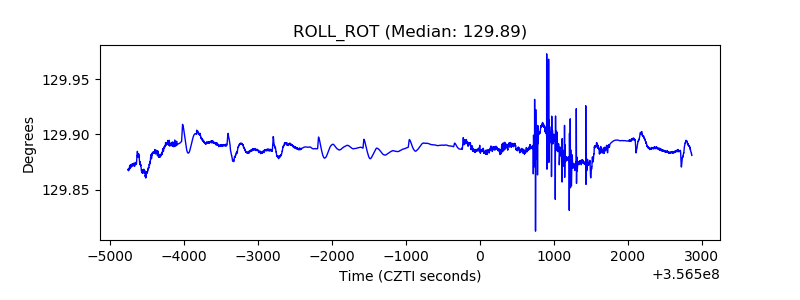 |
| _Roll_DEC | 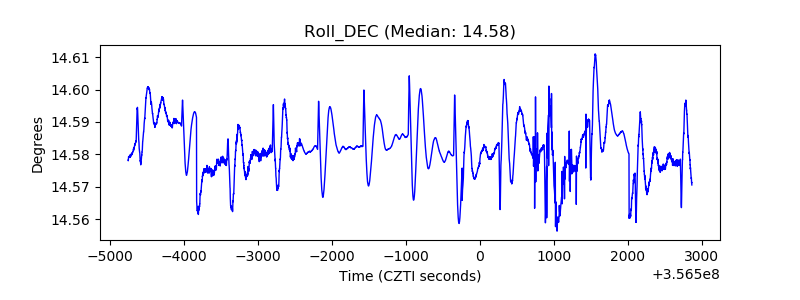 |
| _Roll_RA | 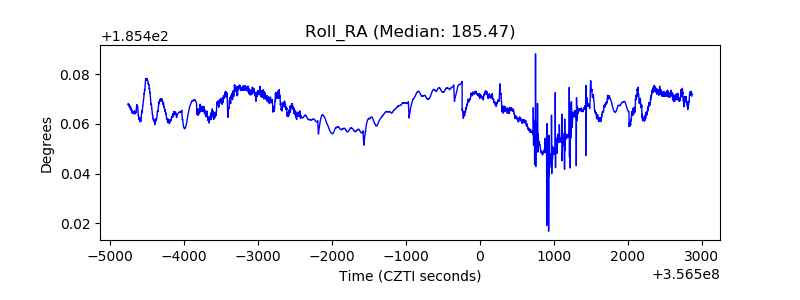 |
| Veto Counter | 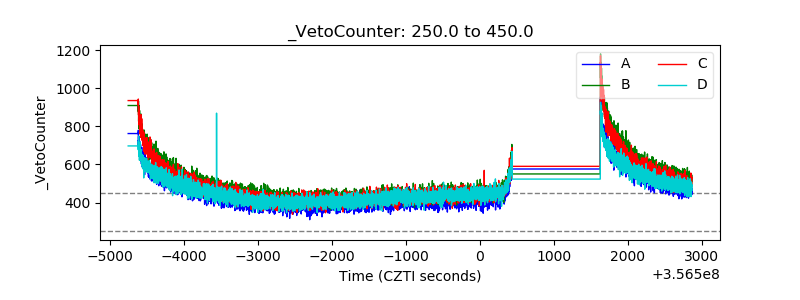 |