| Param | Original file | Final file |
|---|---|---|
| Filename | modeM0/AS1A10_071T09_9000004320_30049cztM0_level2.evt | modeM0/AS1A10_071T09_9000004320_30049cztM0_level2_quad_clean.evt |
| Size (bytes) | 506,459,520 | 74,125,440 |
| Size | 483.0 MB | 70.7 MB |
| Events in quadrant A | 3,311,096 | 466,509 |
| Events in quadrant B | 4,955,378 | 470,431 |
| Events in quadrant C | 3,398,660 | 441,150 |
| Events in quadrant D | 3,254,945 | 435,672 |
| Mode SS | |||
|---|---|---|---|
| Quadrant | BADHDUFLAG | Total packets | Discarded packets |
| A | 0 | 128 | 0 |
| B | 0 | 128 | 0 |
| C | 0 | 128 | 0 |
| D | 0 | 128 | 0 |
| Mode M0 | |||
|---|---|---|---|
| Quadrant | BADHDUFLAG | Total packets | Discarded packets |
| A | 0 | 13391 | 2 |
| B | 0 | 18875 | 2 |
| C | 0 | 13711 | 2 |
| D | 0 | 13297 | 2 |
| Mode M9 | |||
|---|---|---|---|
| Quadrant | BADHDUFLAG | Total packets | Discarded packets |
| A | 0 | 25 | 0 |
| B | 0 | 25 | 0 |
| C | 0 | 25 | 0 |
| D | 0 | 25 | 0 |
| Quadrant | Total seconds | Saturated seconds | Saturation percentage |
|---|---|---|---|
| A | 6167 | 47 | 0.762121% |
| B | 6167 | 78 | 1.264796% |
| C | 6167 | 180 | 2.918761% |
| D | 6167 | 22 | 0.356737% |
Noise dominated data is calculated using 1-second bins in cleaned event files. If a bin has >2000 counts, and if more than 50% of those come from <1% of pixels, then it is considered to be noise-dominated and hence unusable.
| Quadrant | # 1 sec bins | Bins with >0 counts | Bins with >2000 counts | High rate bins dominated by noise | Noise dominated (total time) | Noise dominated (detector-on time) | Marked lightcurve |
|---|---|---|---|---|---|---|---|
| A | 8662 | 6169 | 2 | 2 | 0.02% | 0.03% | 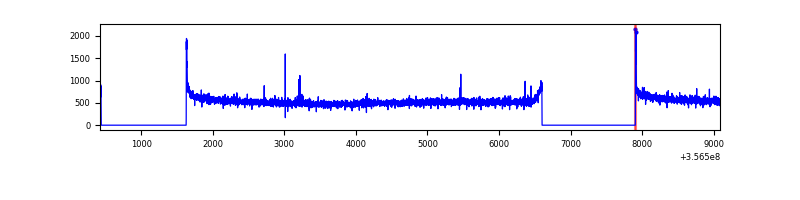 |
| B | 8662 | 6169 | 0 | 0 | 0.00% | 0.00% | 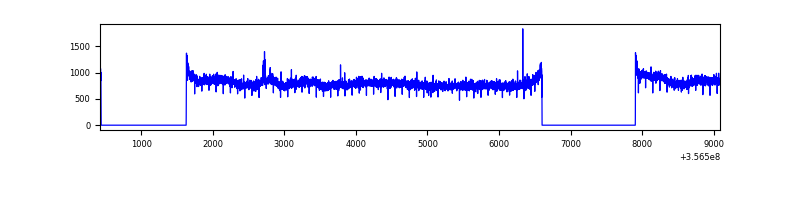 |
| C | 8662 | 6169 | 1 | 1 | 0.01% | 0.02% | 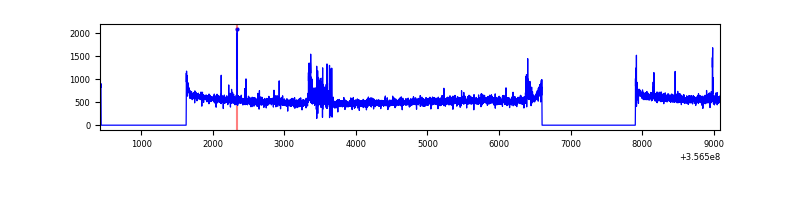 |
| D | 8662 | 6169 | 6 | 6 | 0.07% | 0.10% | 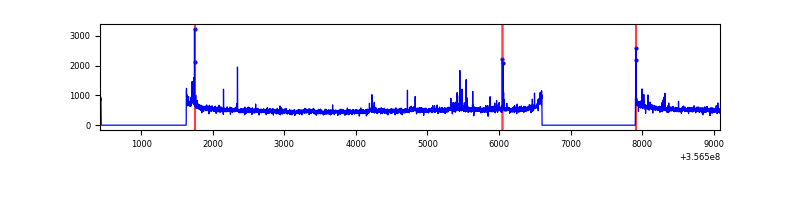 |
Top three noisy pixels from each quadrant. If the there are fewer than three noisy pixels in the level2.evt file, extra rows are filled as -1
| Pixel properties | Quadrant properties | ||||||
|---|---|---|---|---|---|---|---|
| Quadrant | DetID | PixID | Counts | Sigma | Mean | Median | Sigma |
| A | 8 | 192 | 25604 | 147.1 | 849 | 837 | 168.4 |
| A | 12 | 96 | 11716 | 64.62 | 849 | 837 | 168.4 |
| A | 13 | 254 | 10733 | 58.78 | 849 | 837 | 168.4 |
| B | 6 | 159 | 1624710 | 10286.19 | 841 | 824 | 157.9 |
| B | 12 | 111 | 19263 | 116.8 | 841 | 824 | 157.9 |
| B | 11 | 111 | 17426 | 105.16 | 841 | 824 | 157.9 |
| C | 14 | 238 | 172149 | 934.3 | 794 | 802 | 183.4 |
| C | 14 | 254 | 57207 | 307.56 | 794 | 802 | 183.4 |
| C | 3 | 233 | 40433 | 216.1 | 794 | 802 | 183.4 |
| D | 8 | 195 | 129263 | 683.78 | 800 | 785 | 187.9 |
| D | 2 | 250 | 29441 | 152.51 | 800 | 785 | 187.9 |
| D | 2 | 234 | 22212 | 114.04 | 800 | 785 | 187.9 |
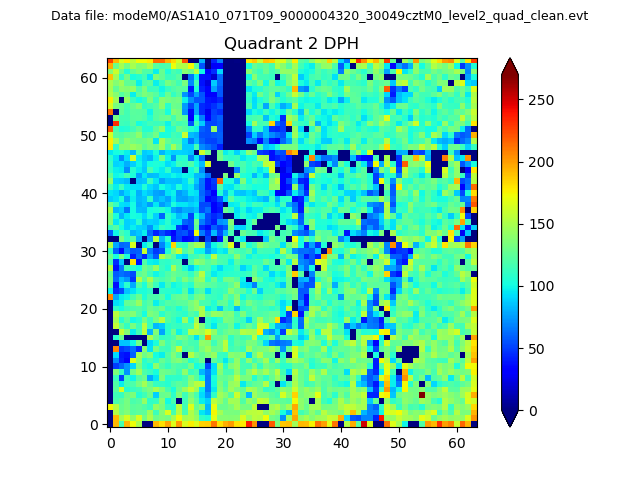
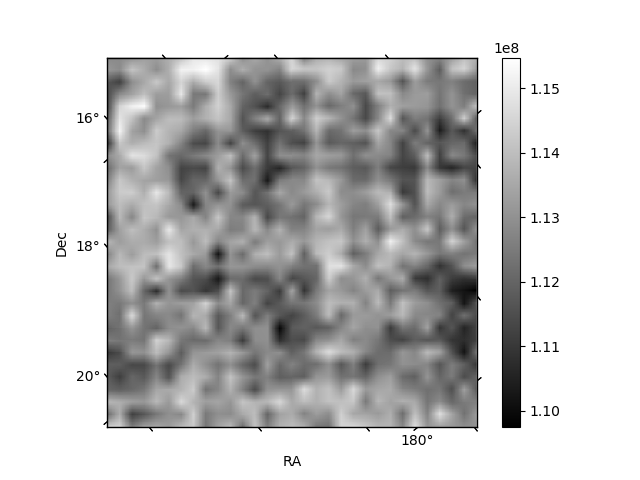
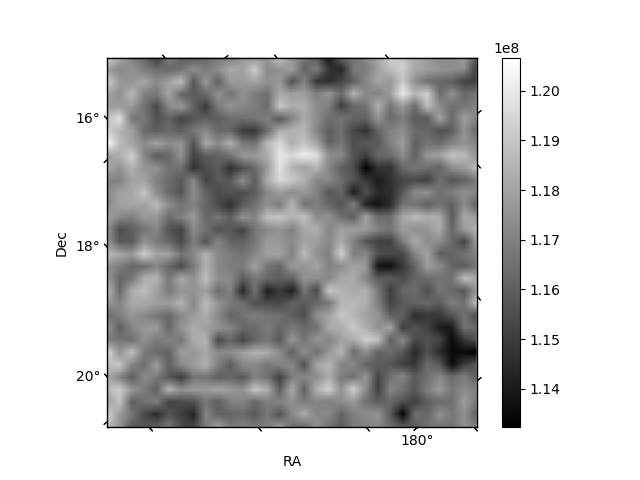
Histogram calculated using DETX and DETY for each event in the final _common_clean file
| Quadrant A |  |
 |
Quadrant B |
|---|---|---|---|
| Quadrant D |  |
 |
Quadrant C |
| Plot type | Count rate plots | Images |
|---|---|---|
| Comparison with Poisson distribution Blue bars denote a histogram of data divided into 1 sec bins. Red curve is a Poisson curve with rate = median count rate of data. |
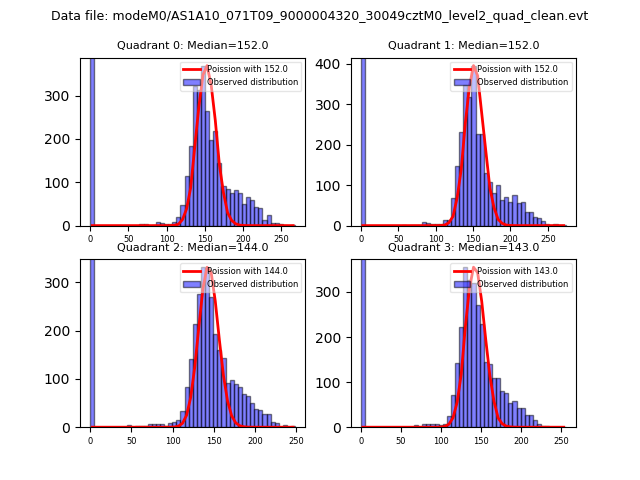 |
 |
| Quadrant-wise count rates Data is divided into 100 sec bins |
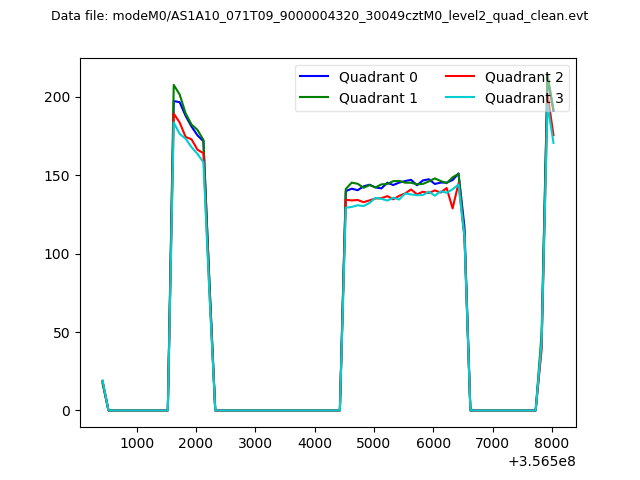 |
|
| Module-wise count rates for Quadrant A Data is divided into 100 sec bins |
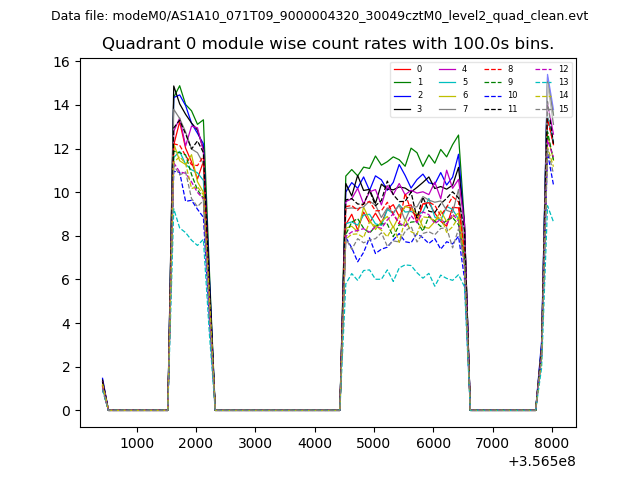 |
 |
| Module-wise count rates for Quadrant B Data is divided into 100 sec bins |
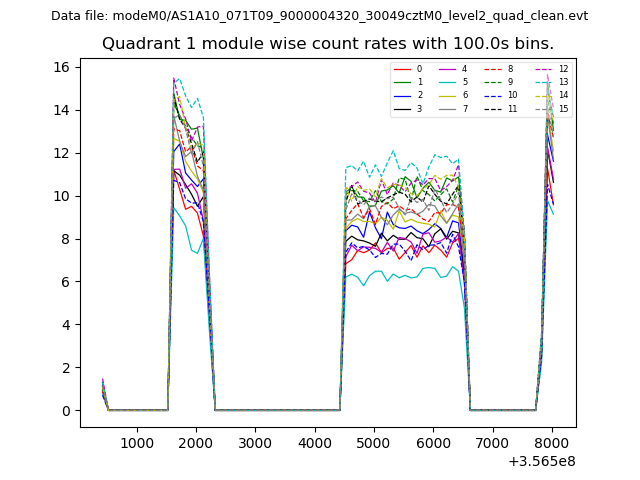 |
 |
| Module-wise count rates for Quadrant C Data is divided into 100 sec bins |
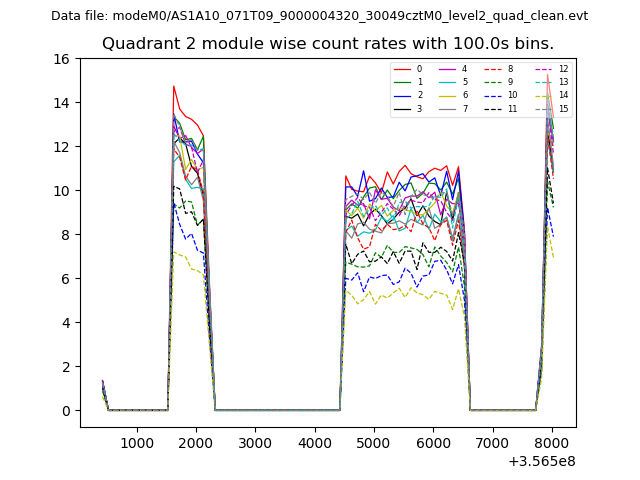 |
 |
| Module-wise count rates for Quadrant D Data is divided into 100 sec bins |
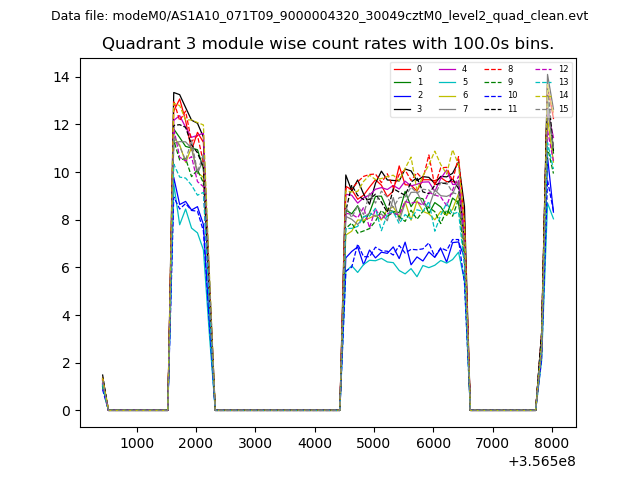 |
 |
| Parameter | Plot |
|---|---|
| CZT HV Monitor | 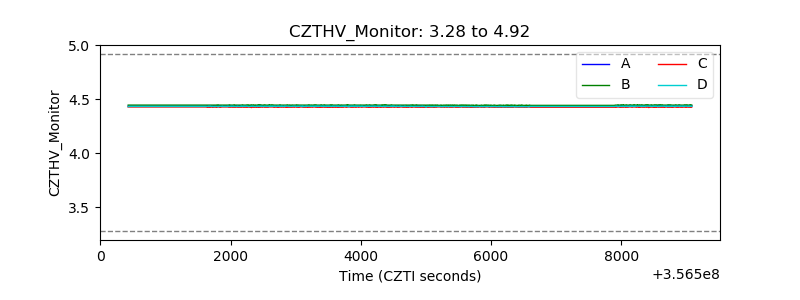 |
| D_VDD | 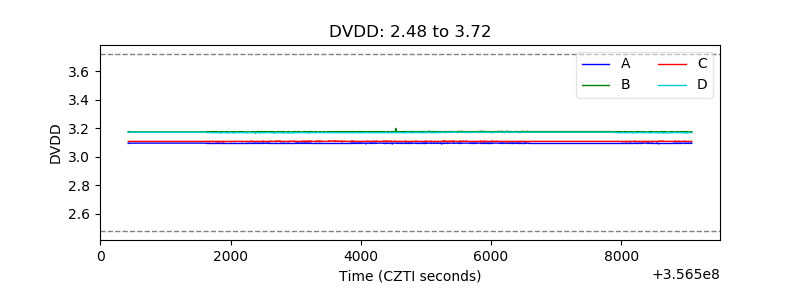 |
| Temperature 1 | 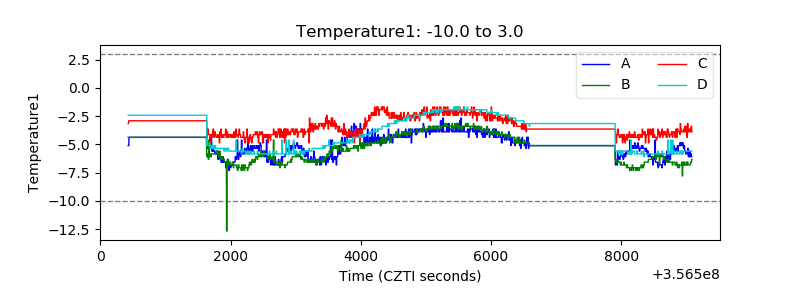 |
| Veto HV Monitor | 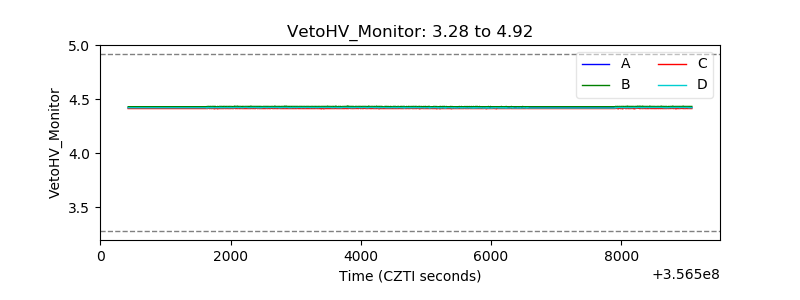 |
| Veto LLD | 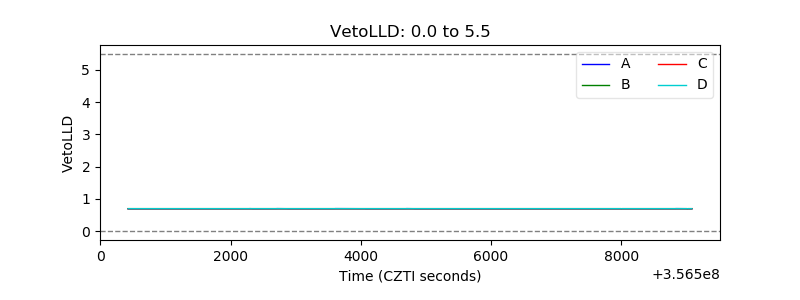 |
| Alpha Counter |  |
| _CPM_Rate | 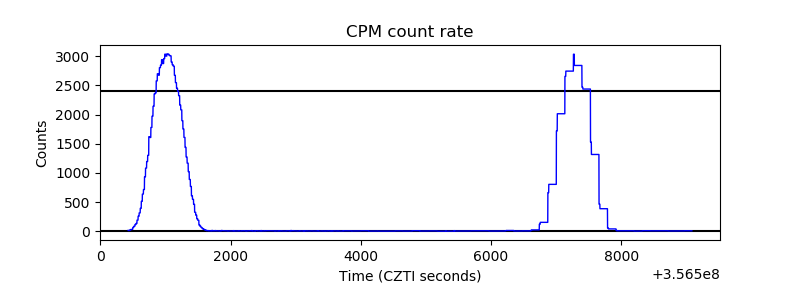 |
| CZT Counter | 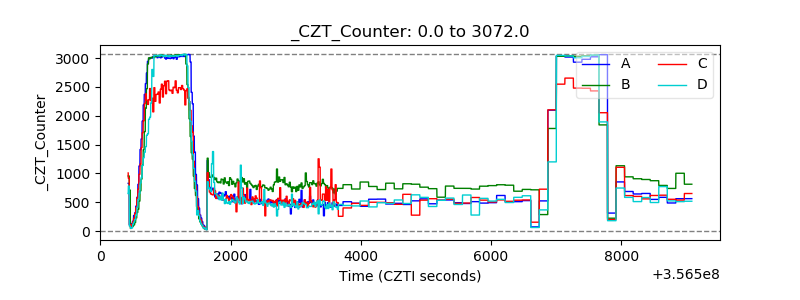 |
| +2.5 Volts monitor |  |
| +5 Volts monitor |  |
| _ROLL_ROT | 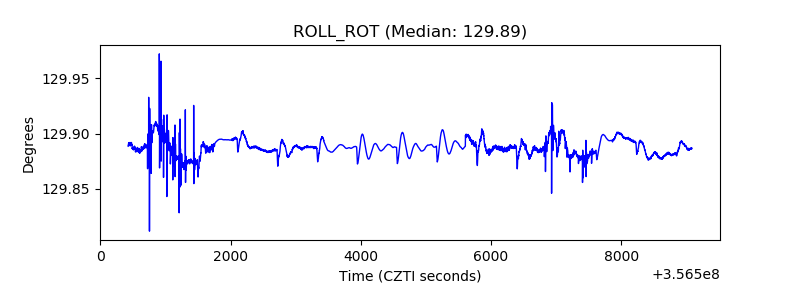 |
| _Roll_DEC | 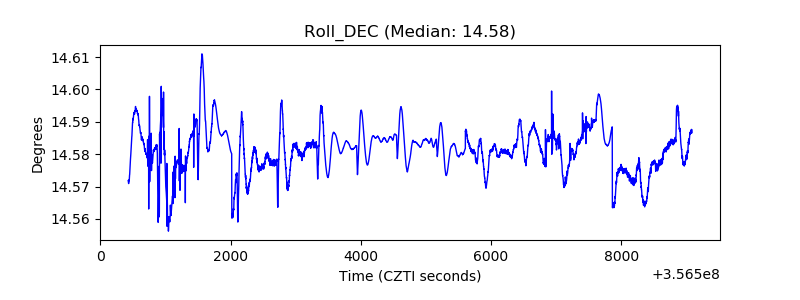 |
| _Roll_RA | 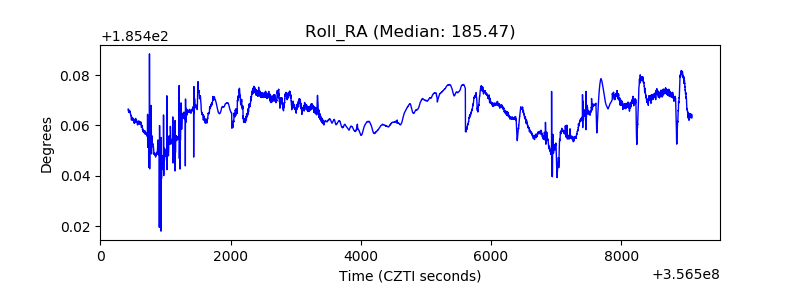 |
| Veto Counter | 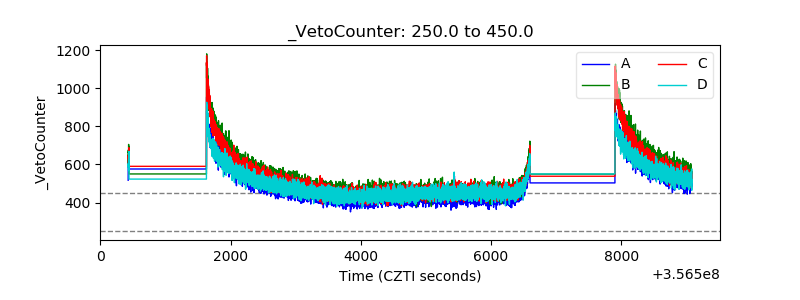 |