| Param | Original file | Final file |
|---|---|---|
| Filename | modeM0/AS1A10_071T09_9000004320_30051cztM0_level2.evt | modeM0/AS1A10_071T09_9000004320_30051cztM0_level2_quad_clean.evt |
| Size (bytes) | 523,892,160 | 70,038,720 |
| Size | 499.6 MB | 66.8 MB |
| Events in quadrant A | 3,400,444 | 434,079 |
| Events in quadrant B | 5,151,768 | 434,424 |
| Events in quadrant C | 3,535,486 | 409,320 |
| Events in quadrant D | 3,356,836 | 408,354 |
| Mode SS | |||
|---|---|---|---|
| Quadrant | BADHDUFLAG | Total packets | Discarded packets |
| A | 0 | 126 | 0 |
| B | 0 | 126 | 0 |
| C | 0 | 126 | 0 |
| D | 0 | 126 | 0 |
| Mode M0 | |||
|---|---|---|---|
| Quadrant | BADHDUFLAG | Total packets | Discarded packets |
| A | 0 | 13582 | 2 |
| B | 0 | 19329 | 2 |
| C | 0 | 13991 | 2 |
| D | 0 | 13448 | 2 |
| Mode M9 | |||
|---|---|---|---|
| Quadrant | BADHDUFLAG | Total packets | Discarded packets |
| A | 0 | 19 | 0 |
| B | 0 | 20 | 0 |
| C | 0 | 20 | 0 |
| D | 0 | 20 | 0 |
| Quadrant | Total seconds | Saturated seconds | Saturation percentage |
|---|---|---|---|
| A | 6226 | 86 | 1.381304% |
| B | 6226 | 150 | 2.409252% |
| C | 6226 | 128 | 2.055895% |
| D | 6226 | 41 | 0.658529% |
Noise dominated data is calculated using 1-second bins in cleaned event files. If a bin has >2000 counts, and if more than 50% of those come from <1% of pixels, then it is considered to be noise-dominated and hence unusable.
| Quadrant | # 1 sec bins | Bins with >0 counts | Bins with >2000 counts | High rate bins dominated by noise | Noise dominated (total time) | Noise dominated (detector-on time) | Marked lightcurve |
|---|---|---|---|---|---|---|---|
| A | 7496 | 6227 | 1 | 1 | 0.01% | 0.02% | 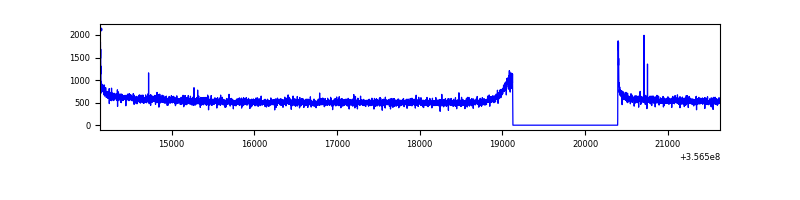 |
| B | 7496 | 6227 | 2 | 2 | 0.03% | 0.03% | 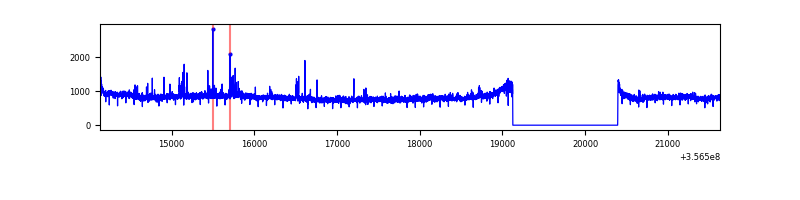 |
| C | 7496 | 6227 | 11 | 11 | 0.15% | 0.18% | 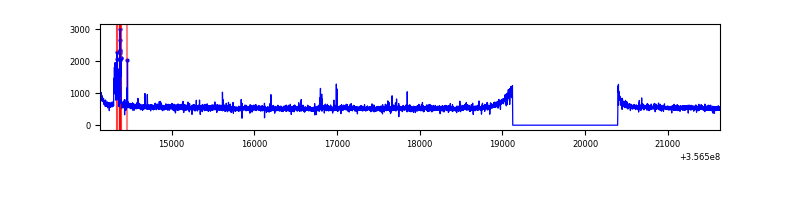 |
| D | 7496 | 6227 | 4 | 4 | 0.05% | 0.06% | 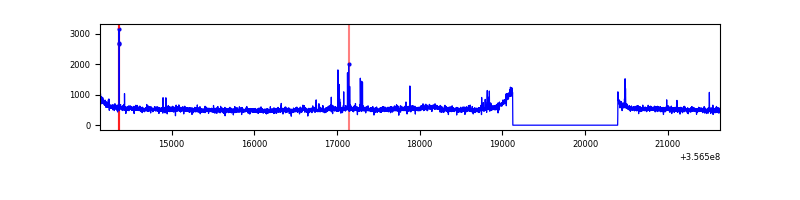 |
Top three noisy pixels from each quadrant. If the there are fewer than three noisy pixels in the level2.evt file, extra rows are filled as -1
| Pixel properties | Quadrant properties | ||||||
|---|---|---|---|---|---|---|---|
| Quadrant | DetID | PixID | Counts | Sigma | Mean | Median | Sigma |
| A | 8 | 192 | 24523 | 137.5 | 873 | 859 | 172.1 |
| A | 13 | 254 | 11596 | 62.39 | 873 | 859 | 172.1 |
| A | 12 | 96 | 8710 | 45.62 | 873 | 859 | 172.1 |
| B | 6 | 159 | 1661105 | 10289.86 | 858 | 839 | 161.3 |
| B | 5 | 255 | 117750 | 724.58 | 858 | 839 | 161.3 |
| B | 12 | 111 | 19630 | 116.46 | 858 | 839 | 161.3 |
| C | 14 | 238 | 138156 | 721.34 | 819 | 826 | 190.4 |
| C | 3 | 233 | 115162 | 600.56 | 819 | 826 | 190.4 |
| C | 15 | 208 | 75160 | 390.45 | 819 | 826 | 190.4 |
| D | 8 | 195 | 148445 | 768.0 | 826 | 810 | 192.2 |
| D | 2 | 250 | 31612 | 160.23 | 826 | 810 | 192.2 |
| D | 7 | 223 | 22665 | 113.69 | 826 | 810 | 192.2 |
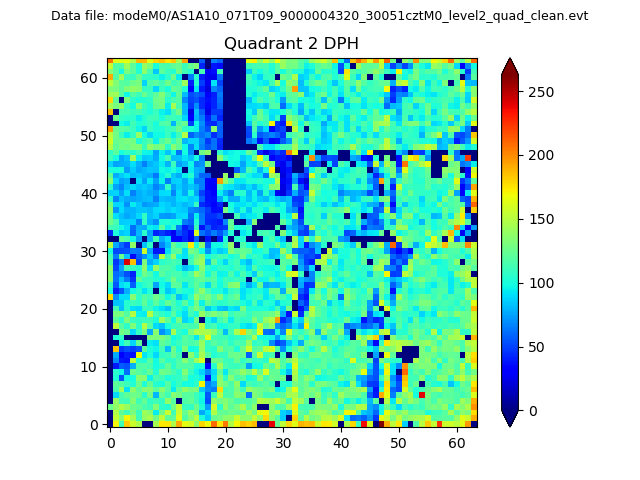
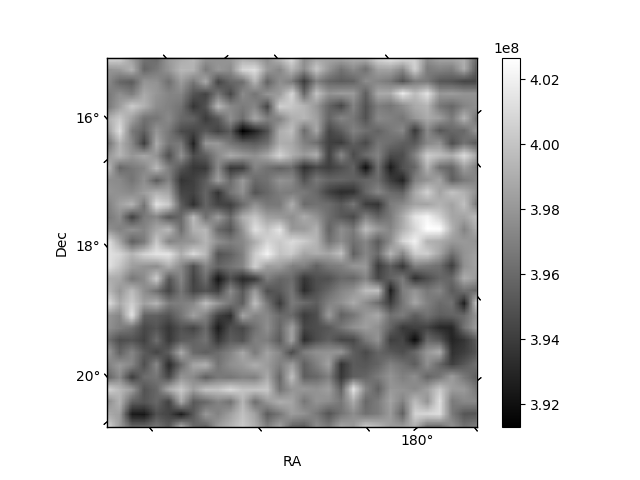
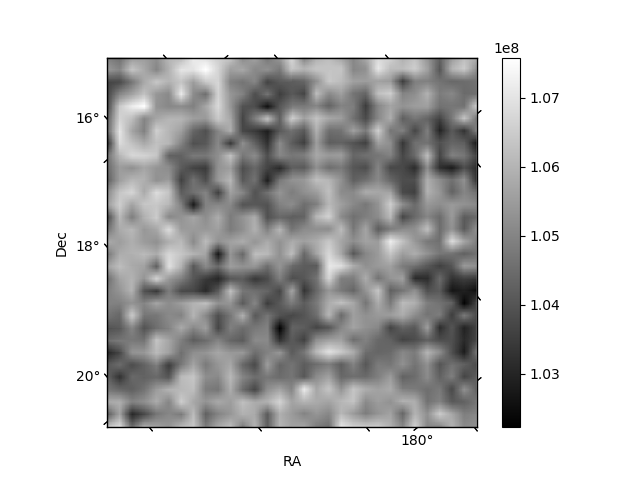
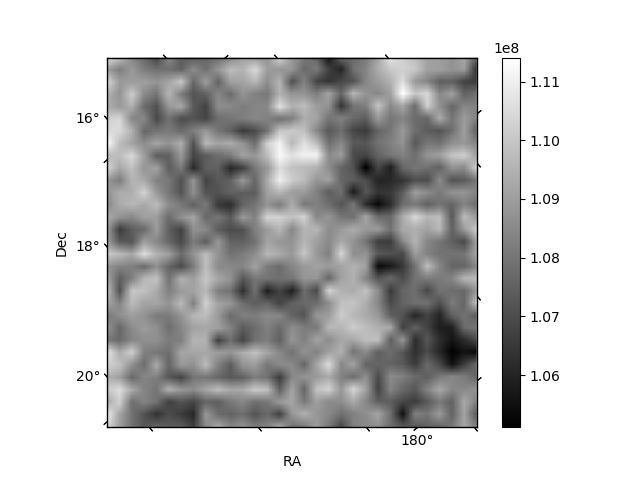
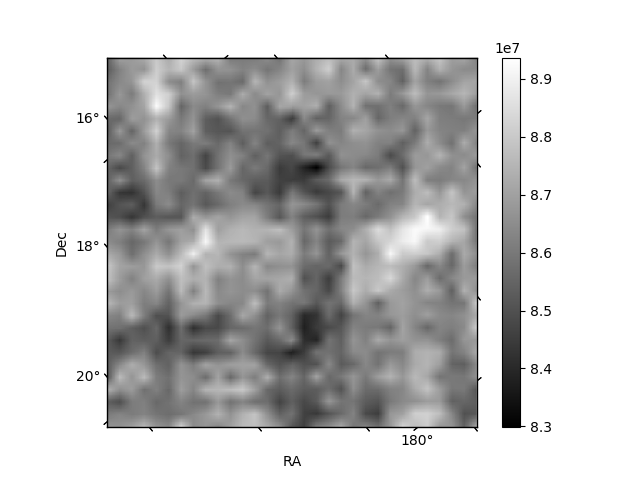
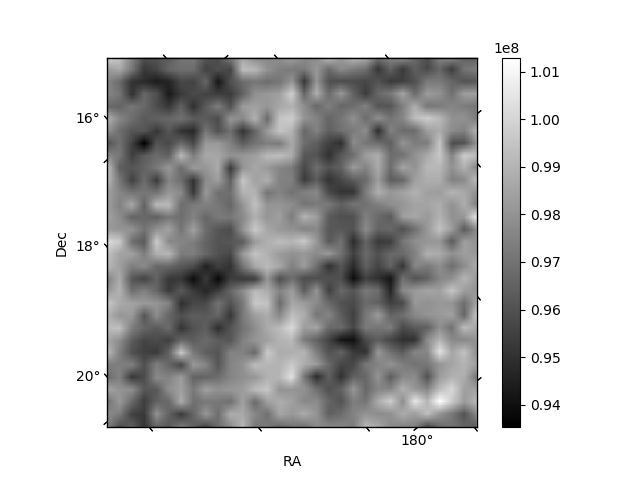
Histogram calculated using DETX and DETY for each event in the final _common_clean file
| Quadrant A | 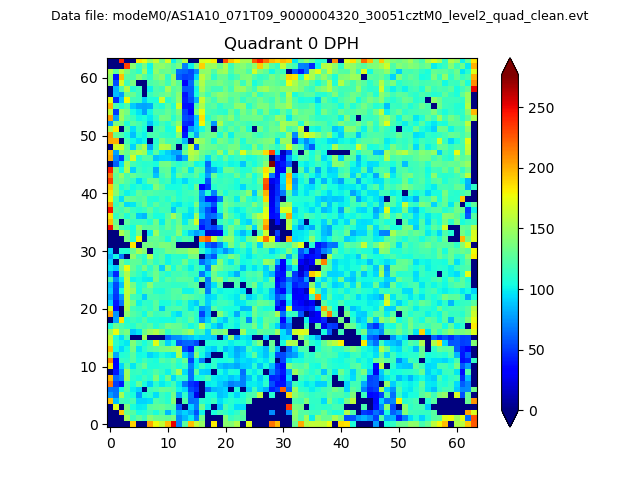 |
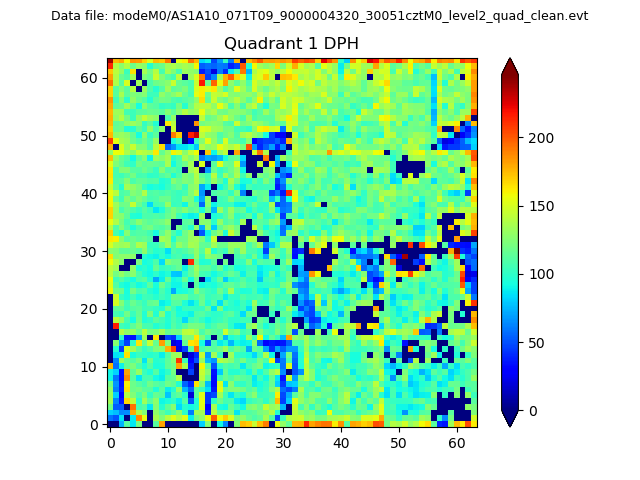 |
Quadrant B |
|---|---|---|---|
| Quadrant D | 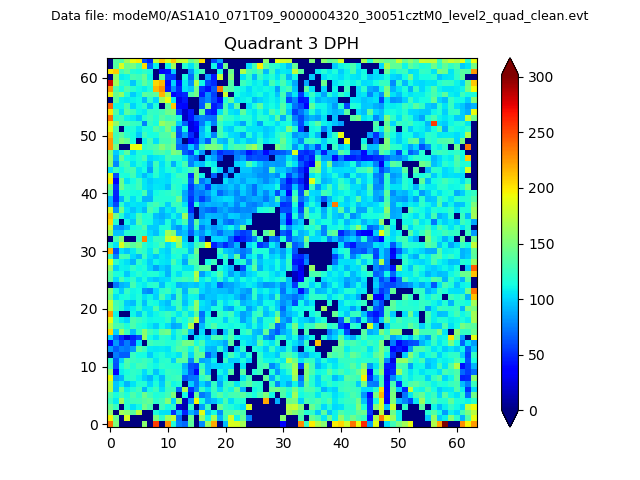 |
 |
Quadrant C |
| Plot type | Count rate plots | Images |
|---|---|---|
| Comparison with Poisson distribution Blue bars denote a histogram of data divided into 1 sec bins. Red curve is a Poisson curve with rate = median count rate of data. |
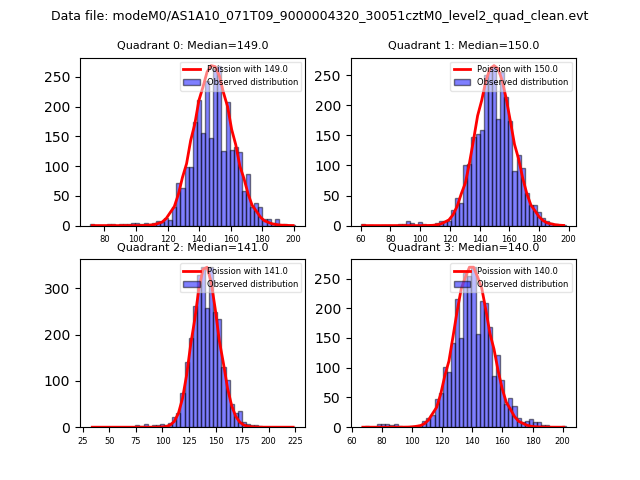 |
 |
| Quadrant-wise count rates Data is divided into 100 sec bins |
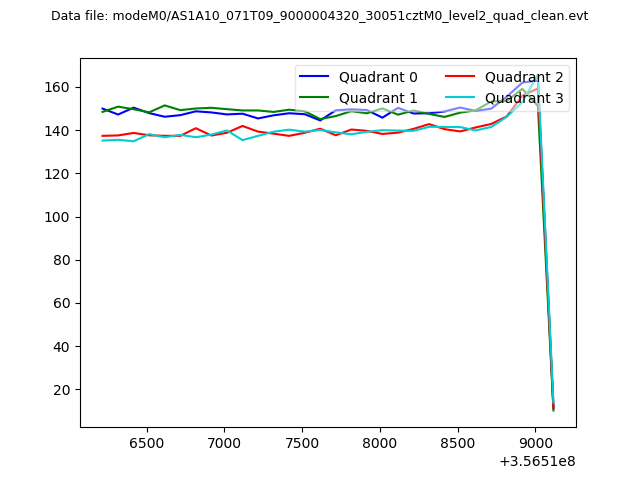 |
|
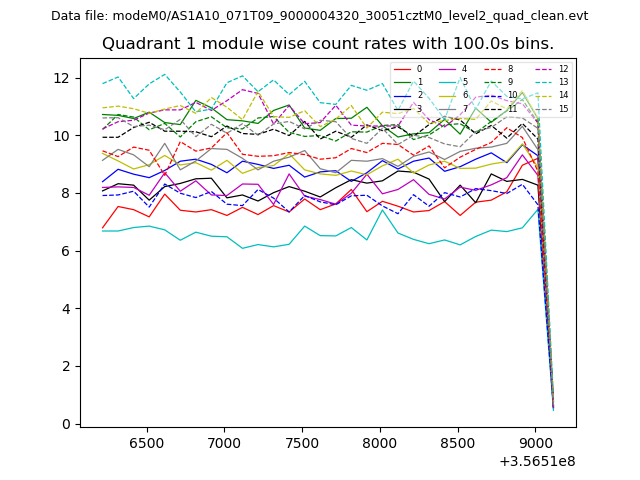
| Module-wise count rates for Quadrant A Data is divided into 100 sec bins |
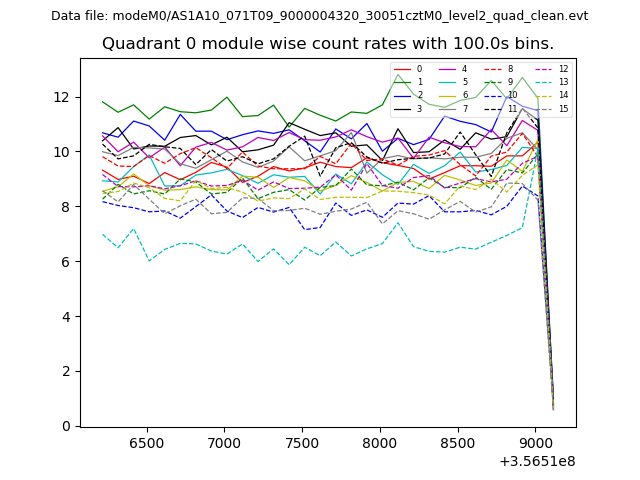 |
 |
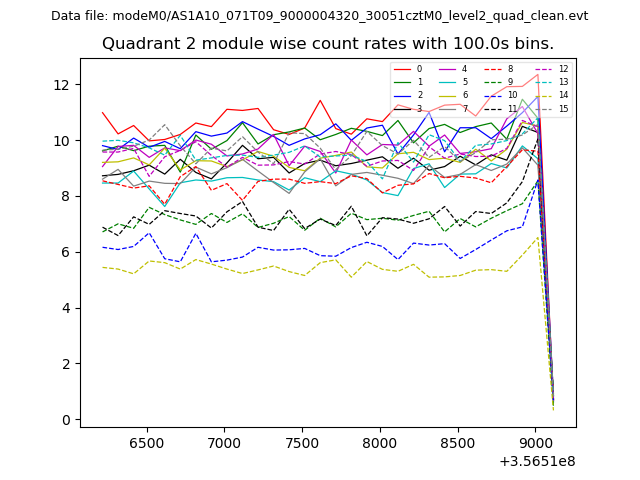
| Module-wise count rates for Quadrant B Data is divided into 100 sec bins |
 |
 |
| Module-wise count rates for Quadrant C Data is divided into 100 sec bins |
 |
 |
| Module-wise count rates for Quadrant D Data is divided into 100 sec bins |
 |
 |
| Parameter | Plot |
|---|---|
| CZT HV Monitor | 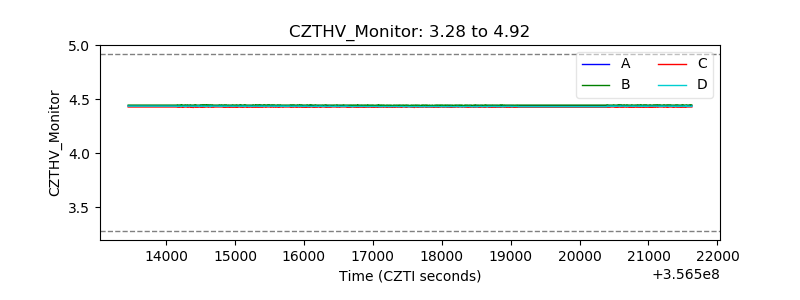 |
| D_VDD | 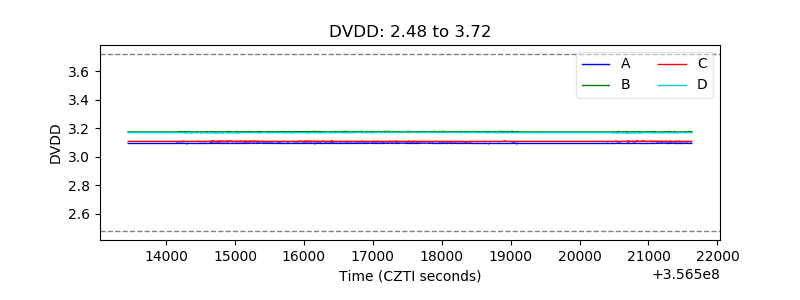 |
| Temperature 1 | 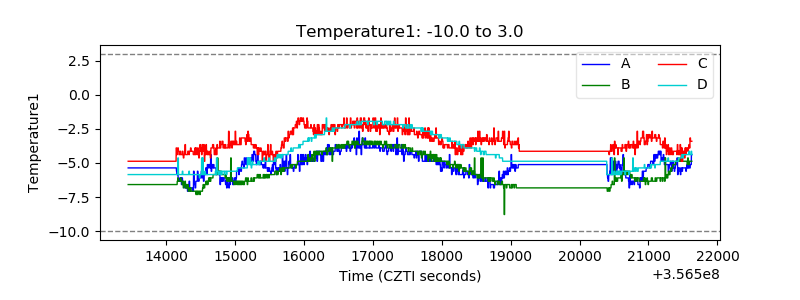 |
| Veto HV Monitor | 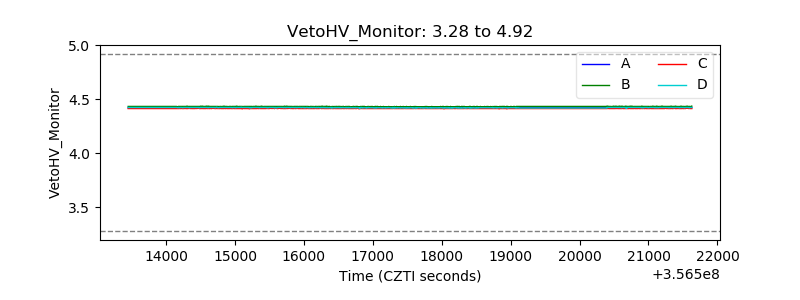 |
| Veto LLD | 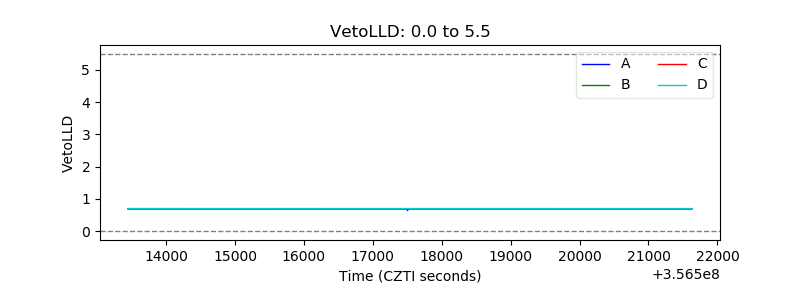 |
| Alpha Counter | 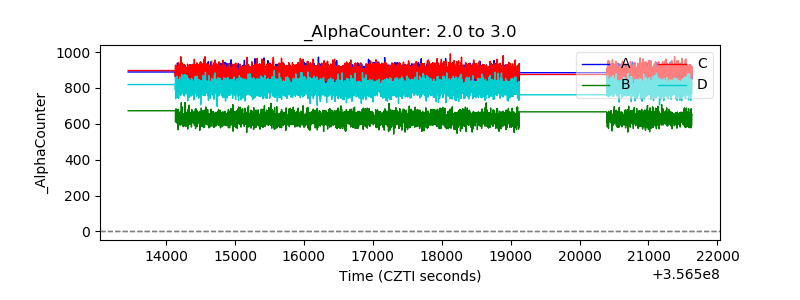 |
| _CPM_Rate | 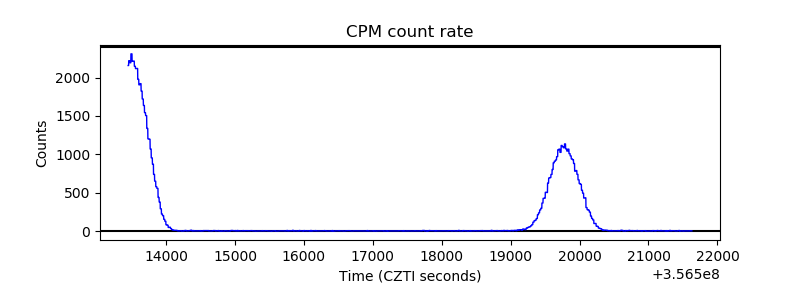 |
| CZT Counter | 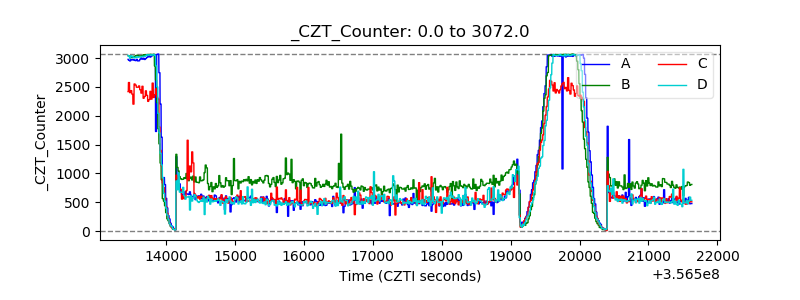 |
| +2.5 Volts monitor | 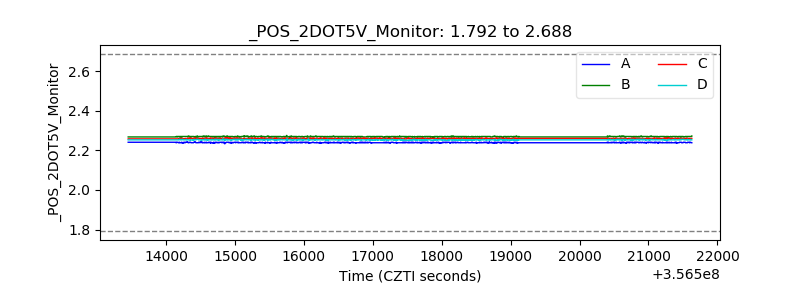 |
| +5 Volts monitor | 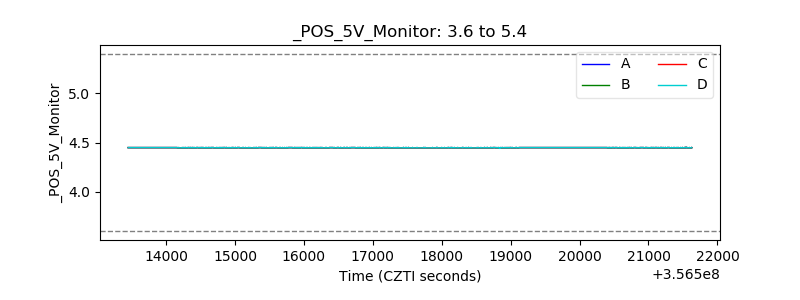 |
| _ROLL_ROT | 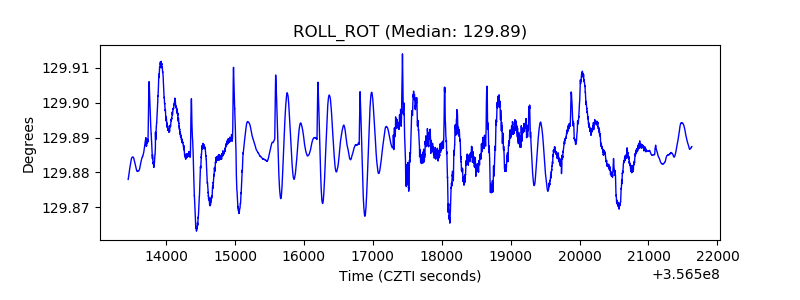 |
| _Roll_DEC | 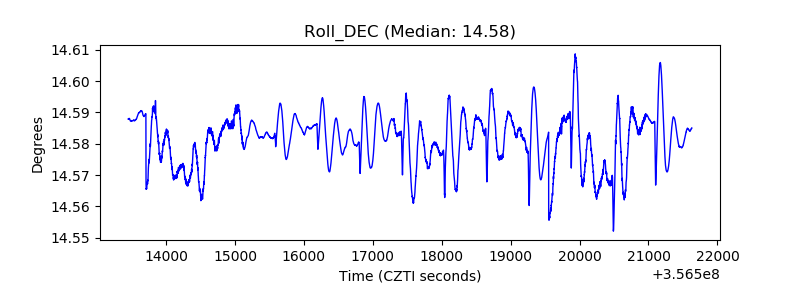 |
| _Roll_RA | 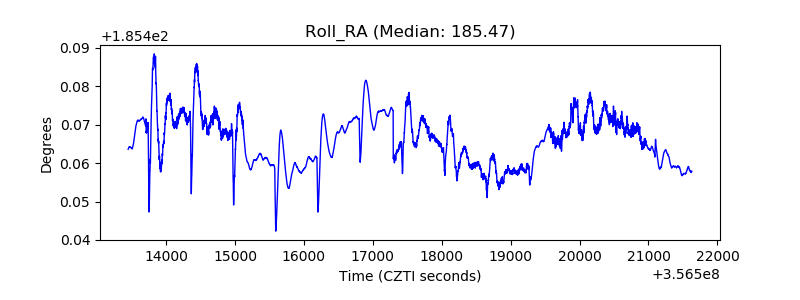 |
| Veto Counter | 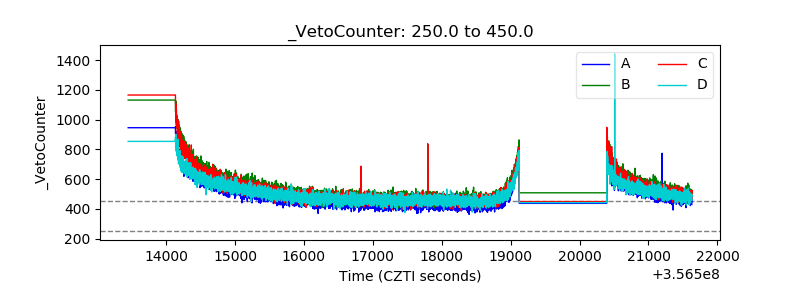 |