| Param | Original file | Final file |
|---|---|---|
| Filename | modeM0/AS1A10_071T09_9000004320_30053cztM0_level2.evt | modeM0/AS1A10_071T09_9000004320_30053cztM0_level2_quad_clean.evt |
| Size (bytes) | 585,901,440 | 96,528,960 |
| Size | 558.8 MB | 92.1 MB |
| Events in quadrant A | 3,733,903 | 621,054 |
| Events in quadrant B | 5,741,916 | 613,119 |
| Events in quadrant C | 3,862,902 | 588,044 |
| Events in quadrant D | 3,907,823 | 589,885 |
| Mode SS | |||
|---|---|---|---|
| Quadrant | BADHDUFLAG | Total packets | Discarded packets |
| A | 0 | 152 | 0 |
| B | 0 | 152 | 0 |
| C | 0 | 152 | 0 |
| D | 0 | 152 | 0 |
| Mode M0 | |||
|---|---|---|---|
| Quadrant | BADHDUFLAG | Total packets | Discarded packets |
| A | 0 | 15500 | 2 |
| B | 0 | 22437 | 2 |
| C | 0 | 15802 | 2 |
| D | 0 | 16012 | 2 |
| Mode M9 | |||
|---|---|---|---|
| Quadrant | BADHDUFLAG | Total packets | Discarded packets |
| A | 0 | 17 | 0 |
| B | 0 | 17 | 0 |
| C | 0 | 17 | 0 |
| D | 0 | 17 | 0 |
| Quadrant | Total seconds | Saturated seconds | Saturation percentage |
|---|---|---|---|
| A | 7336 | 209 | 2.848964% |
| B | 7337 | 331 | 4.511381% |
| C | 7337 | 246 | 3.352869% |
| D | 7337 | 128 | 1.744582% |
Noise dominated data is calculated using 1-second bins in cleaned event files. If a bin has >2000 counts, and if more than 50% of those come from <1% of pixels, then it is considered to be noise-dominated and hence unusable.
| Quadrant | # 1 sec bins | Bins with >0 counts | Bins with >2000 counts | High rate bins dominated by noise | Noise dominated (total time) | Noise dominated (detector-on time) | Marked lightcurve |
|---|---|---|---|---|---|---|---|
| A | 9106 | 7338 | 1 | 1 | 0.01% | 0.01% | 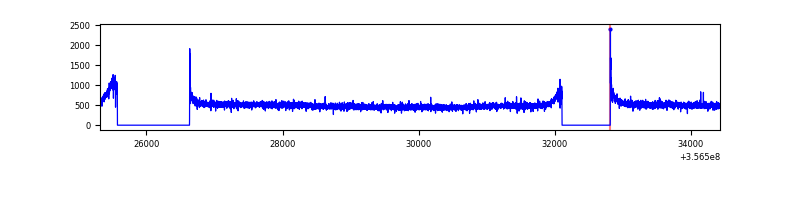 |
| B | 9107 | 7339 | 17 | 17 | 0.19% | 0.23% | 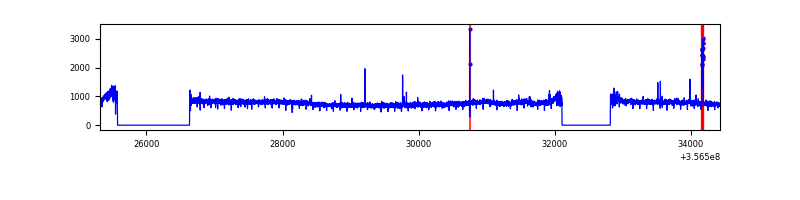 |
| C | 9107 | 7339 | 0 | 0 | 0.00% | 0.00% | 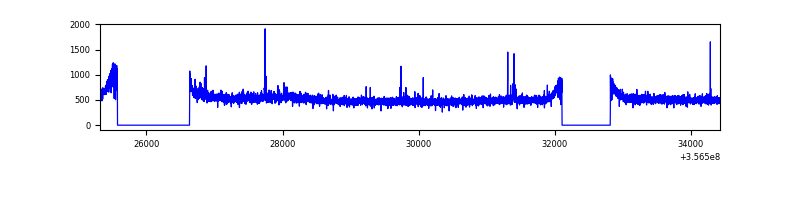 |
| D | 9107 | 7339 | 0 | 0 | 0.00% | 0.00% | 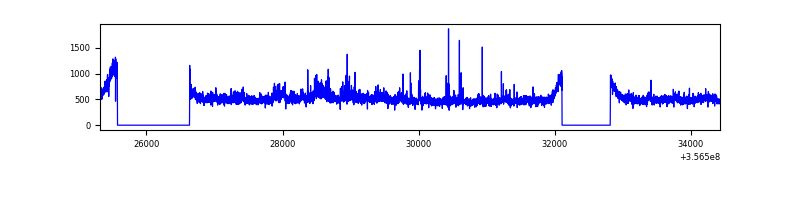 |
Top three noisy pixels from each quadrant. If the there are fewer than three noisy pixels in the level2.evt file, extra rows are filled as -1
| Pixel properties | Quadrant properties | ||||||
|---|---|---|---|---|---|---|---|
| Quadrant | DetID | PixID | Counts | Sigma | Mean | Median | Sigma |
| A | 8 | 192 | 25136 | 124.97 | 961 | 943 | 193.6 |
| A | 13 | 254 | 13177 | 63.2 | 961 | 943 | 193.6 |
| A | 3 | 137 | 9918 | 46.36 | 961 | 943 | 193.6 |
| B | 6 | 159 | 1999117 | 10880.44 | 935 | 911 | 183.7 |
| B | 0 | 229 | 39141 | 208.17 | 935 | 911 | 183.7 |
| B | 12 | 111 | 22957 | 120.04 | 935 | 911 | 183.7 |
| C | 14 | 238 | 151473 | 707.76 | 910 | 917 | 212.7 |
| C | 3 | 233 | 120499 | 562.15 | 910 | 917 | 212.7 |
| C | 15 | 208 | 19430 | 87.03 | 910 | 917 | 212.7 |
| D | 8 | 195 | 352853 | 1617.87 | 923 | 904 | 217.5 |
| D | 2 | 250 | 30123 | 134.32 | 923 | 904 | 217.5 |
| D | 2 | 234 | 26733 | 118.73 | 923 | 904 | 217.5 |
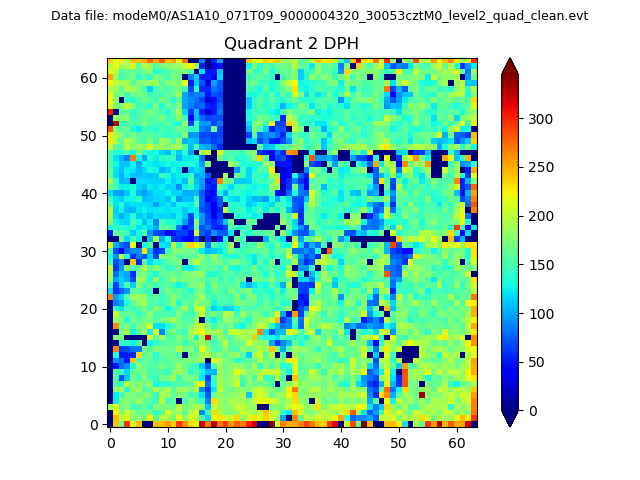
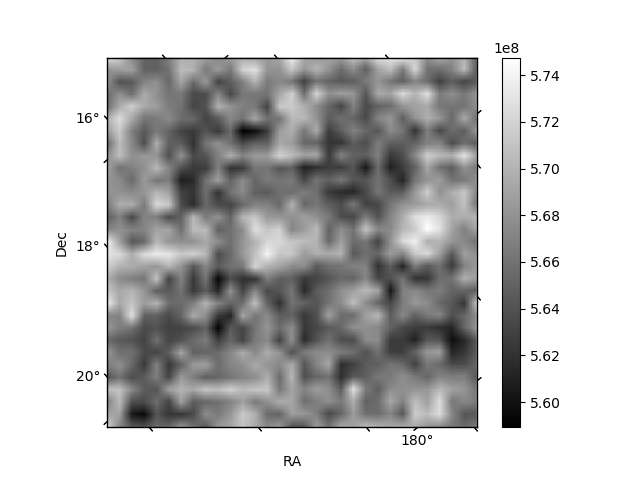
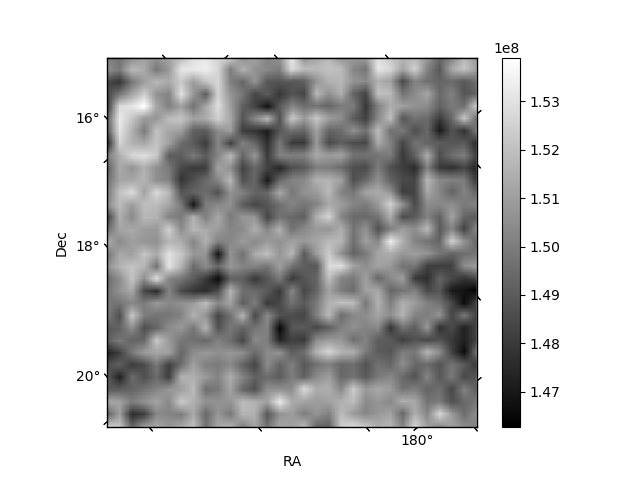
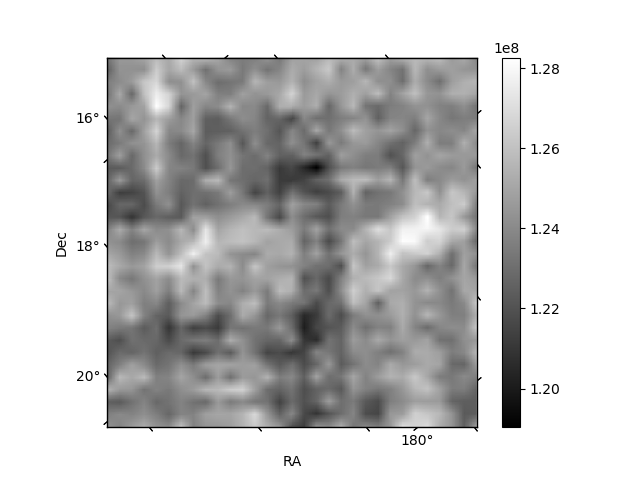
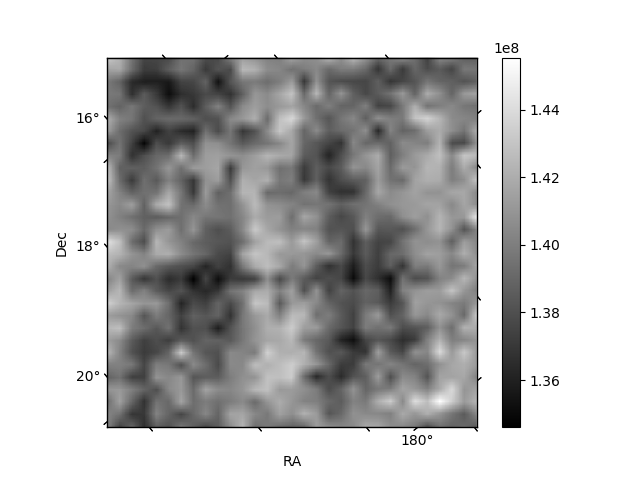
Histogram calculated using DETX and DETY for each event in the final _common_clean file
| Quadrant A | 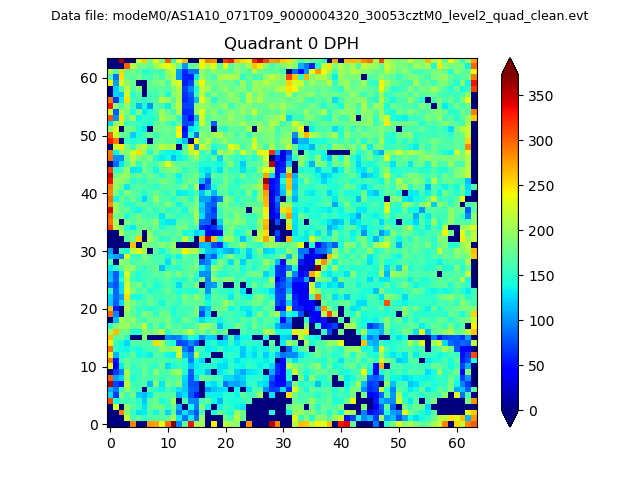 |
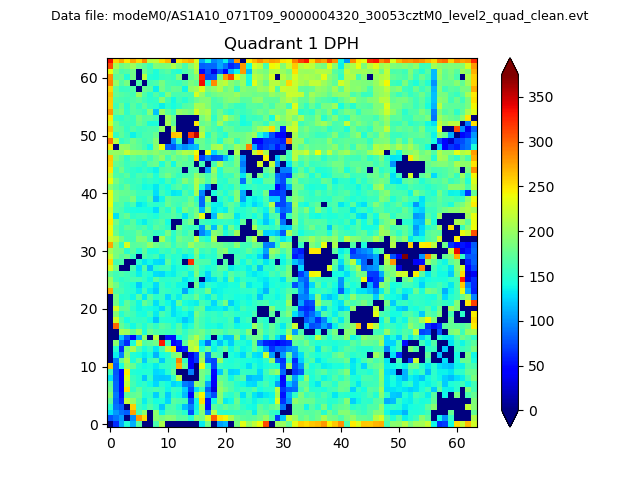 |
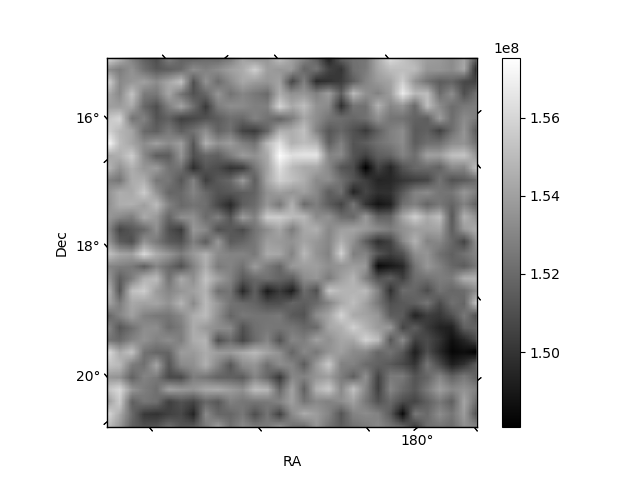
Quadrant B |
|---|---|---|---|
| Quadrant D | 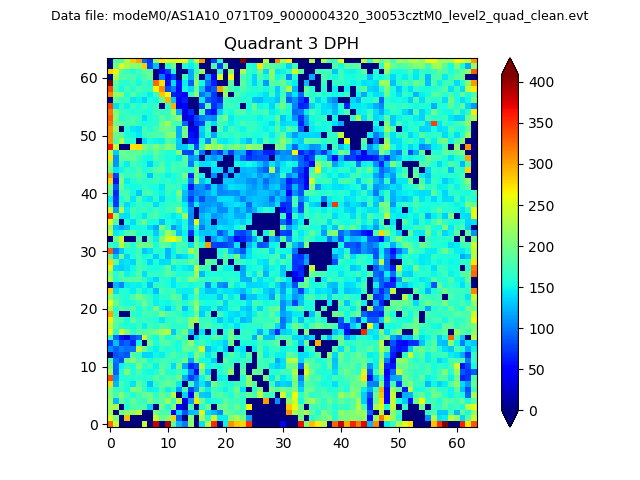 |
 |
Quadrant C |
| Plot type | Count rate plots | Images |
|---|---|---|
| Comparison with Poisson distribution Blue bars denote a histogram of data divided into 1 sec bins. Red curve is a Poisson curve with rate = median count rate of data. |
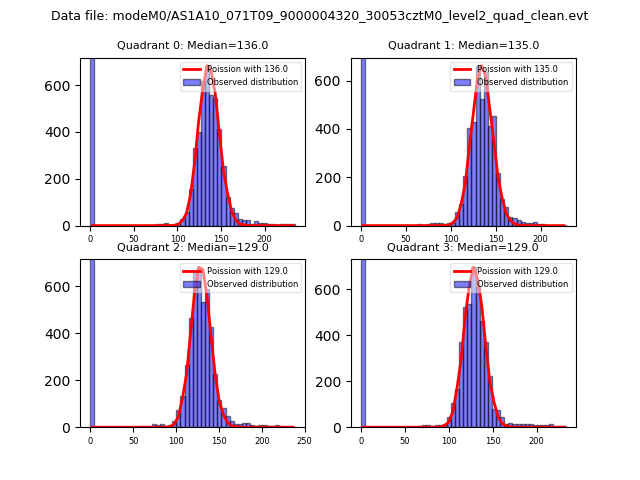 |
 |
| Quadrant-wise count rates Data is divided into 100 sec bins |
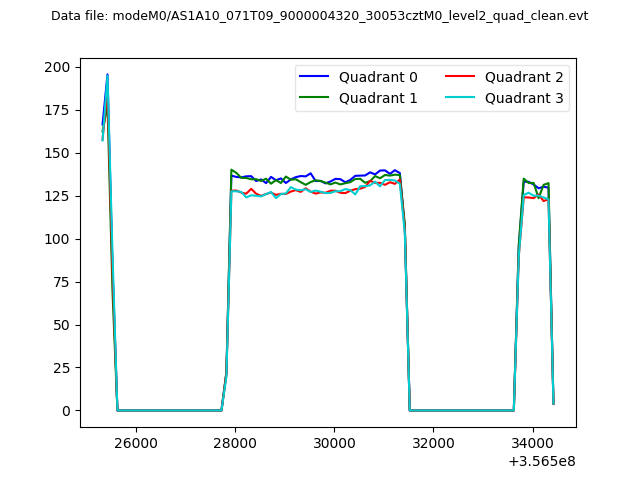 |
|
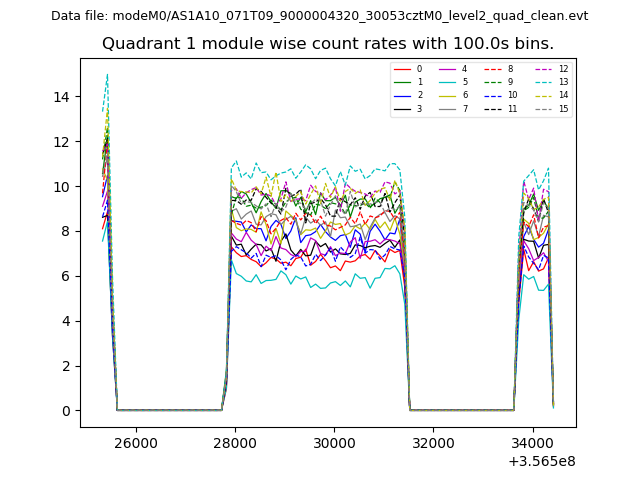
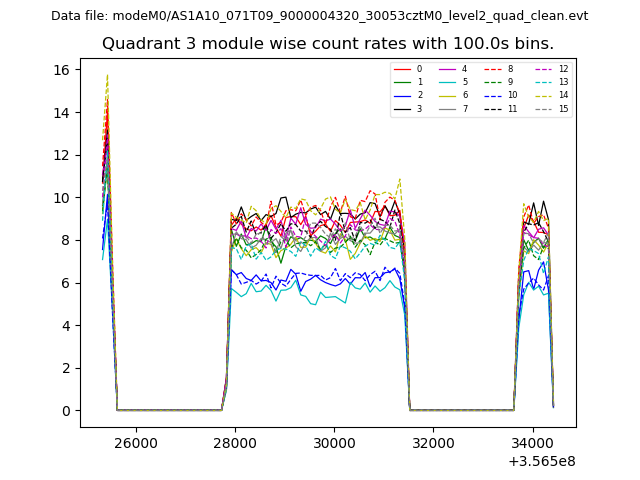
| Module-wise count rates for Quadrant A Data is divided into 100 sec bins |
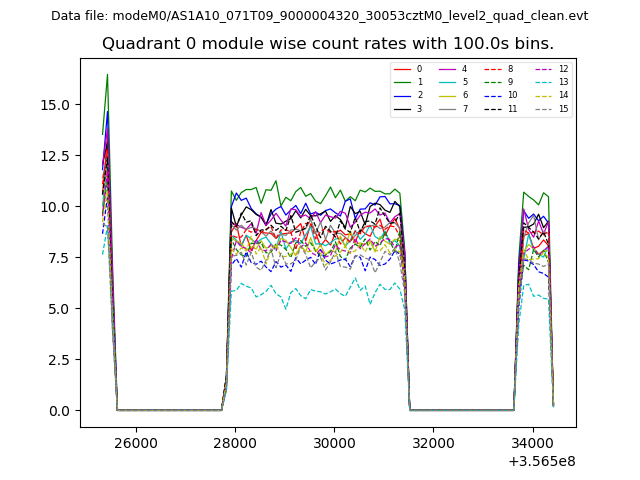 |
 |
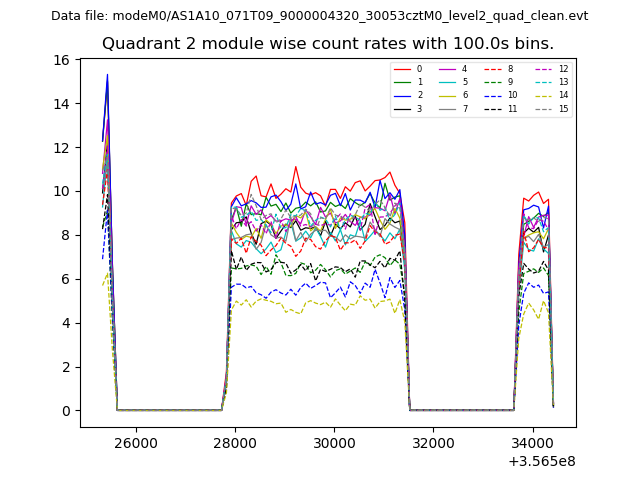
| Module-wise count rates for Quadrant B Data is divided into 100 sec bins |
 |
 |
| Module-wise count rates for Quadrant C Data is divided into 100 sec bins |
 |
 |
| Module-wise count rates for Quadrant D Data is divided into 100 sec bins |
 |
 |
| Parameter | Plot |
|---|---|
| CZT HV Monitor | 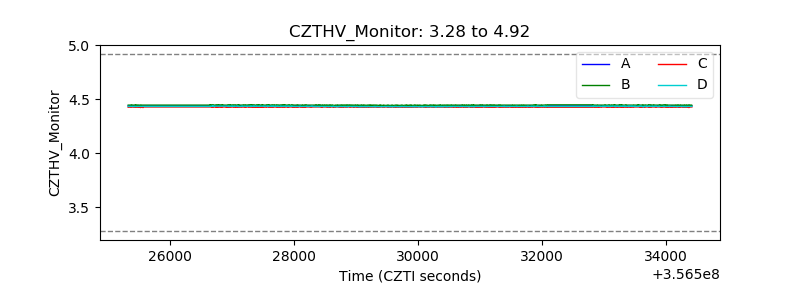 |
| D_VDD | 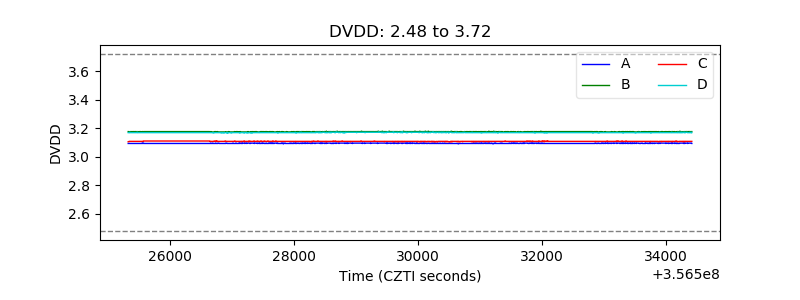 |
| Temperature 1 | 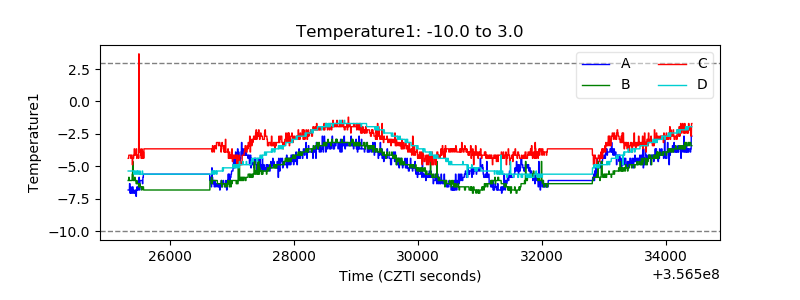 |
| Veto HV Monitor | 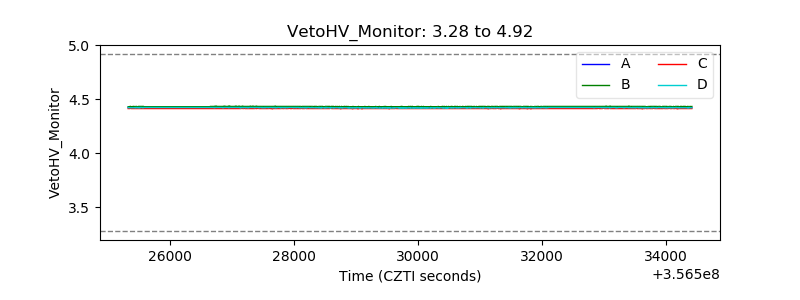 |
| Veto LLD | 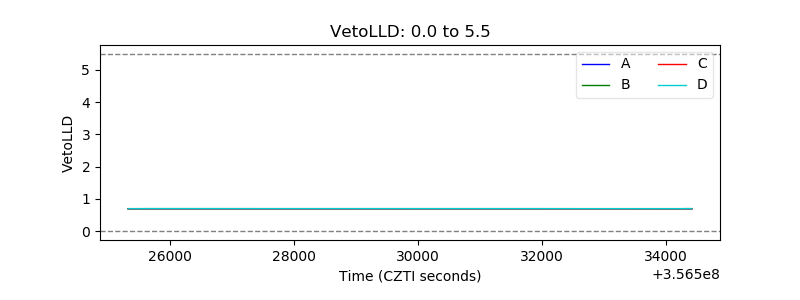 |
| Alpha Counter | 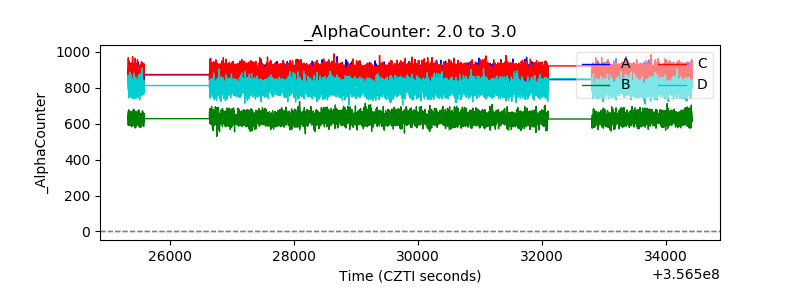 |
| _CPM_Rate | 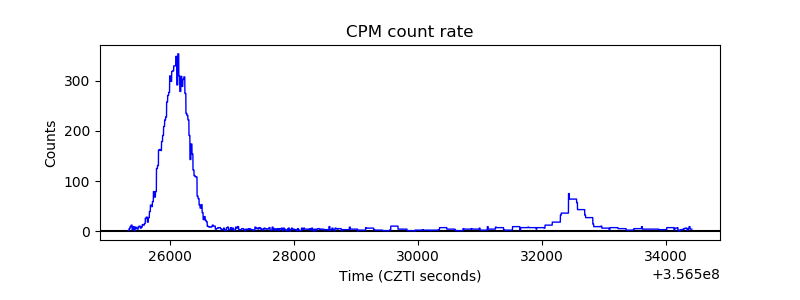 |
| CZT Counter | 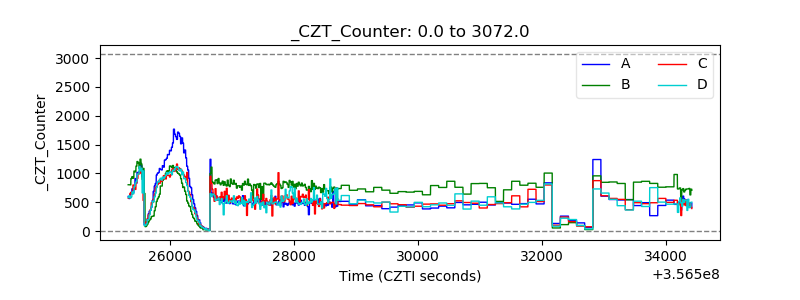 |
| +2.5 Volts monitor |  |
| +5 Volts monitor | 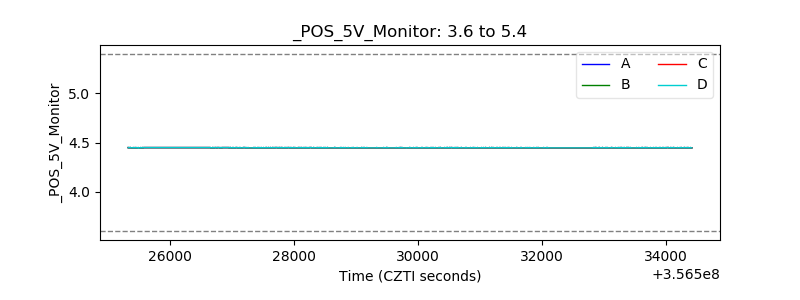 |
| _ROLL_ROT | 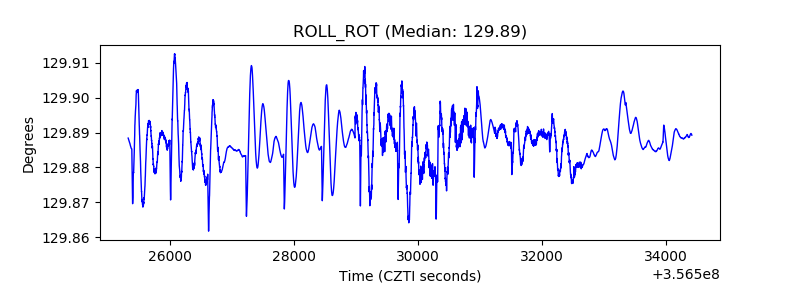 |
| _Roll_DEC | 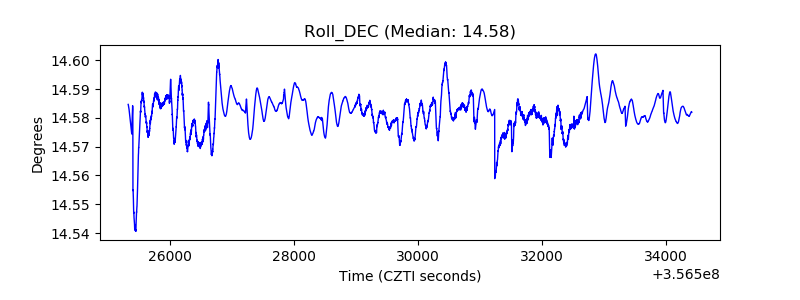 |
| _Roll_RA | 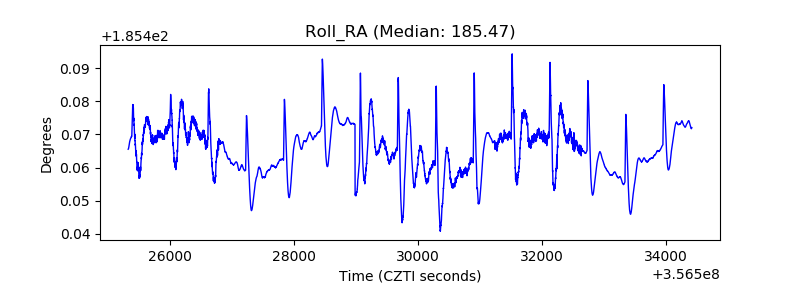 |
| Veto Counter | 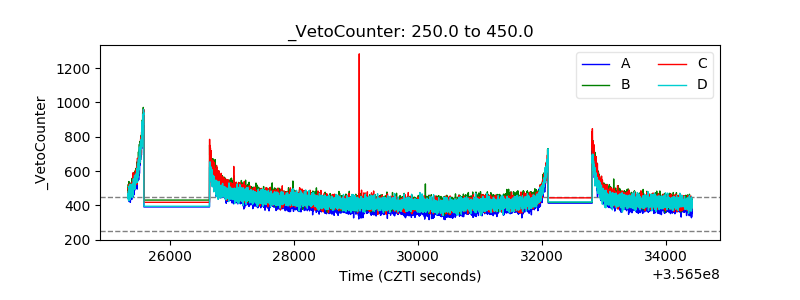 |