| Param | Original file | Final file |
|---|---|---|
| Filename | modeM0/AS1A10_071T09_9000004320_30055cztM0_level2.evt | modeM0/AS1A10_071T09_9000004320_30055cztM0_level2_quad_clean.evt |
| Size (bytes) | 126,696,960 | 32,474,880 |
| Size | 120.8 MB | 31.0 MB |
| Events in quadrant A | 803,828 | 220,470 |
| Events in quadrant B | 1,226,187 | 219,480 |
| Events in quadrant C | 832,356 | 209,891 |
| Events in quadrant D | 856,187 | 208,097 |
| Mode SS | |||
|---|---|---|---|
| Quadrant | BADHDUFLAG | Total packets | Discarded packets |
| A | 0 | 34 | 0 |
| B | 0 | 34 | 0 |
| C | 0 | 34 | 0 |
| D | 0 | 34 | 0 |
| Mode M0 | |||
|---|---|---|---|
| Quadrant | BADHDUFLAG | Total packets | Discarded packets |
| A | 0 | 3427 | 0 |
| B | 0 | 5064 | 0 |
| C | 0 | 3472 | 0 |
| D | 0 | 3524 | 0 |
| Quadrant | Total seconds | Saturated seconds | Saturation percentage |
|---|---|---|---|
| A | 1703 | 1 | 0.058720% |
| B | 1703 | 6 | 0.352319% |
| C | 1703 | 9 | 0.528479% |
| D | 1703 | 4 | 0.234880% |
Noise dominated data is calculated using 1-second bins in cleaned event files. If a bin has >2000 counts, and if more than 50% of those come from <1% of pixels, then it is considered to be noise-dominated and hence unusable.
| Quadrant | # 1 sec bins | Bins with >0 counts | Bins with >2000 counts | High rate bins dominated by noise | Noise dominated (total time) | Noise dominated (detector-on time) | Marked lightcurve |
|---|---|---|---|---|---|---|---|
| A | 1703 | 1703 | 0 | 0 | 0.00% | 0.00% | 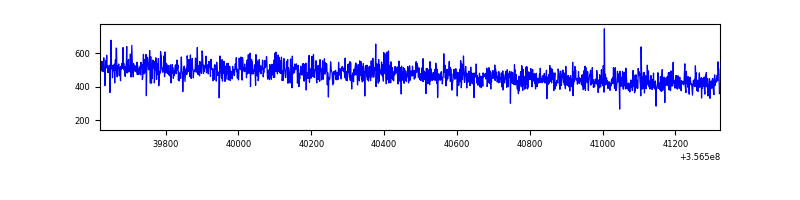 |
| B | 1703 | 1703 | 0 | 0 | 0.00% | 0.00% | 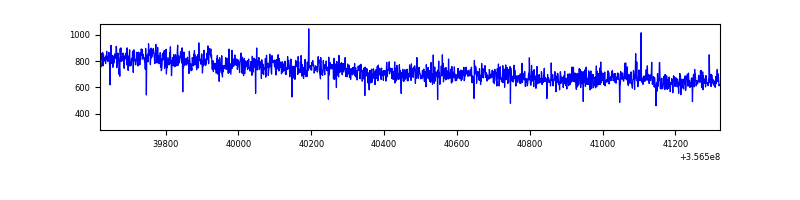 |
| C | 1703 | 1703 | 0 | 0 | 0.00% | 0.00% | 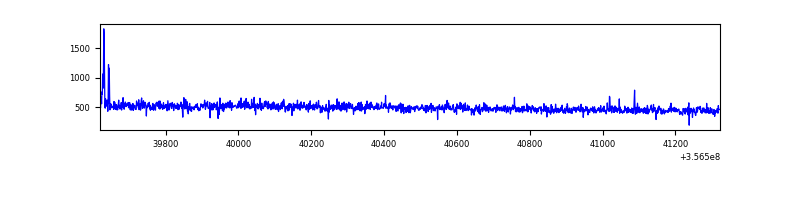 |
| D | 1703 | 1703 | 4 | 4 | 0.23% | 0.23% | 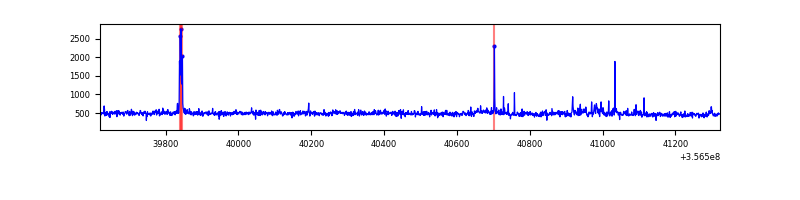 |
Top three noisy pixels from each quadrant. If the there are fewer than three noisy pixels in the level2.evt file, extra rows are filled as -1
| Pixel properties | Quadrant properties | ||||||
|---|---|---|---|---|---|---|---|
| Quadrant | DetID | PixID | Counts | Sigma | Mean | Median | Sigma |
| A | 13 | 254 | 2871 | 59.99 | 208 | 204 | 44.5 |
| A | 3 | 137 | 2100 | 42.64 | 208 | 204 | 44.5 |
| A | 0 | 226 | 1749 | 34.75 | 208 | 204 | 44.5 |
| B | 6 | 159 | 421333 | 10258.53 | 203 | 197 | 41.1 |
| B | 12 | 111 | 4940 | 115.54 | 203 | 197 | 41.1 |
| B | 11 | 111 | 4572 | 106.57 | 203 | 197 | 41.1 |
| C | 14 | 238 | 32518 | 670.16 | 198 | 199 | 48.2 |
| C | 3 | 233 | 20164 | 413.99 | 198 | 199 | 48.2 |
| C | 2 | 114 | 3838 | 75.46 | 198 | 199 | 48.2 |
| D | 8 | 195 | 39450 | 795.44 | 203 | 199 | 49.3 |
| D | 13 | 249 | 15114 | 302.26 | 203 | 199 | 49.3 |
| D | 1 | 52 | 13417 | 267.87 | 203 | 199 | 49.3 |
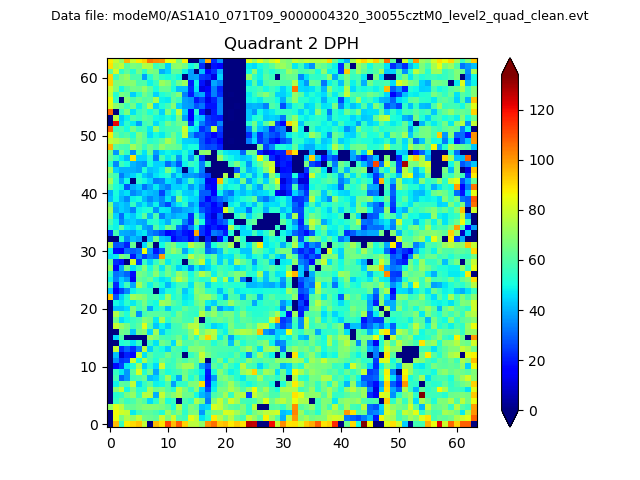
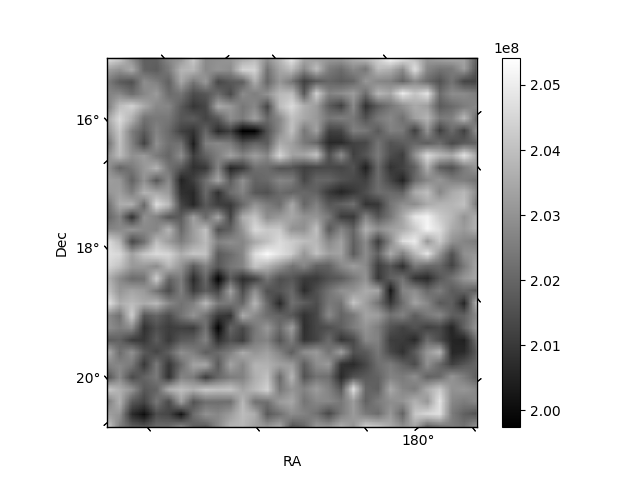
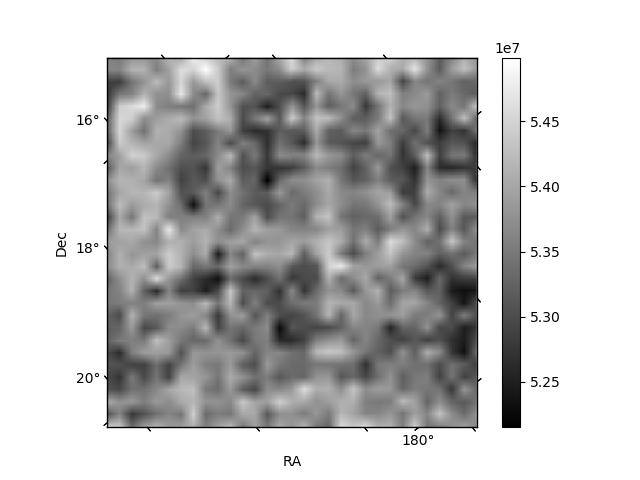
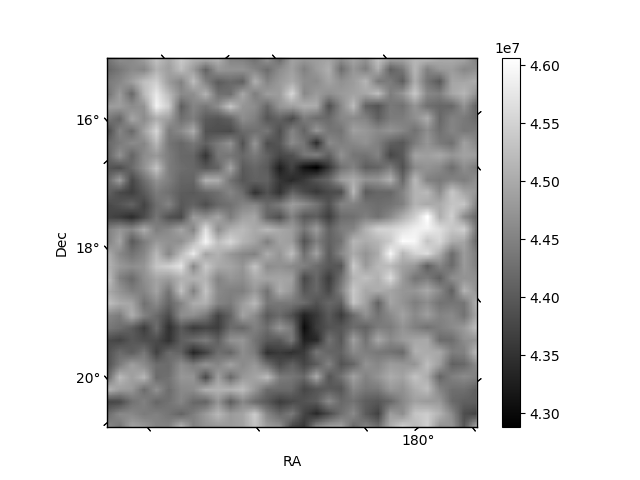
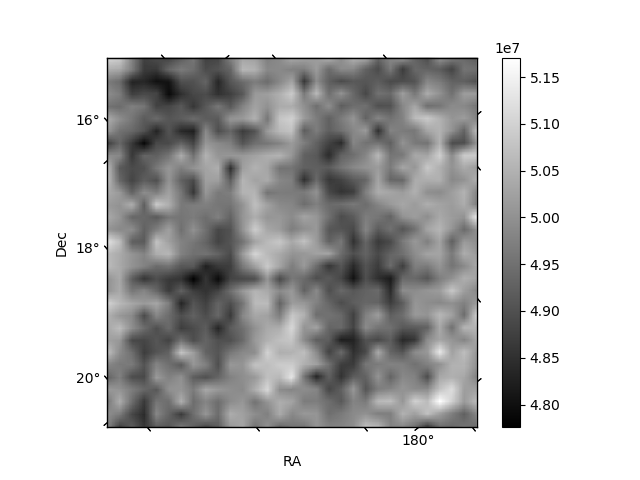
Histogram calculated using DETX and DETY for each event in the final _common_clean file
| Quadrant A | 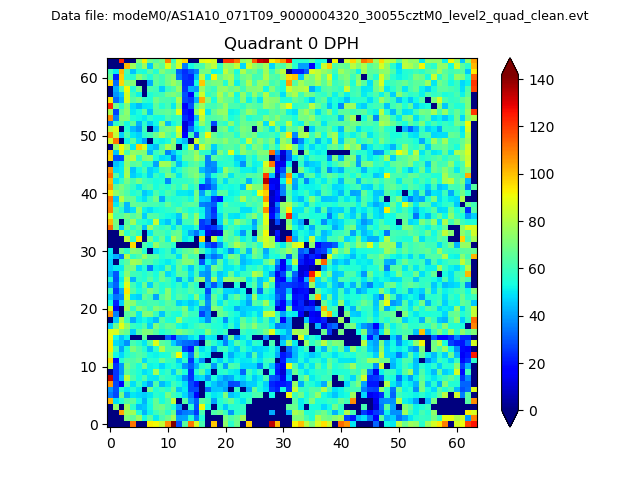 |
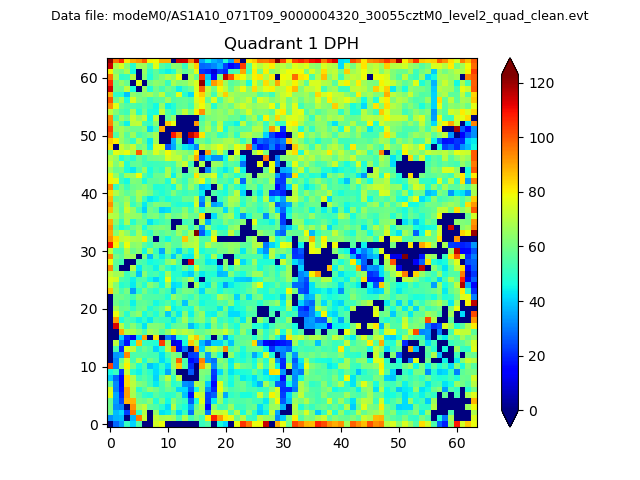 |
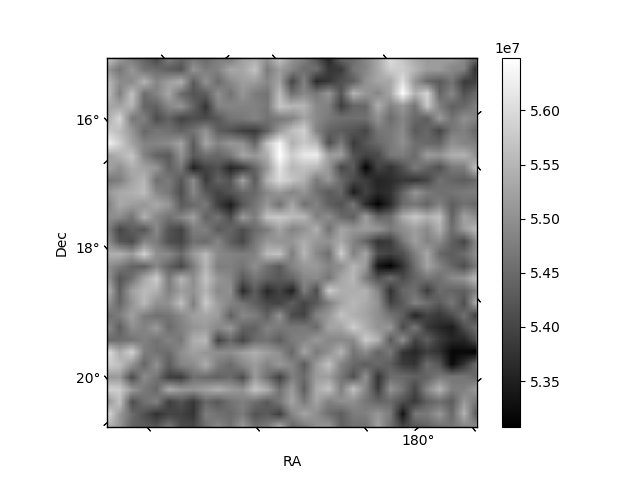
Quadrant B |
|---|---|---|---|
| Quadrant D | 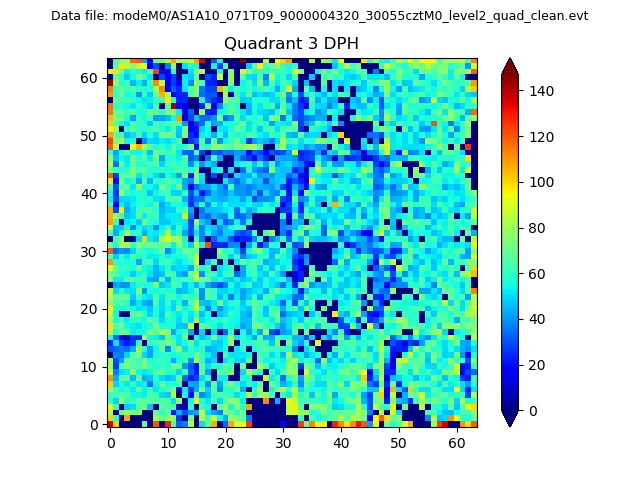 |
 |
Quadrant C |
| Plot type | Count rate plots | Images |
|---|---|---|
| Comparison with Poisson distribution Blue bars denote a histogram of data divided into 1 sec bins. Red curve is a Poisson curve with rate = median count rate of data. |
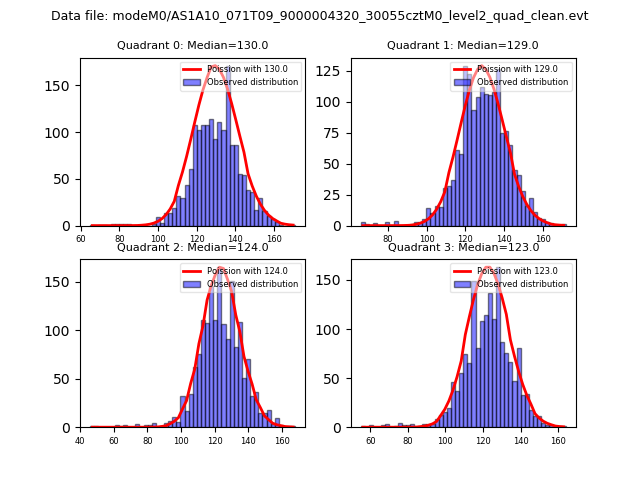 |
 |
| Quadrant-wise count rates Data is divided into 100 sec bins |
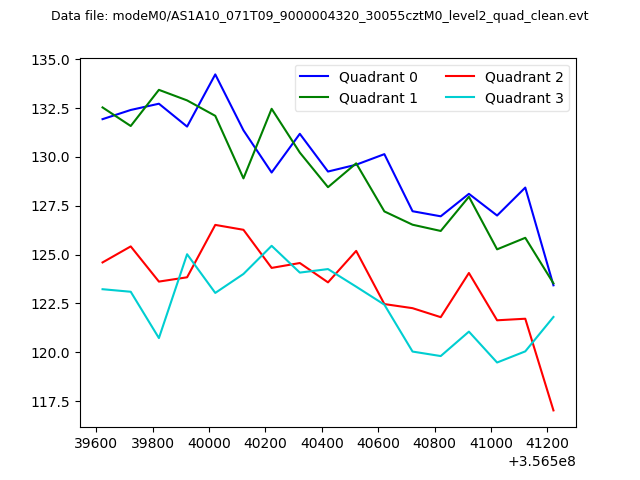 |
|
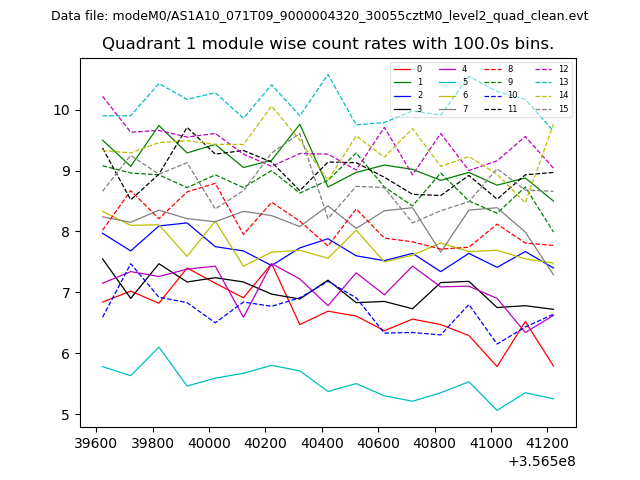
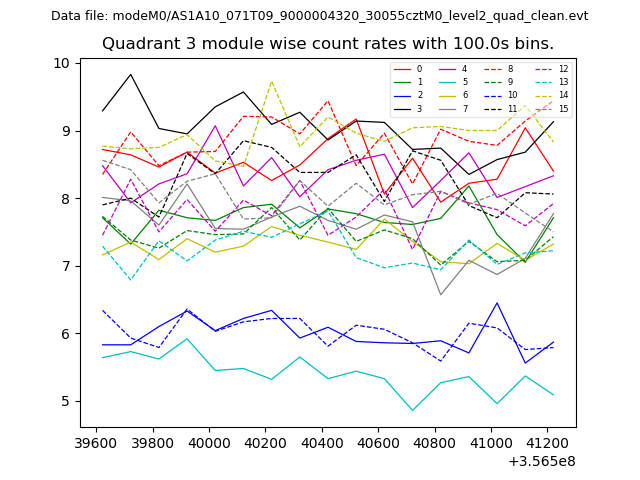
| Module-wise count rates for Quadrant A Data is divided into 100 sec bins |
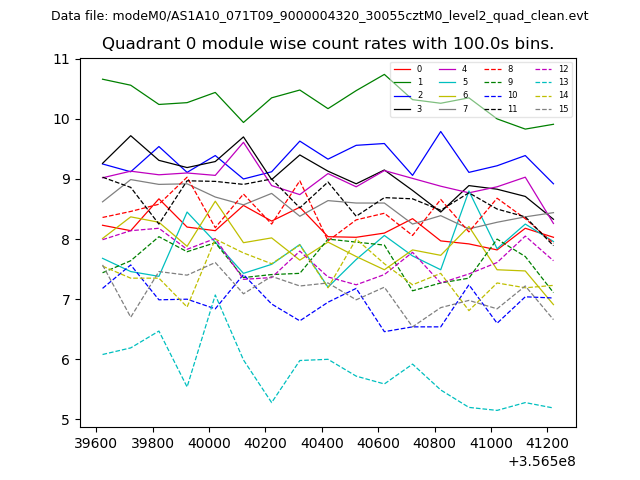 |
 |
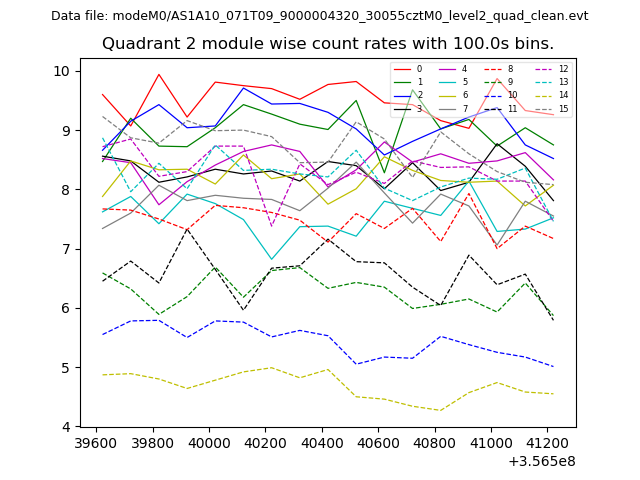
| Module-wise count rates for Quadrant B Data is divided into 100 sec bins |
 |
 |
| Module-wise count rates for Quadrant C Data is divided into 100 sec bins |
 |
 |
| Module-wise count rates for Quadrant D Data is divided into 100 sec bins |
 |
 |
| Parameter | Plot |
|---|---|
| CZT HV Monitor | 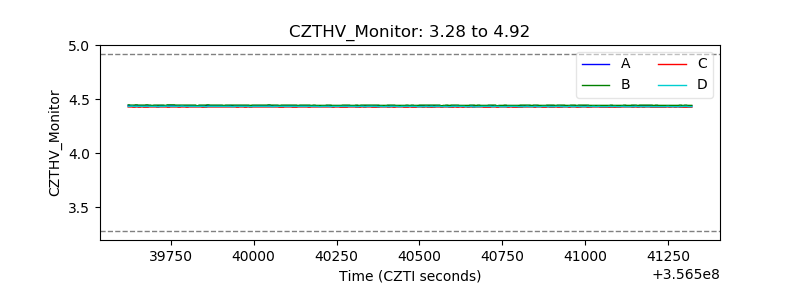 |
| D_VDD | 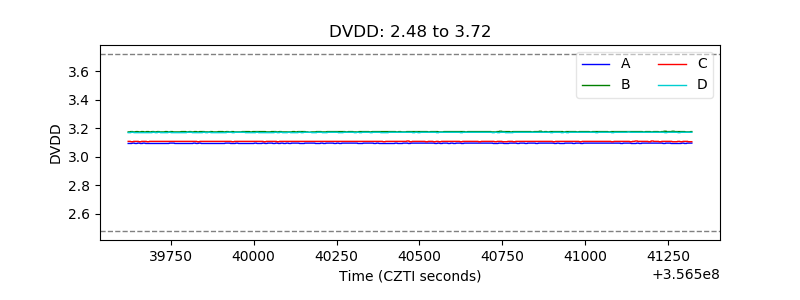 |
| Temperature 1 | 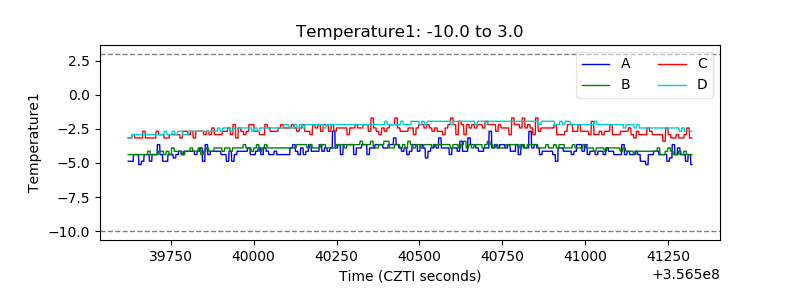 |
| Veto HV Monitor | 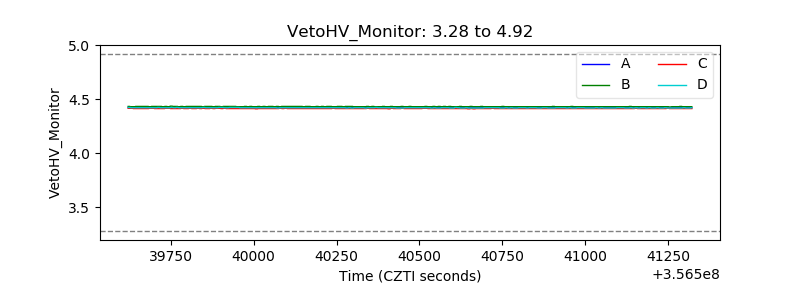 |
| Veto LLD |  |
| Alpha Counter | 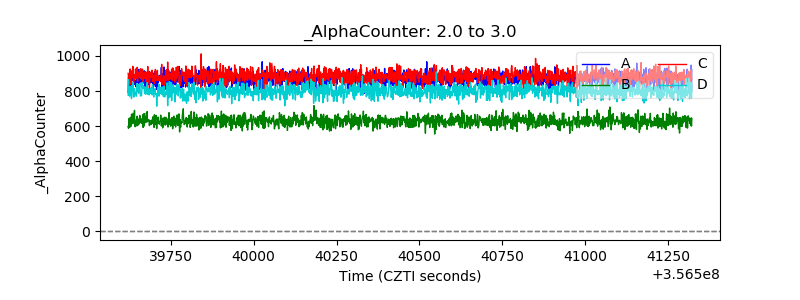 |
| _CPM_Rate | 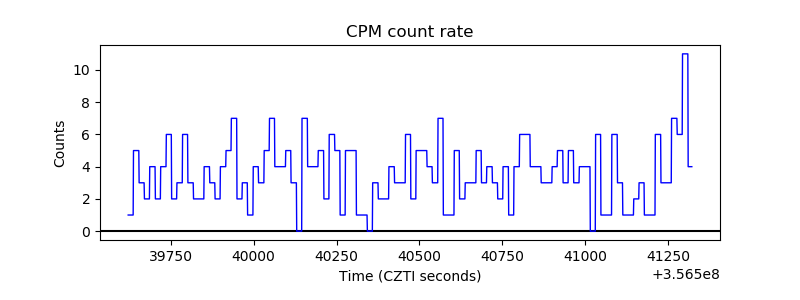 |
| CZT Counter | 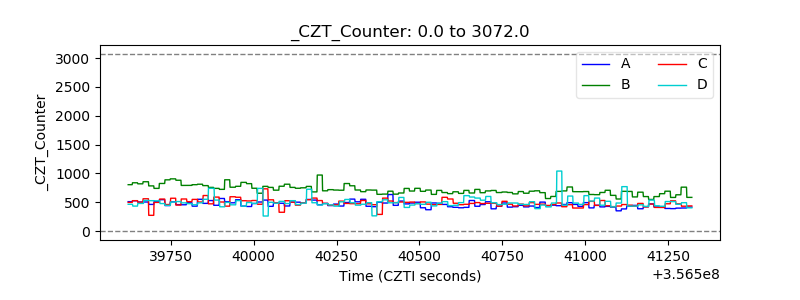 |
| +2.5 Volts monitor |  |
| +5 Volts monitor |  |
| _ROLL_ROT | 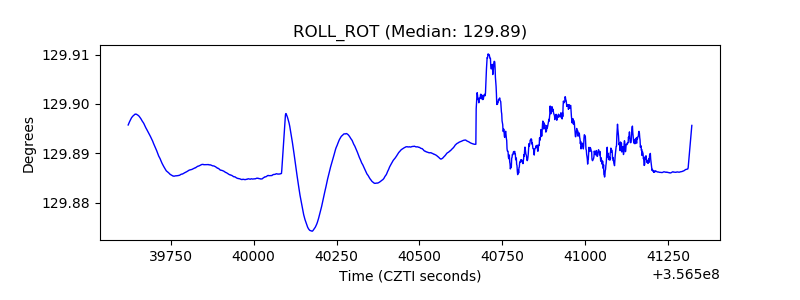 |
| _Roll_DEC | 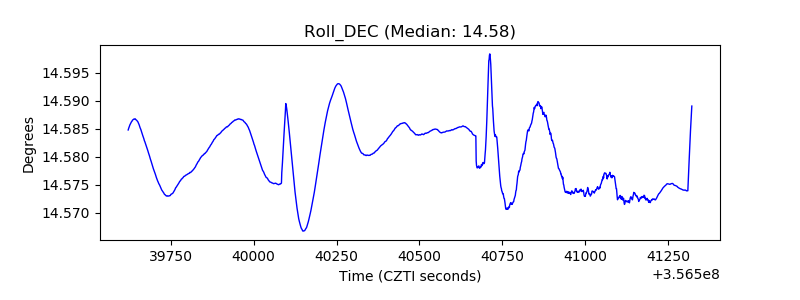 |
| _Roll_RA |  |
| Veto Counter | 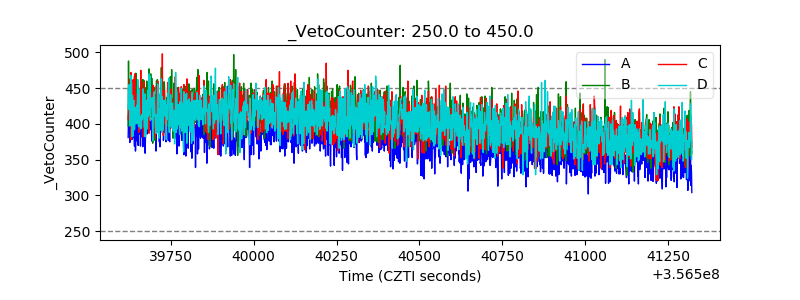 |