| Param | Original file | Final file |
|---|---|---|
| Filename | modeM0/AS1A10_082T06_9000004318cztM0_level2.fits | modeM0/AS1A10_082T06_9000004318cztM0_level2_quad_clean.evt |
| Size (bytes) | 247,334,400 | 257,319,360 |
| Size | 235.9 MB | 245.4 MB |
| Events in quadrant A | 1,526,924 | 1,595,115 |
| Events in quadrant B | 1,418,542 | 1,558,609 |
| Events in quadrant C | 1,471,460 | 1,487,528 |
| Events in quadrant D | 1,315,136 | 1,393,553 |
| Mode M0 | |||
|---|---|---|---|
| Quadrant | BADHDUFLAG | Total packets | Discarded packets |
| A | 0 | 53224 | 0 |
| B | 0 | 78913 | 0 |
| C | 0 | 53430 | 0 |
| D | 0 | 55553 | 0 |
| Mode M9 | |||
|---|---|---|---|
| Quadrant | BADHDUFLAG | Total packets | Discarded packets |
| A | 0 | 24 | 0 |
| B | 0 | 24 | 0 |
| C | 0 | 24 | 0 |
| D | 0 | 24 | 0 |
| Mode SS | |||
|---|---|---|---|
| Quadrant | BADHDUFLAG | Total packets | Discarded packets |
| A | 0 | 522 | 0 |
| B | 0 | 522 | 0 |
| C | 0 | 522 | 0 |
| D | 0 | 522 | 0 |
| Quadrant | Total seconds | Saturated seconds | Saturation percentage |
|---|---|---|---|
| A | 25556 | 472 | 1.846924% |
| B | 25556 | 861 | 3.369072% |
| C | 25556 | 665 | 2.602129% |
| D | 25556 | 419 | 1.639537% |
Noise dominated data is calculated using 1-second bins in cleaned event files. If a bin has >2000 counts, and if more than 50% of those come from <1% of pixels, then it is considered to be noise-dominated and hence unusable.
| Quadrant | # 1 sec bins | Bins with >0 counts | Bins with >2000 counts | High rate bins dominated by noise | Noise dominated (total time) | Noise dominated (detector-on time) | Marked lightcurve |
|---|---|---|---|---|---|---|---|
| A | 28016 | 25555 | 0 | 0 | 0.00% | 0.00% |  |
| B | 28016 | 25541 | 0 | 0 | 0.00% | 0.00% |  |
| C | 28016 | 25556 | 0 | 0 | 0.00% | 0.00% |  |
| D | 28016 | 25556 | 0 | 0 | 0.00% | 0.00% |  |
Top three noisy pixels from each quadrant. If the there are fewer than three noisy pixels in the level2.evt file, extra rows are filled as -1
| Pixel properties | Quadrant properties | ||||||
|---|---|---|---|---|---|---|---|
| Quadrant | DetID | PixID | Counts | Sigma | Mean | Median | Sigma |
| A | 0 | 29 | 1484 | 11.2 | 398 | 375 | 99.0 |
| A | 0 | 30 | 1170 | 8.03 | 398 | 375 | 99.0 |
| A | 7 | 110 | 1156 | 7.89 | 398 | 375 | 99.0 |
| B | 2 | 9 | 1100 | 9.84 | 375 | 356 | 75.6 |
| B | 3 | 17 | 978 | 8.23 | 375 | 356 | 75.6 |
| B | 3 | 80 | 938 | 7.7 | 375 | 356 | 75.6 |
| C | 12 | 241 | 1065 | 7.11 | 388 | 361 | 99.1 |
| C | 2 | 191 | 995 | 6.4 | 388 | 361 | 99.1 |
| C | 9 | 233 | 992 | 6.37 | 388 | 361 | 99.1 |
| D | 15 | 46 | 1062 | 7.08 | 374 | 340 | 102.0 |
| D | 4 | 246 | 996 | 6.43 | 374 | 340 | 102.0 |
| D | 3 | 14 | 991 | 6.38 | 374 | 340 | 102.0 |
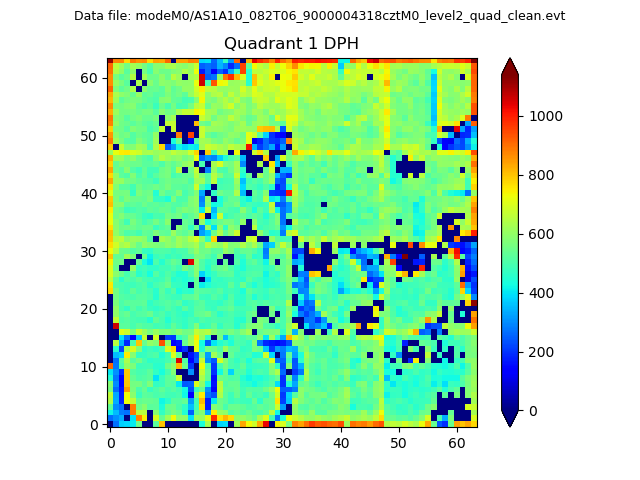
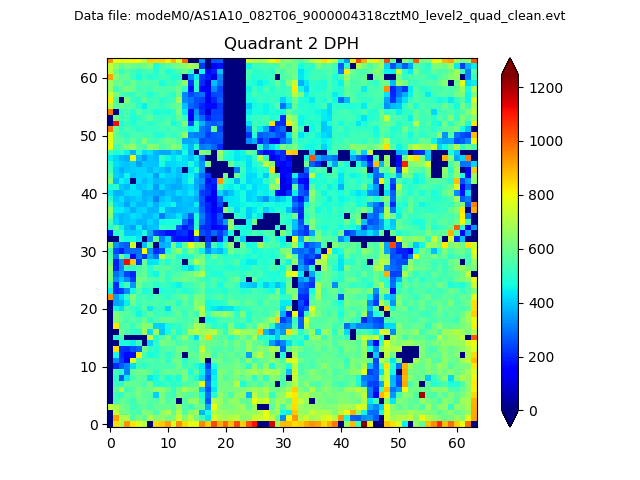
Histogram calculated using DETX and DETY for each event in the final _common_clean file
| Quadrant A |  |
 |
Quadrant B |
|---|---|---|---|
| Quadrant D |  |
 |
Quadrant C |
| Plot type | Count rate plots | Images |
|---|---|---|
| Comparison with Poisson distribution Blue bars denote a histogram of data divided into 1 sec bins. Red curve is a Poisson curve with rate = median count rate of data. |
 |
 |
| Quadrant-wise count rates Data is divided into 100 sec bins |
 |
|
| Module-wise count rates for Quadrant A Data is divided into 100 sec bins |
 |
 |
| Module-wise count rates for Quadrant B Data is divided into 100 sec bins |
 |
 |
| Module-wise count rates for Quadrant C Data is divided into 100 sec bins |
 |
 |
| Module-wise count rates for Quadrant D Data is divided into 100 sec bins |
 |
 |
| Parameter | Plot |
|---|---|
| CZT HV Monitor |  |
| D_VDD |  |
| Temperature 1 |  |
| Veto HV Monitor |  |
| Veto LLD |  |
| Alpha Counter |  |
| _CPM_Rate |  |
| CZT Counter |  |
| +2.5 Volts monitor |  |
| +5 Volts monitor |  |
| _ROLL_ROT |  |
| _Roll_DEC |  |
| _Roll_RA |  |
| Veto Counter |  |