| Param | Original file | Final file |
|---|---|---|
| Filename | modeM0/AS1A10_082T06_9000004318_30038cztM0_level2.evt | modeM0/AS1A10_082T06_9000004318_30038cztM0_level2_quad_clean.evt |
| Size (bytes) | 193,815,360 | 19,379,520 |
| Size | 184.8 MB | 18.5 MB |
| Events in quadrant A | 1,263,026 | 107,014 |
| Events in quadrant B | 1,876,216 | 104,717 |
| Events in quadrant C | 1,264,594 | 103,989 |
| Events in quadrant D | 1,307,979 | 104,959 |
| Mode M0 | |||
|---|---|---|---|
| Quadrant | BADHDUFLAG | Total packets | Discarded packets |
| A | 0 | 5060 | 1 |
| B | 0 | 7184 | 1 |
| C | 0 | 5058 | 1 |
| D | 0 | 5216 | 1 |
| Mode M9 | |||
|---|---|---|---|
| Quadrant | BADHDUFLAG | Total packets | Discarded packets |
| A | 0 | 9 | 0 |
| B | 0 | 9 | 0 |
| C | 0 | 9 | 0 |
| D | 0 | 9 | 0 |
| Mode SS | |||
|---|---|---|---|
| Quadrant | BADHDUFLAG | Total packets | Discarded packets |
| A | 0 | 46 | 0 |
| B | 0 | 46 | 0 |
| C | 0 | 46 | 0 |
| D | 0 | 46 | 0 |
| Quadrant | Total seconds | Saturated seconds | Saturation percentage |
|---|---|---|---|
| A | 2298 | 138 | 6.005222% |
| B | 2298 | 190 | 8.268059% |
| C | 2298 | 138 | 6.005222% |
| D | 2298 | 116 | 5.047868% |
Noise dominated data is calculated using 1-second bins in cleaned event files. If a bin has >2000 counts, and if more than 50% of those come from <1% of pixels, then it is considered to be noise-dominated and hence unusable.
| Quadrant | # 1 sec bins | Bins with >0 counts | Bins with >2000 counts | High rate bins dominated by noise | Noise dominated (total time) | Noise dominated (detector-on time) | Marked lightcurve |
|---|---|---|---|---|---|---|---|
| A | 3173 | 2298 | 0 | 0 | 0.00% | 0.00% | 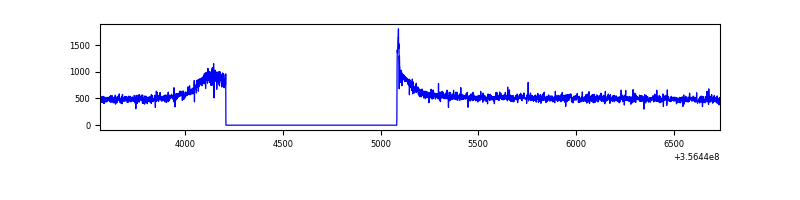 |
| B | 3173 | 2298 | 2 | 2 | 0.06% | 0.09% | 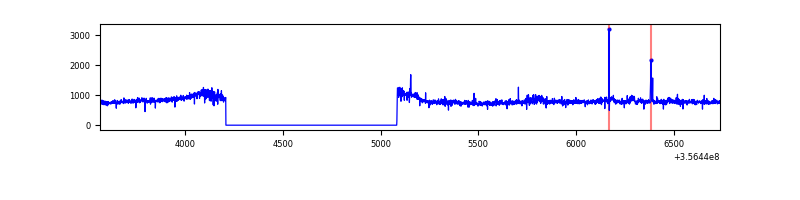 |
| C | 3173 | 2299 | 0 | 0 | 0.00% | 0.00% | 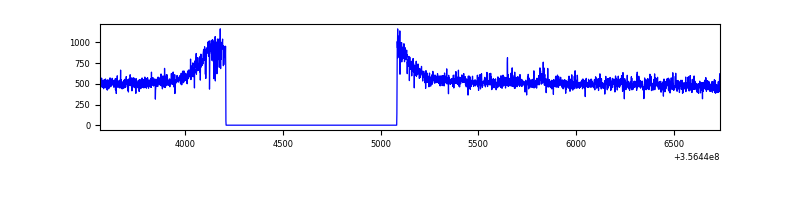 |
| D | 3173 | 2299 | 9 | 9 | 0.28% | 0.39% | 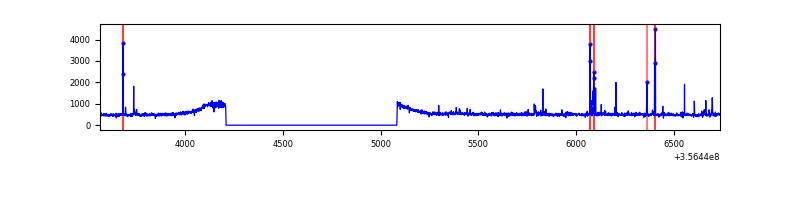 |
Top three noisy pixels from each quadrant. If the there are fewer than three noisy pixels in the level2.evt file, extra rows are filled as -1
| Pixel properties | Quadrant properties | ||||||
|---|---|---|---|---|---|---|---|
| Quadrant | DetID | PixID | Counts | Sigma | Mean | Median | Sigma |
| A | 8 | 192 | 10717 | 154.06 | 324 | 316 | 67.5 |
| A | 13 | 254 | 4346 | 59.69 | 324 | 316 | 67.5 |
| A | 3 | 137 | 3422 | 46.01 | 324 | 316 | 67.5 |
| B | 6 | 159 | 605751 | 9570.82 | 313 | 304 | 63.3 |
| B | 0 | 183 | 18049 | 280.51 | 313 | 304 | 63.3 |
| B | 5 | 255 | 11913 | 183.51 | 313 | 304 | 63.3 |
| C | 14 | 238 | 48733 | 656.55 | 307 | 307 | 73.8 |
| C | 3 | 233 | 13213 | 174.98 | 307 | 307 | 73.8 |
| C | 2 | 114 | 5817 | 74.7 | 307 | 307 | 73.8 |
| D | 8 | 195 | 48210 | 615.86 | 315 | 307 | 77.8 |
| D | 2 | 250 | 36732 | 468.3 | 315 | 307 | 77.8 |
| D | 2 | 120 | 13563 | 170.43 | 315 | 307 | 77.8 |
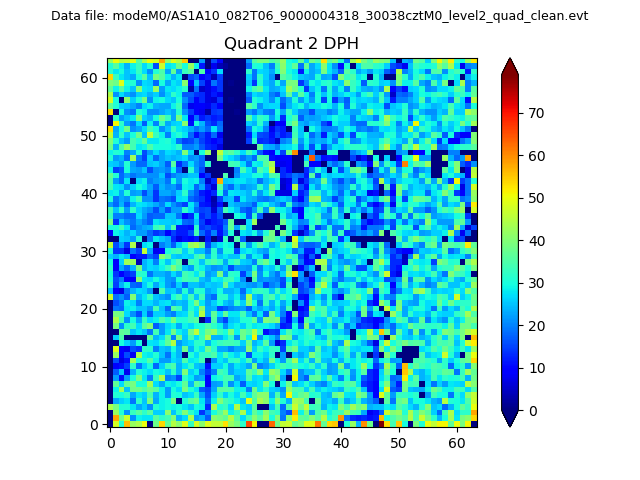
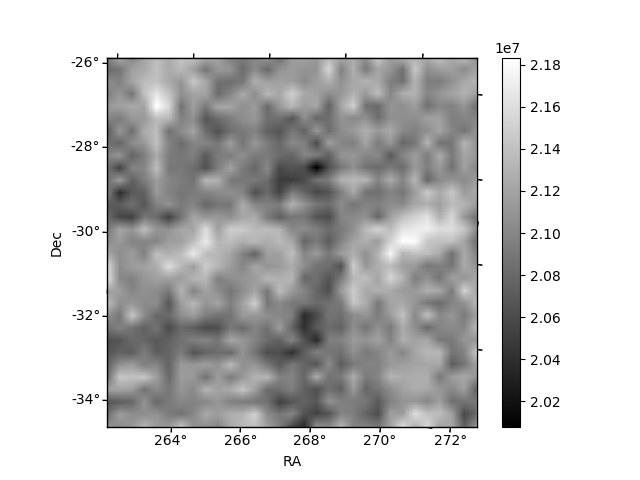
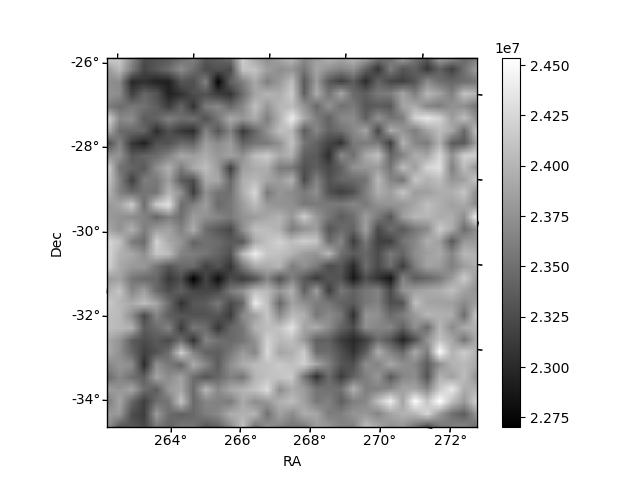
Histogram calculated using DETX and DETY for each event in the final _common_clean file
| Quadrant A | 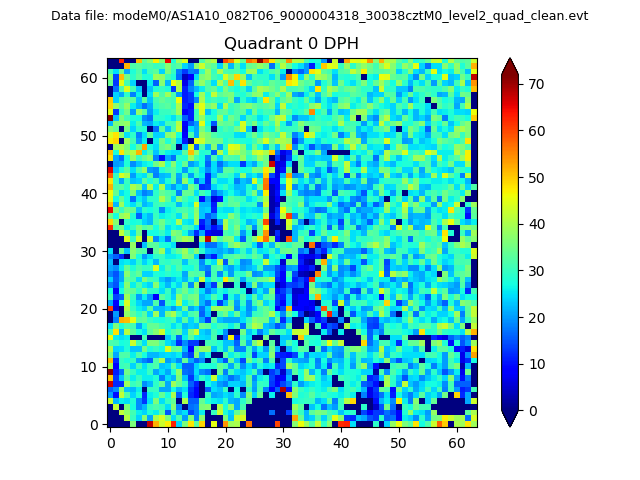 |
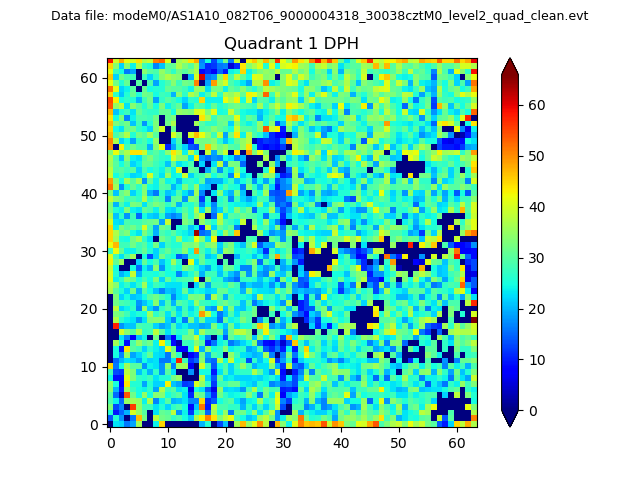 |
Quadrant B |
|---|---|---|---|
| Quadrant D | 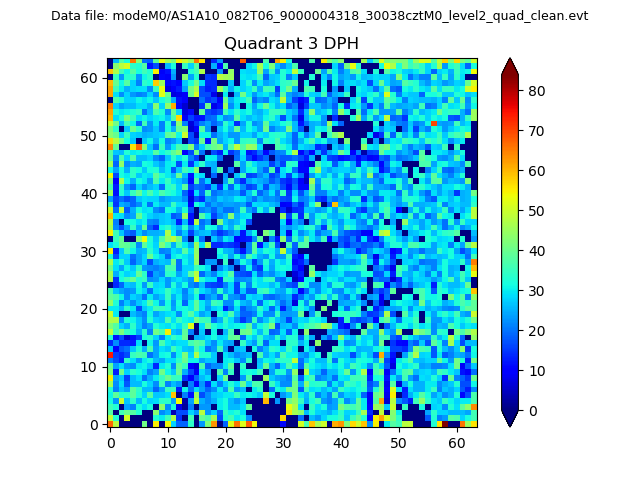 |
 |
Quadrant C |
| Plot type | Count rate plots | Images |
|---|---|---|
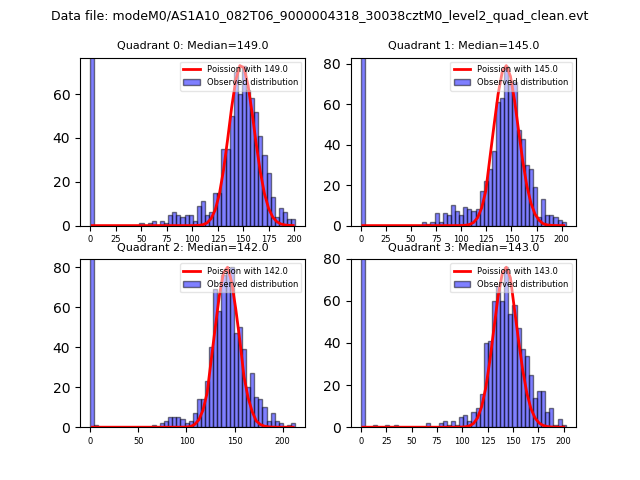
| Comparison with Poisson distribution Blue bars denote a histogram of data divided into 1 sec bins. Red curve is a Poisson curve with rate = median count rate of data. |
 |
 |
| Quadrant-wise count rates Data is divided into 100 sec bins |
 |
|
| Module-wise count rates for Quadrant A Data is divided into 100 sec bins |
 |
 |
| Module-wise count rates for Quadrant B Data is divided into 100 sec bins |
 |
 |
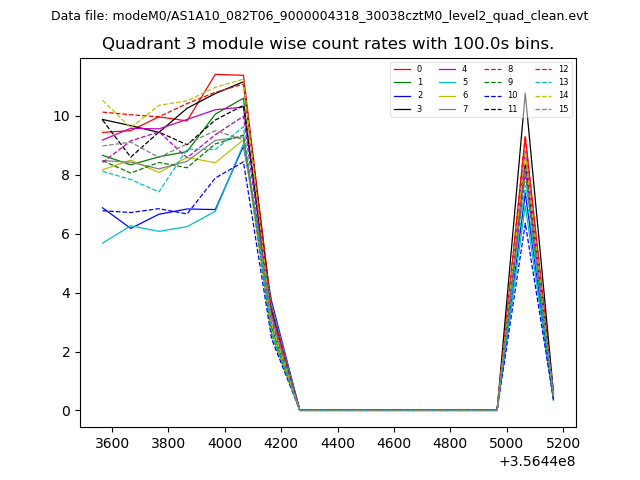
| Module-wise count rates for Quadrant C Data is divided into 100 sec bins |
 |
 |
| Module-wise count rates for Quadrant D Data is divided into 100 sec bins |
 |
 |
| Parameter | Plot |
|---|---|
| CZT HV Monitor | 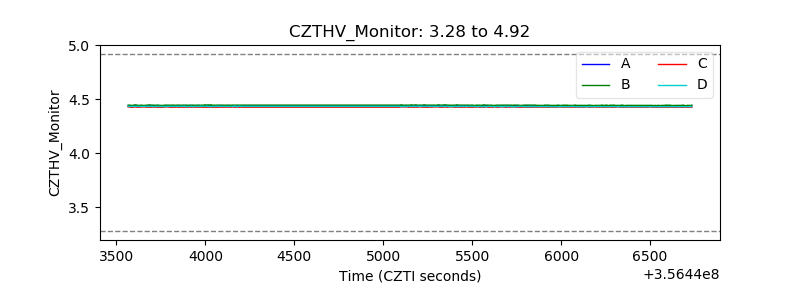 |
| D_VDD | 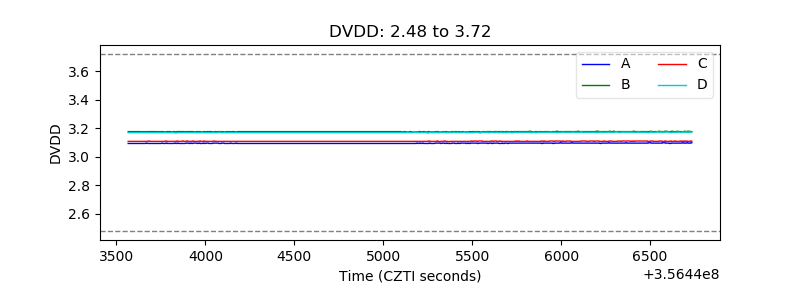 |
| Temperature 1 | 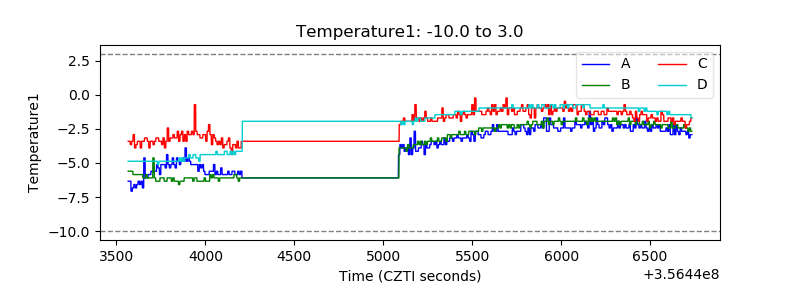 |
| Veto HV Monitor |  |
| Veto LLD | 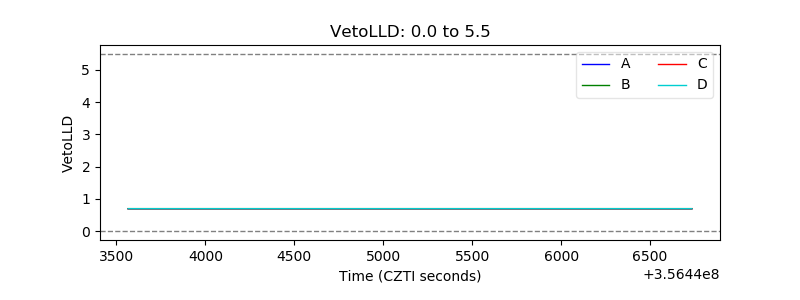 |
| Alpha Counter | 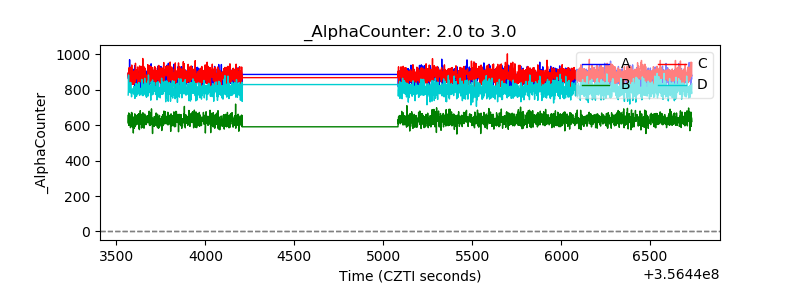 |
| _CPM_Rate | 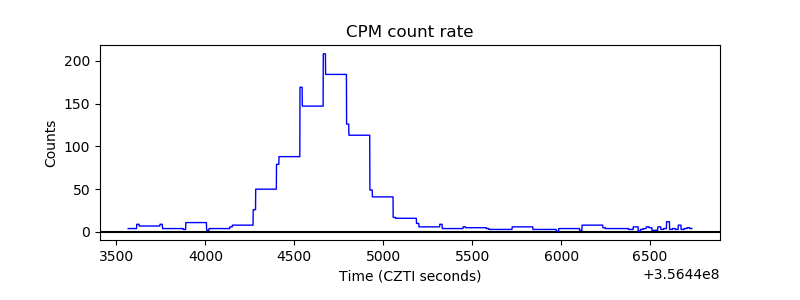 |
| CZT Counter | 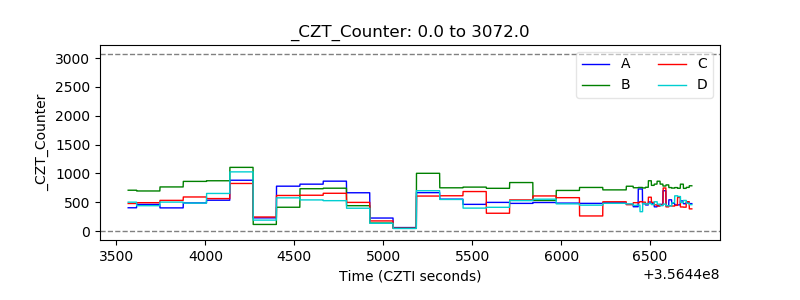 |
| +2.5 Volts monitor |  |
| +5 Volts monitor |  |
| _ROLL_ROT | 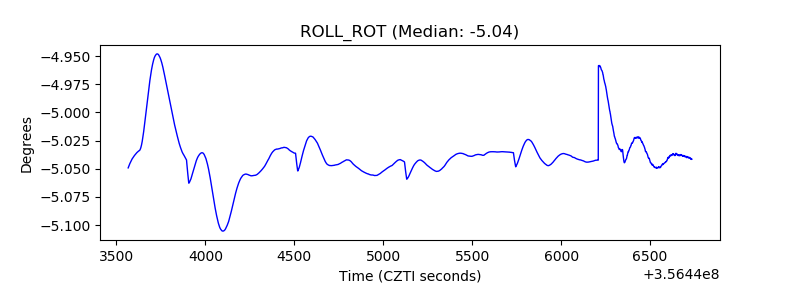 |
| _Roll_DEC | 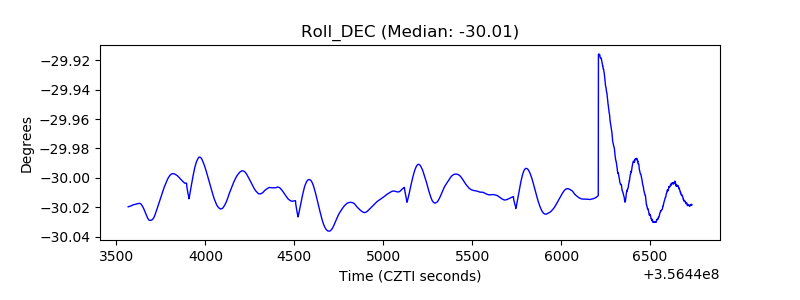 |
| _Roll_RA | 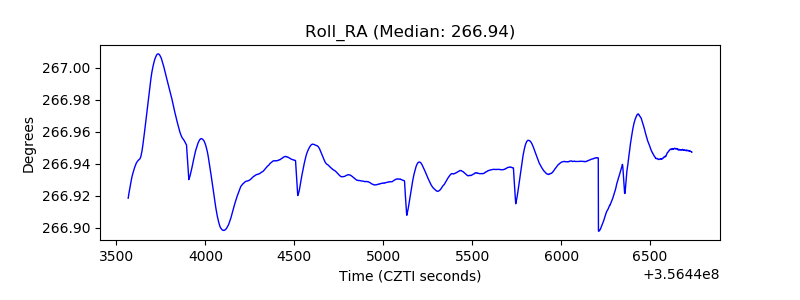 |
| Veto Counter |  |