| Param | Original file | Final file |
|---|---|---|
| Filename | modeM0/AS1A10_082T06_9000004318_30040cztM0_level2.evt | modeM0/AS1A10_082T06_9000004318_30040cztM0_level2_quad_clean.evt |
| Size (bytes) | 573,468,480 | 79,251,840 |
| Size | 546.9 MB | 75.6 MB |
| Events in quadrant A | 3,543,708 | 486,196 |
| Events in quadrant B | 5,943,478 | 478,068 |
| Events in quadrant C | 3,639,267 | 463,898 |
| Events in quadrant D | 3,748,345 | 465,527 |
| Mode M0 | |||
|---|---|---|---|
| Quadrant | BADHDUFLAG | Total packets | Discarded packets |
| A | 0 | 15093 | 2 |
| B | 0 | 22828 | 1 |
| C | 0 | 15233 | 1 |
| D | 0 | 15711 | 1 |
| Mode M9 | |||
|---|---|---|---|
| Quadrant | BADHDUFLAG | Total packets | Discarded packets |
| A | 0 | 2 | 0 |
| B | 0 | 2 | 0 |
| C | 0 | 2 | 0 |
| D | 0 | 2 | 0 |
| Mode SS | |||
|---|---|---|---|
| Quadrant | BADHDUFLAG | Total packets | Discarded packets |
| A | 0 | 148 | 0 |
| B | 0 | 148 | 0 |
| C | 0 | 148 | 0 |
| D | 0 | 148 | 0 |
| Quadrant | Total seconds | Saturated seconds | Saturation percentage |
|---|---|---|---|
| A | 7266 | 120 | 1.651528% |
| B | 7267 | 285 | 3.921838% |
| C | 7267 | 216 | 2.972341% |
| D | 7267 | 109 | 1.499931% |
Noise dominated data is calculated using 1-second bins in cleaned event files. If a bin has >2000 counts, and if more than 50% of those come from <1% of pixels, then it is considered to be noise-dominated and hence unusable.
| Quadrant | # 1 sec bins | Bins with >0 counts | Bins with >2000 counts | High rate bins dominated by noise | Noise dominated (total time) | Noise dominated (detector-on time) | Marked lightcurve |
|---|---|---|---|---|---|---|---|
| A | 7501 | 7267 | 0 | 0 | 0.00% | 0.00% |  |
| B | 7502 | 7268 | 30 | 30 | 0.40% | 0.41% |  |
| C | 7502 | 7268 | 0 | 0 | 0.00% | 0.00% |  |
| D | 7502 | 7268 | 40 | 40 | 0.53% | 0.55% |  |
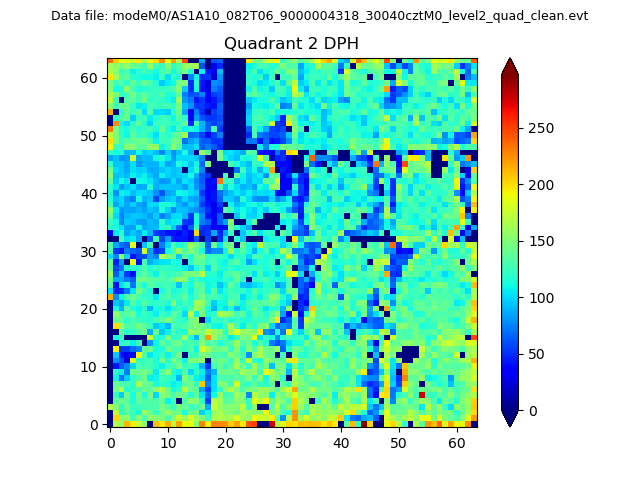
Top three noisy pixels from each quadrant. If the there are fewer than three noisy pixels in the level2.evt file, extra rows are filled as -1
| Pixel properties | Quadrant properties | ||||||
|---|---|---|---|---|---|---|---|
| Quadrant | DetID | PixID | Counts | Sigma | Mean | Median | Sigma |
| A | 13 | 254 | 14636 | 74.78 | 912 | 891 | 183.8 |
| A | 8 | 192 | 13435 | 68.25 | 912 | 891 | 183.8 |
| A | 3 | 1 | 9402 | 46.31 | 912 | 891 | 183.8 |
| B | 6 | 159 | 2061148 | 11938.54 | 889 | 865 | 172.6 |
| B | 0 | 190 | 247255 | 1427.73 | 889 | 865 | 172.6 |
| B | 5 | 255 | 110042 | 632.64 | 889 | 865 | 172.6 |
| C | 14 | 238 | 178373 | 873.31 | 864 | 869 | 203.3 |
| C | 14 | 254 | 57859 | 280.39 | 864 | 869 | 203.3 |
| C | 3 | 233 | 18981 | 89.11 | 864 | 869 | 203.3 |
| D | 8 | 195 | 192745 | 871.15 | 877 | 855 | 220.3 |
| D | 13 | 138 | 88419 | 397.53 | 877 | 855 | 220.3 |
| D | 7 | 69 | 38030 | 168.77 | 877 | 855 | 220.3 |
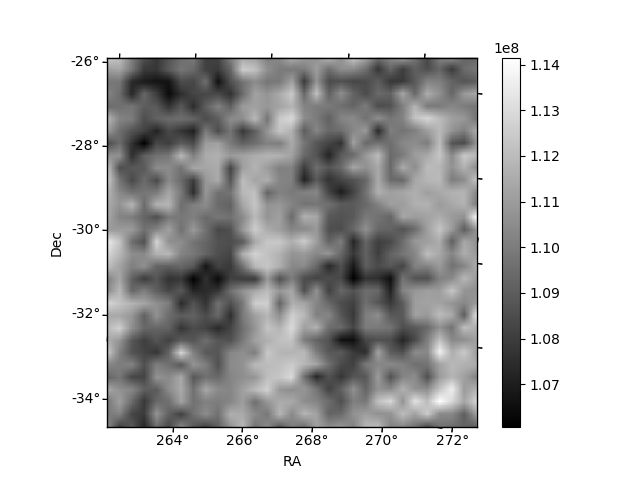
Histogram calculated using DETX and DETY for each event in the final _common_clean file
| Quadrant A | 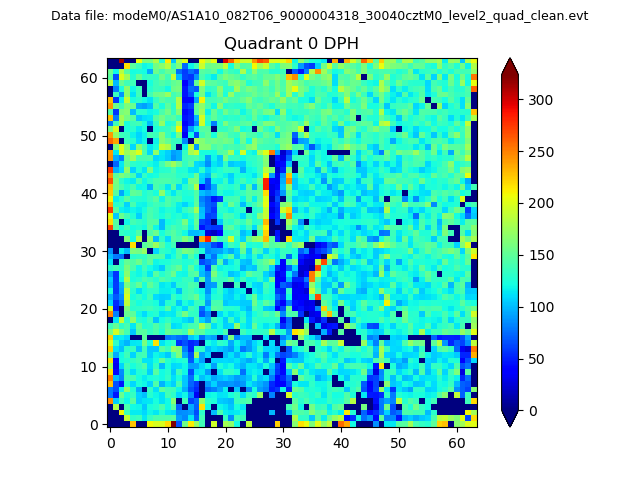 |
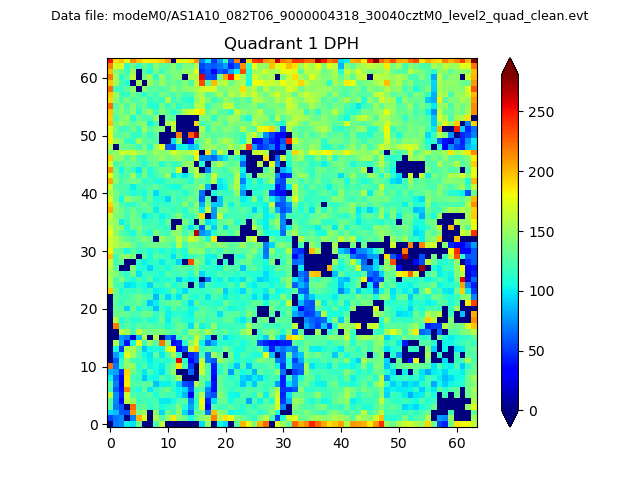 |
Quadrant B |
|---|---|---|---|
| Quadrant D | 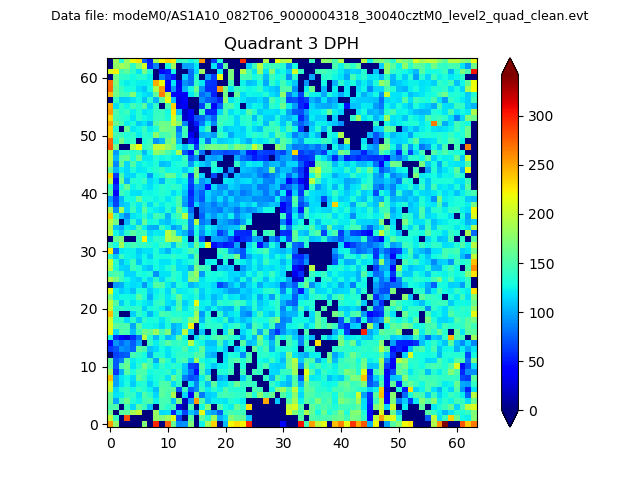 |
 |
Quadrant C |
| Plot type | Count rate plots | Images |
|---|---|---|
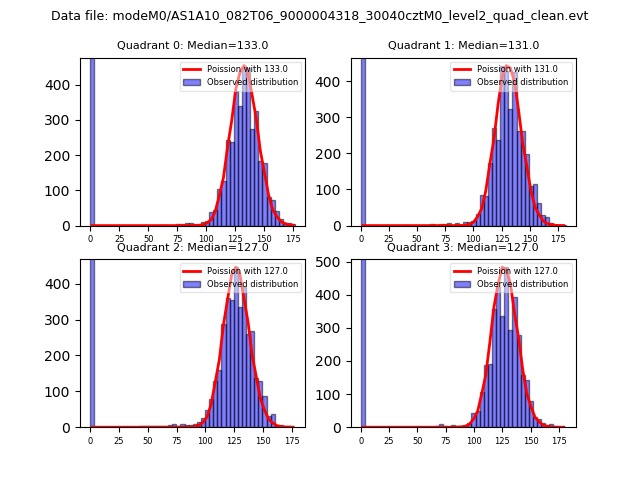
| Comparison with Poisson distribution Blue bars denote a histogram of data divided into 1 sec bins. Red curve is a Poisson curve with rate = median count rate of data. |
 |
 |
| Quadrant-wise count rates Data is divided into 100 sec bins |
 |
|
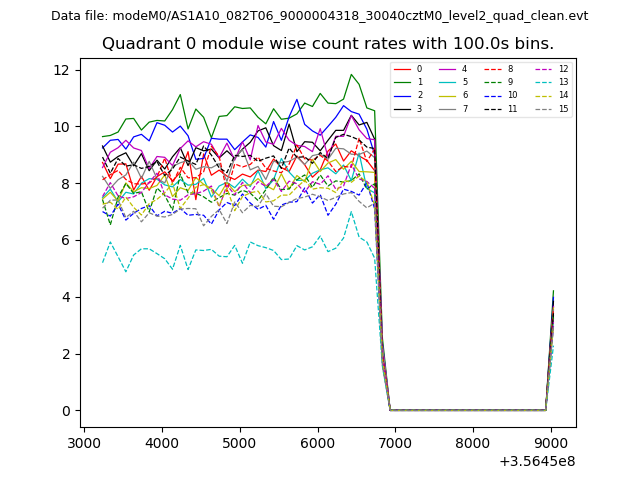
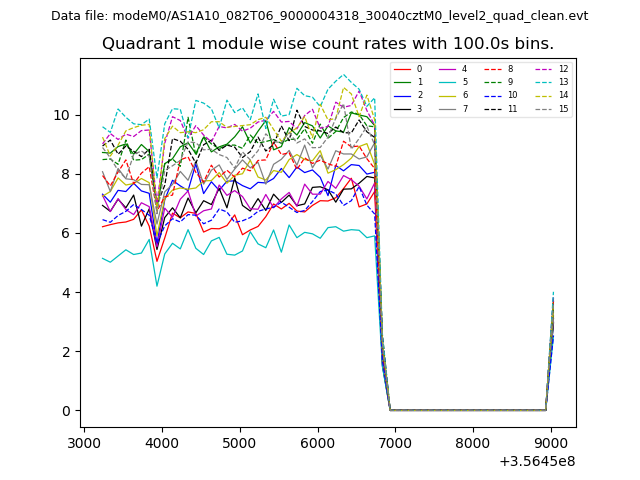
| Module-wise count rates for Quadrant A Data is divided into 100 sec bins |
 |
 |
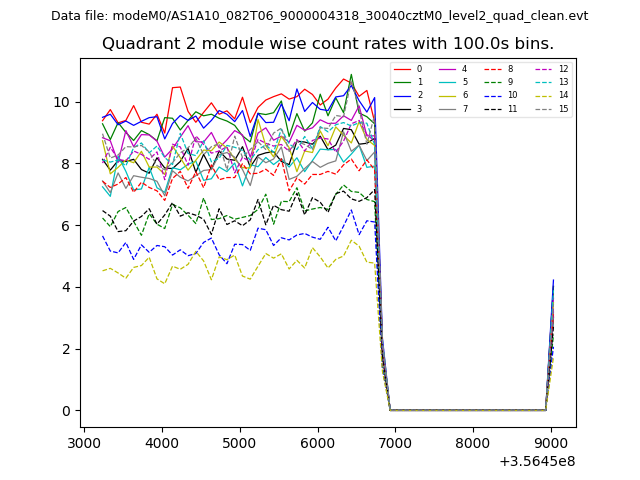
| Module-wise count rates for Quadrant B Data is divided into 100 sec bins |
 |
 |
| Module-wise count rates for Quadrant C Data is divided into 100 sec bins |
 |
 |
| Module-wise count rates for Quadrant D Data is divided into 100 sec bins |
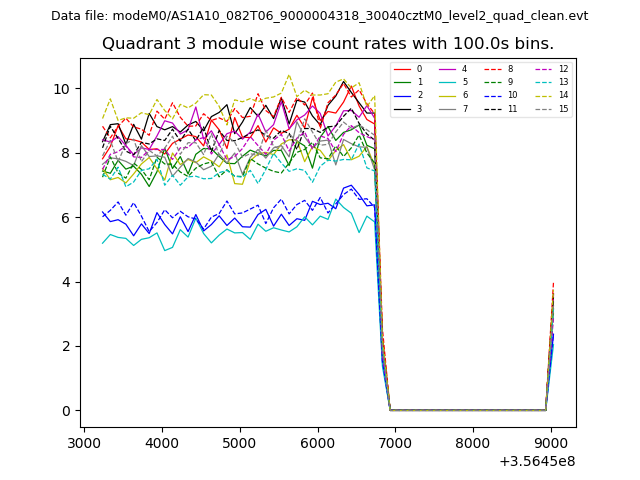 |
 |
| Parameter | Plot |
|---|---|
| CZT HV Monitor | 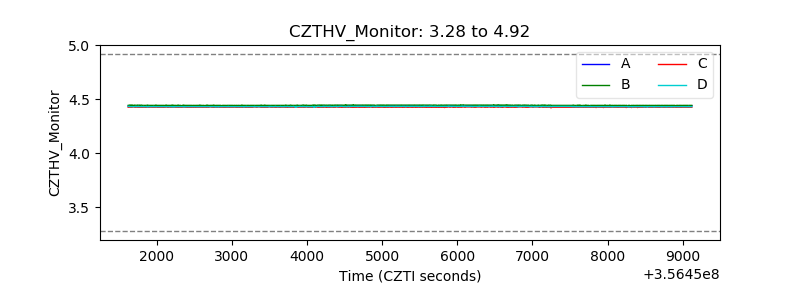 |
| D_VDD | 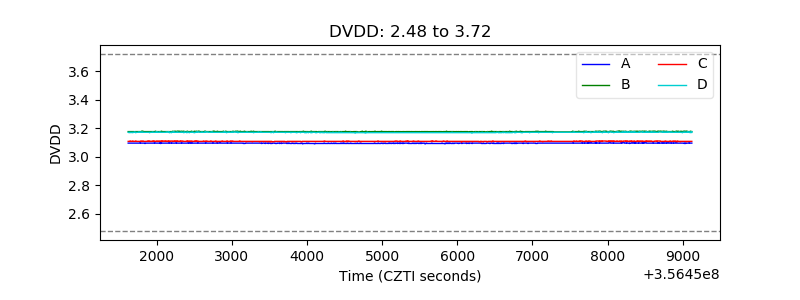 |
| Temperature 1 | 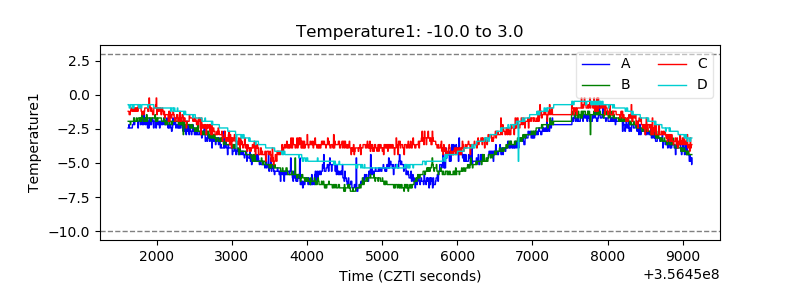 |
| Veto HV Monitor | 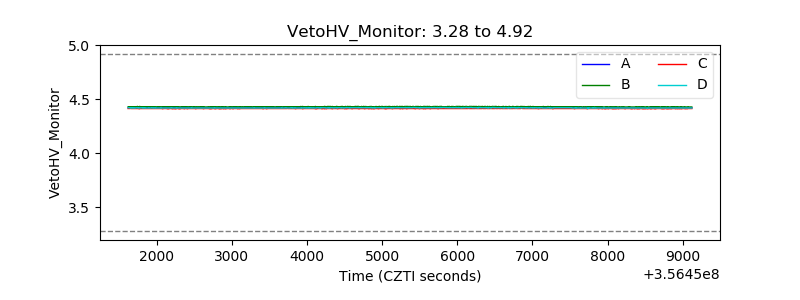 |
| Veto LLD | 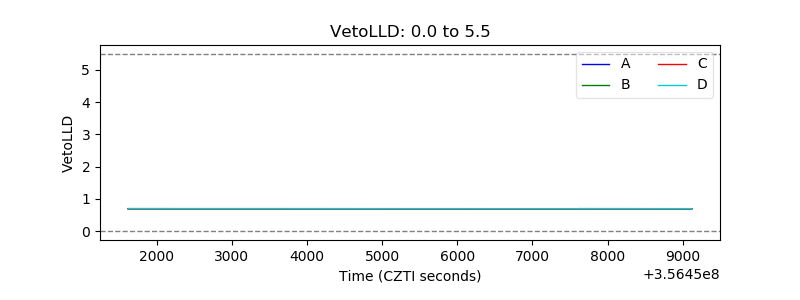 |
| Alpha Counter | 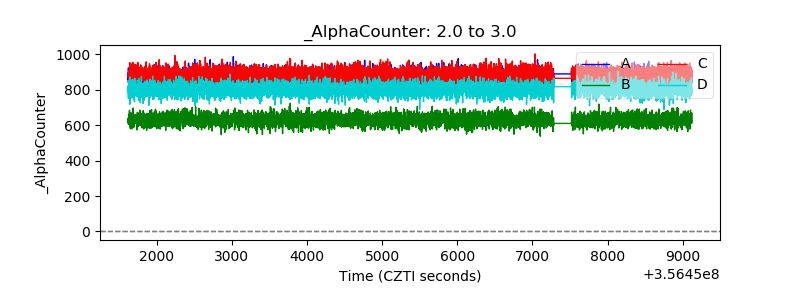 |
| _CPM_Rate | 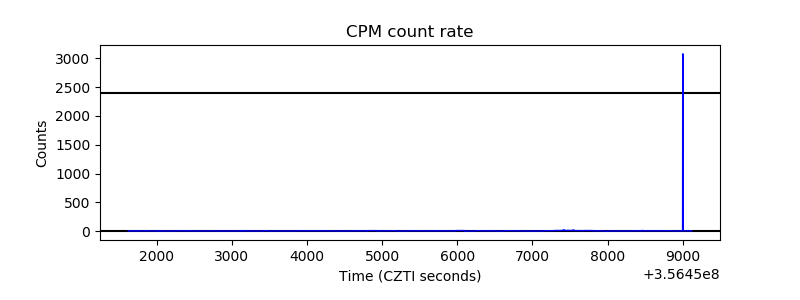 |
| CZT Counter | 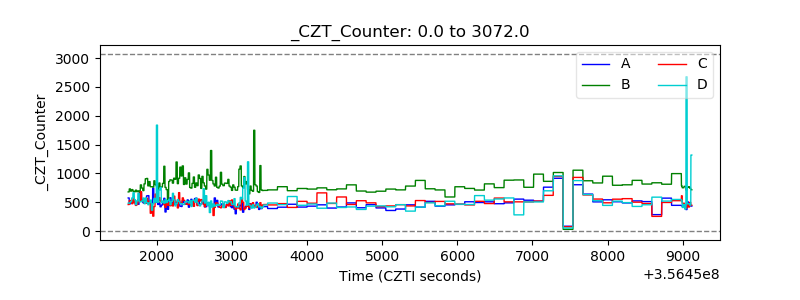 |
| +2.5 Volts monitor |  |
| +5 Volts monitor |  |
| _ROLL_ROT | 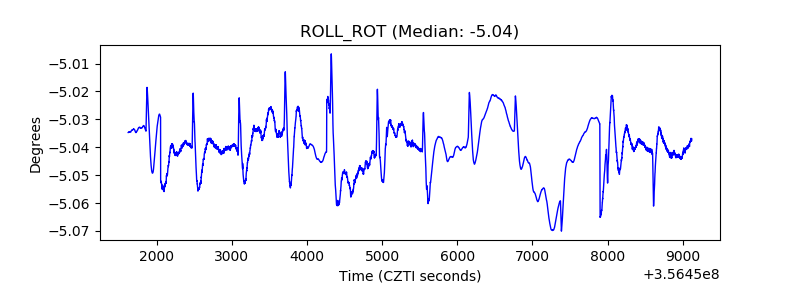 |
| _Roll_DEC | 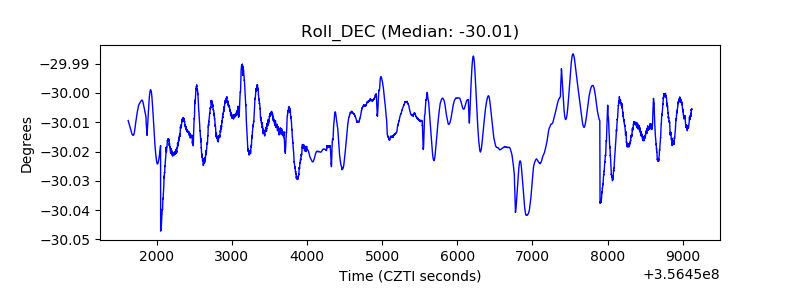 |
| _Roll_RA | 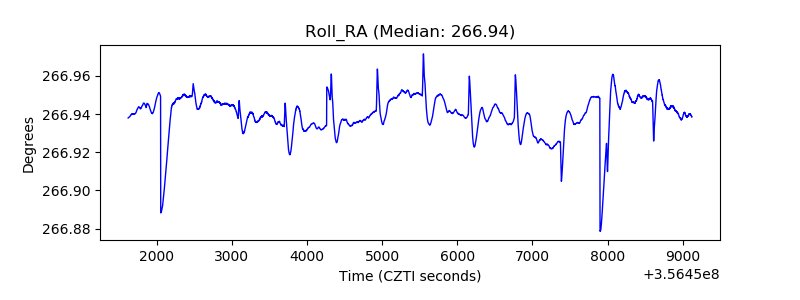 |
| Veto Counter | 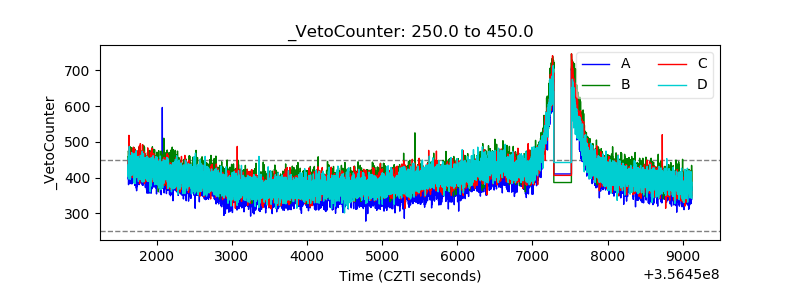 |