| Param | Original file | Final file |
|---|---|---|
| Filename | modeM0/AS1A10_082T06_9000004318_30044cztM0_level2.evt | modeM0/AS1A10_082T06_9000004318_30044cztM0_level2_quad_clean.evt |
| Size (bytes) | 568,825,920 | 89,884,800 |
| Size | 542.5 MB | 85.7 MB |
| Events in quadrant A | 3,482,428 | 567,144 |
| Events in quadrant B | 5,794,012 | 561,608 |
| Events in quadrant C | 3,561,227 | 546,550 |
| Events in quadrant D | 3,896,880 | 540,757 |
| Mode M0 | |||
|---|---|---|---|
| Quadrant | BADHDUFLAG | Total packets | Discarded packets |
| A | 0 | 15014 | 2 |
| B | 0 | 22355 | 2 |
| C | 0 | 15020 | 2 |
| D | 0 | 16211 | 2 |
| Mode M9 | |||
|---|---|---|---|
| Quadrant | BADHDUFLAG | Total packets | Discarded packets |
| A | 0 | 8 | 0 |
| B | 0 | 8 | 0 |
| C | 0 | 8 | 0 |
| D | 0 | 8 | 0 |
| Mode SS | |||
|---|---|---|---|
| Quadrant | BADHDUFLAG | Total packets | Discarded packets |
| A | 0 | 150 | 0 |
| B | 0 | 150 | 0 |
| C | 0 | 150 | 0 |
| D | 0 | 150 | 0 |
| Quadrant | Total seconds | Saturated seconds | Saturation percentage |
|---|---|---|---|
| A | 7262 | 102 | 1.404572% |
| B | 7263 | 196 | 2.698609% |
| C | 7263 | 149 | 2.051494% |
| D | 7263 | 116 | 1.597136% |
Noise dominated data is calculated using 1-second bins in cleaned event files. If a bin has >2000 counts, and if more than 50% of those come from <1% of pixels, then it is considered to be noise-dominated and hence unusable.
| Quadrant | # 1 sec bins | Bins with >0 counts | Bins with >2000 counts | High rate bins dominated by noise | Noise dominated (total time) | Noise dominated (detector-on time) | Marked lightcurve |
|---|---|---|---|---|---|---|---|
| A | 8077 | 7264 | 3 | 3 | 0.04% | 0.04% | 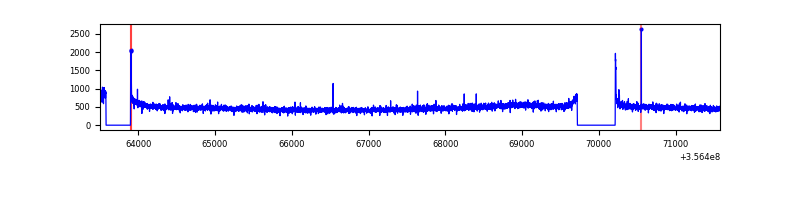 |
| B | 8078 | 7265 | 13 | 13 | 0.16% | 0.18% | 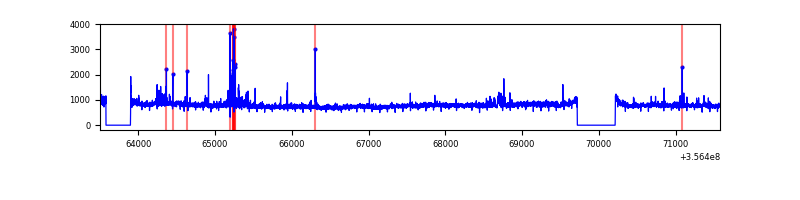 |
| C | 8078 | 7265 | 0 | 0 | 0.00% | 0.00% | 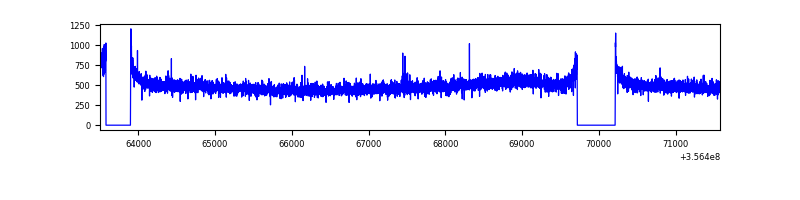 |
| D | 8078 | 7265 | 48 | 48 | 0.59% | 0.66% | 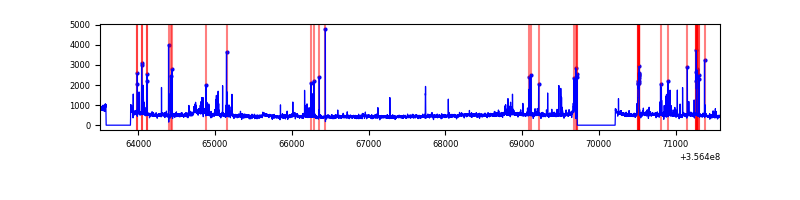 |
Top three noisy pixels from each quadrant. If the there are fewer than three noisy pixels in the level2.evt file, extra rows are filled as -1
| Pixel properties | Quadrant properties | ||||||
|---|---|---|---|---|---|---|---|
| Quadrant | DetID | PixID | Counts | Sigma | Mean | Median | Sigma |
| A | 8 | 192 | 25558 | 135.31 | 894 | 875 | 182.4 |
| A | 13 | 254 | 14428 | 74.29 | 894 | 875 | 182.4 |
| A | 3 | 137 | 9113 | 45.16 | 894 | 875 | 182.4 |
| B | 6 | 159 | 2103525 | 12300.48 | 881 | 859 | 170.9 |
| B | 5 | 255 | 130092 | 756.01 | 881 | 859 | 170.9 |
| B | 0 | 190 | 68413 | 395.19 | 881 | 859 | 170.9 |
| C | 14 | 238 | 138161 | 681.87 | 855 | 860 | 201.4 |
| C | 3 | 233 | 52333 | 255.63 | 855 | 860 | 201.4 |
| C | 2 | 114 | 17619 | 83.23 | 855 | 860 | 201.4 |
| D | 8 | 195 | 232157 | 1062.77 | 857 | 836 | 217.7 |
| D | 13 | 138 | 127679 | 582.76 | 857 | 836 | 217.7 |
| D | 7 | 238 | 69644 | 316.13 | 857 | 836 | 217.7 |
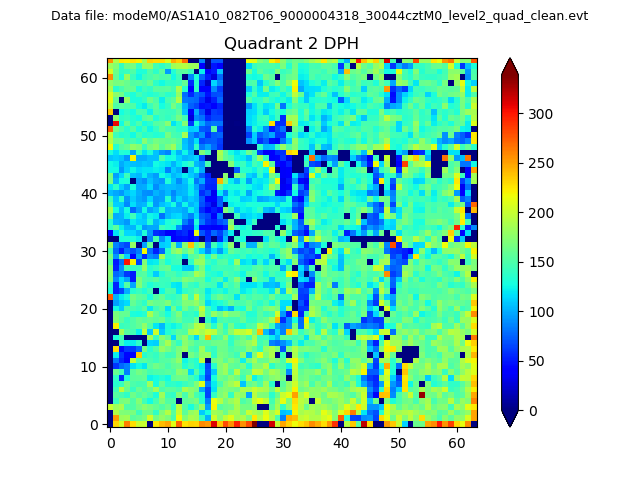
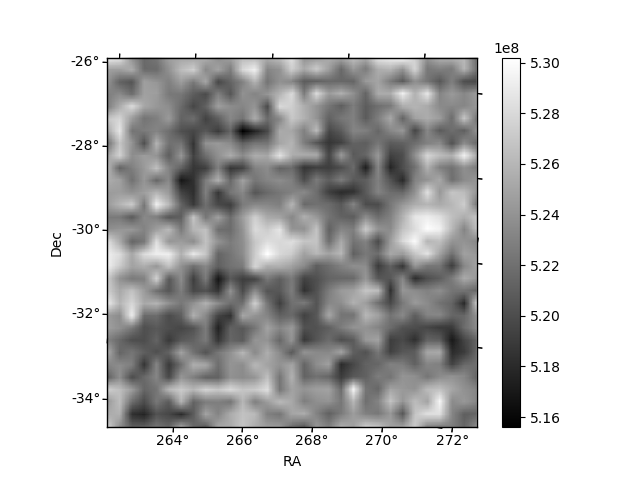
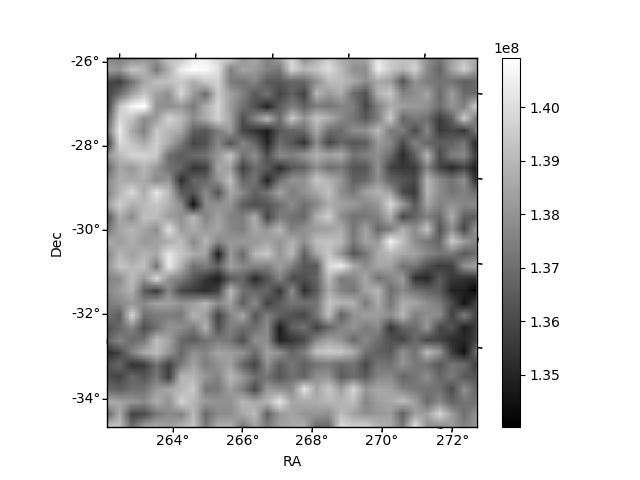
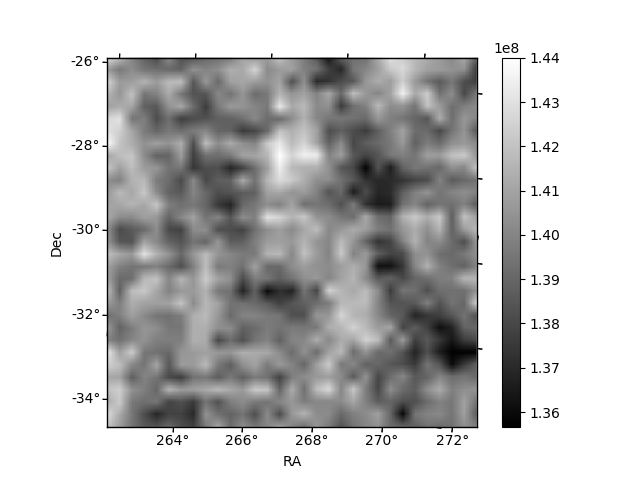
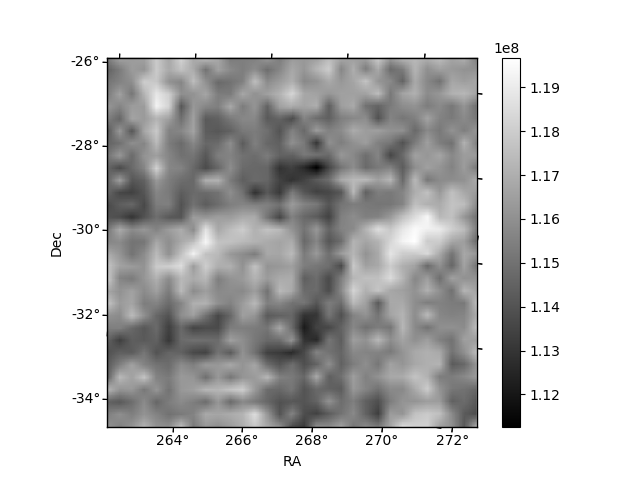
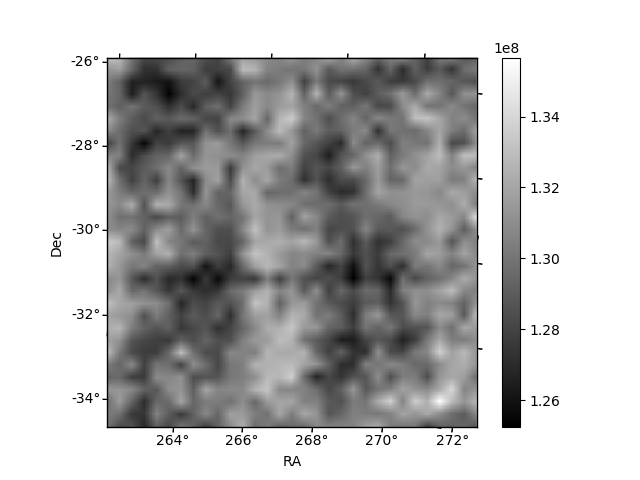
Histogram calculated using DETX and DETY for each event in the final _common_clean file
| Quadrant A | 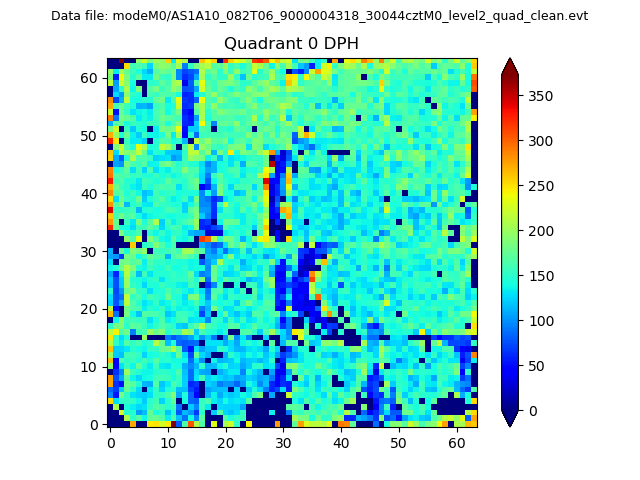 |
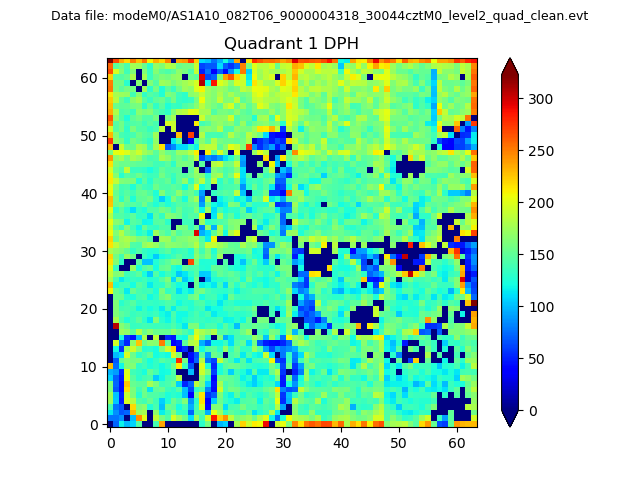 |
Quadrant B |
|---|---|---|---|
| Quadrant D | 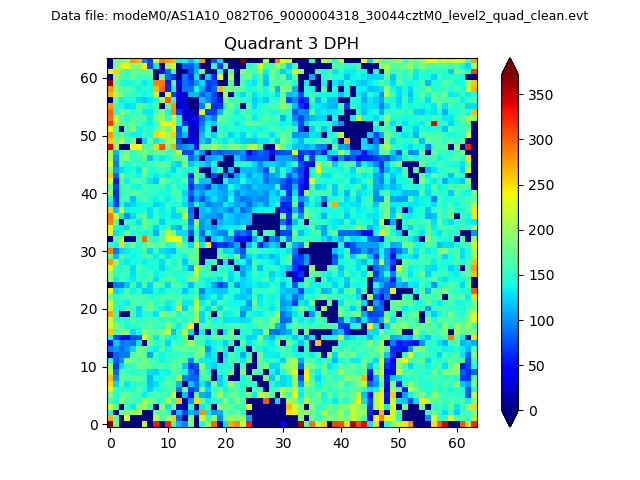 |
 |
Quadrant C |
| Plot type | Count rate plots | Images |
|---|---|---|
| Comparison with Poisson distribution Blue bars denote a histogram of data divided into 1 sec bins. Red curve is a Poisson curve with rate = median count rate of data. |
 |
 |
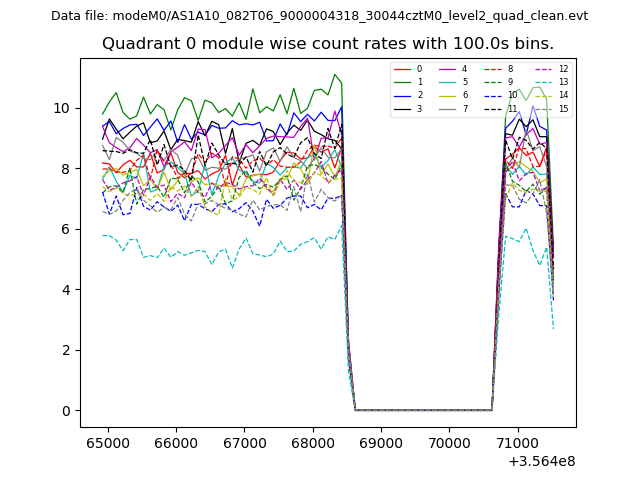
| Quadrant-wise count rates Data is divided into 100 sec bins |
 |
|
| Module-wise count rates for Quadrant A Data is divided into 100 sec bins |
 |
 |
| Module-wise count rates for Quadrant B Data is divided into 100 sec bins |
 |
 |
| Module-wise count rates for Quadrant C Data is divided into 100 sec bins |
 |
 |
| Module-wise count rates for Quadrant D Data is divided into 100 sec bins |
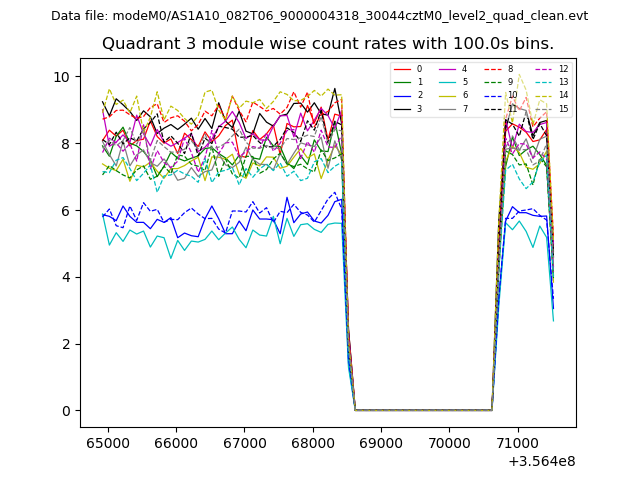 |
 |
| Parameter | Plot |
|---|---|
| CZT HV Monitor |  |
| D_VDD | 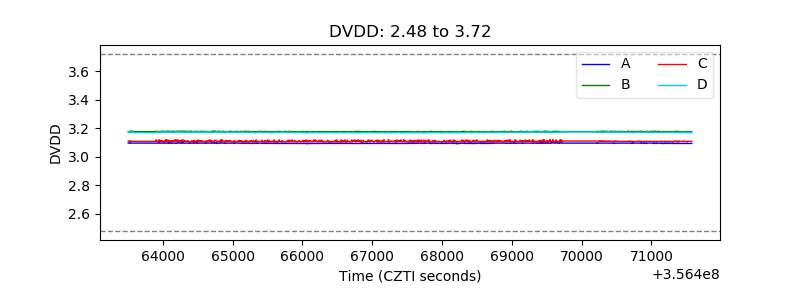 |
| Temperature 1 | 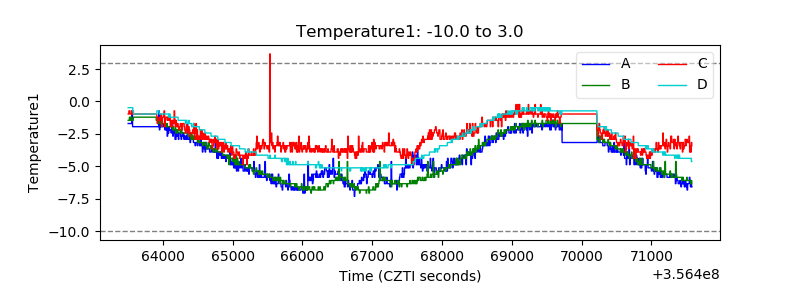 |
| Veto HV Monitor |  |
| Veto LLD | 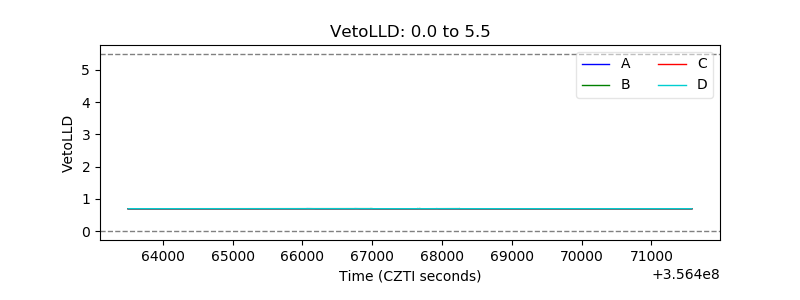 |
| Alpha Counter | 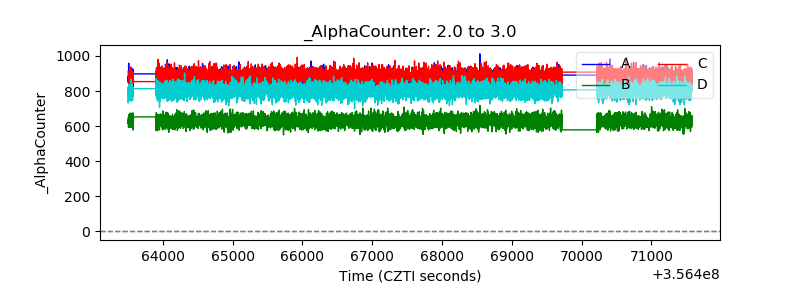 |
| _CPM_Rate | 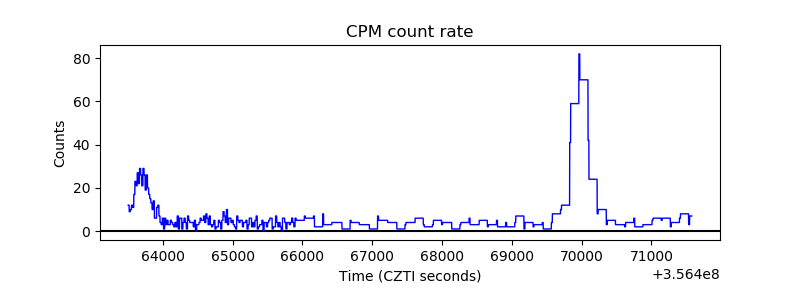 |
| CZT Counter | 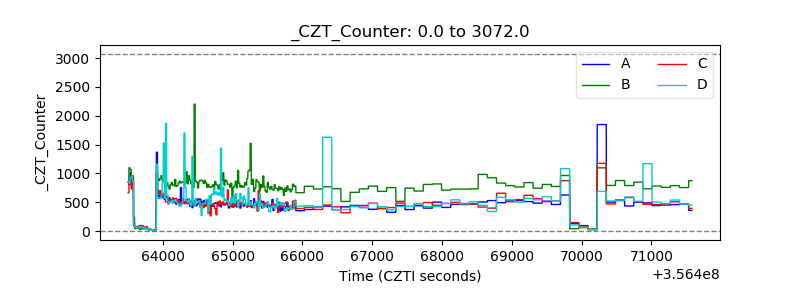 |
| +2.5 Volts monitor |  |
| +5 Volts monitor |  |
| _ROLL_ROT | 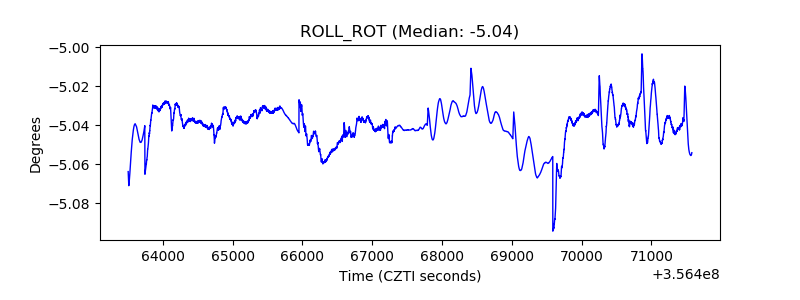 |
| _Roll_DEC | 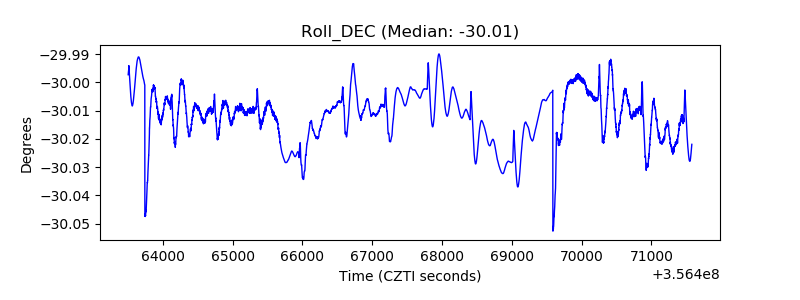 |
| _Roll_RA | 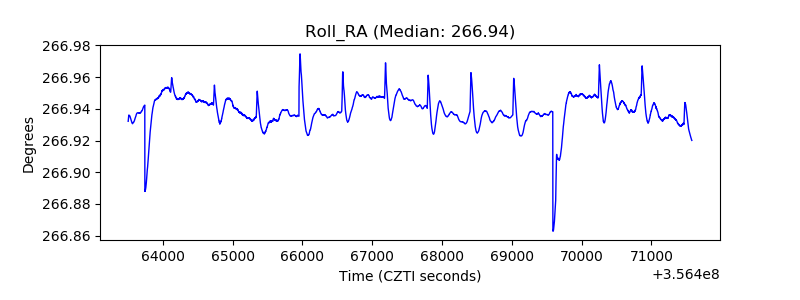 |
| Veto Counter | 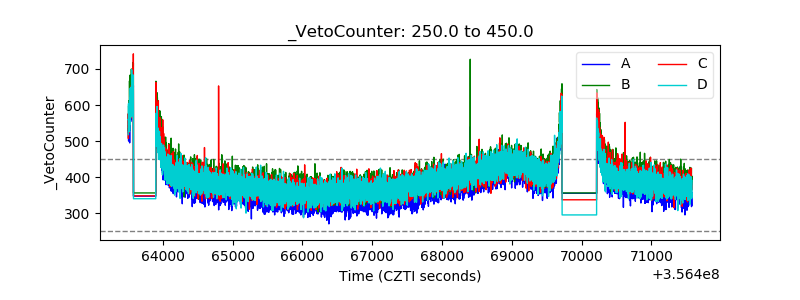 |