| Param | Original file | Final file |
|---|---|---|
| Filename | modeM0/AS1A10_071T07_9000004322cztM0_level2.fits | modeM0/AS1A10_071T07_9000004322cztM0_level2_quad_clean.evt |
| Size (bytes) | 605,439,360 | 439,217,280 |
| Size | 577.4 MB | 418.9 MB |
| Events in quadrant A | 3,838,630 | 2,455,632 |
| Events in quadrant B | 3,595,614 | 2,413,056 |
| Events in quadrant C | 3,585,820 | 2,241,867 |
| Events in quadrant D | 3,196,122 | 2,069,869 |
| Mode M0 | |||
|---|---|---|---|
| Quadrant | BADHDUFLAG | Total packets | Discarded packets |
| A | 0 | 125353 | 0 |
| B | 0 | 182241 | 0 |
| C | 0 | 134934 | 0 |
| D | 0 | 144172 | 0 |
| Mode SS | |||
|---|---|---|---|
| Quadrant | BADHDUFLAG | Total packets | Discarded packets |
| A | 0 | 1222 | 0 |
| B | 0 | 1222 | 0 |
| C | 0 | 1222 | 0 |
| D | 0 | 1222 | 0 |
| Mode M9 | |||
|---|---|---|---|
| Quadrant | BADHDUFLAG | Total packets | Discarded packets |
| A | 0 | 97 | 0 |
| B | 0 | 97 | 0 |
| C | 0 | 97 | 0 |
| D | 0 | 97 | 0 |
| Quadrant | Total seconds | Saturated seconds | Saturation percentage |
|---|---|---|---|
| A | 60033 | 719 | 1.197675% |
| B | 60033 | 1292 | 2.152150% |
| C | 60033 | 3038 | 5.060550% |
| D | 60033 | 2195 | 3.656322% |
Noise dominated data is calculated using 1-second bins in cleaned event files. If a bin has >2000 counts, and if more than 50% of those come from <1% of pixels, then it is considered to be noise-dominated and hence unusable.
| Quadrant | # 1 sec bins | Bins with >0 counts | Bins with >2000 counts | High rate bins dominated by noise | Noise dominated (total time) | Noise dominated (detector-on time) | Marked lightcurve |
|---|---|---|---|---|---|---|---|
| A | 69868 | 60033 | 0 | 0 | 0.00% | 0.00% | 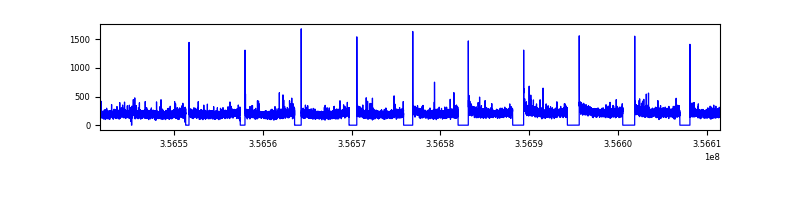 |
| B | 69868 | 60032 | 0 | 0 | 0.00% | 0.00% | 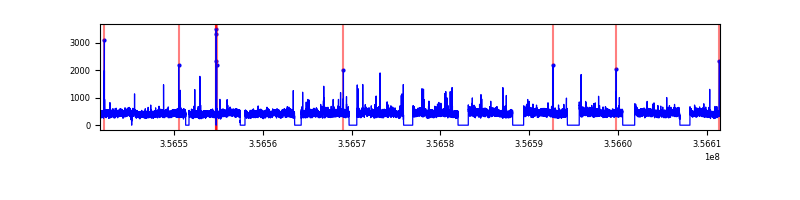 |
| C | 69868 | 59969 | 0 | 0 | 0.00% | 0.00% |  |
| D | 69868 | 60026 | 0 | 0 | 0.00% | 0.00% | 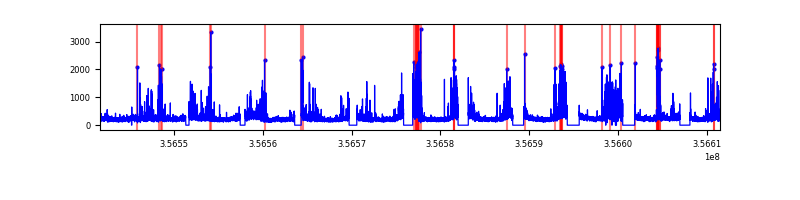 |
Top three noisy pixels from each quadrant. If the there are fewer than three noisy pixels in the level2.evt file, extra rows are filled as -1
| Pixel properties | Quadrant properties | ||||||
|---|---|---|---|---|---|---|---|
| Quadrant | DetID | PixID | Counts | Sigma | Mean | Median | Sigma |
| A | 0 | 29 | 3736 | 11.56 | 999 | 941 | 241.8 |
| A | 7 | 110 | 2901 | 8.11 | 999 | 941 | 241.8 |
| A | 0 | 30 | 2831 | 7.82 | 999 | 941 | 241.8 |
| B | 2 | 9 | 2757 | 9.77 | 951 | 909 | 189.1 |
| B | 2 | 8 | 2375 | 7.75 | 951 | 909 | 189.1 |
| B | 3 | 17 | 2365 | 7.7 | 951 | 909 | 189.1 |
| C | 1 | 80 | 2764 | 7.8 | 948 | 889 | 240.5 |
| C | 1 | 81 | 2729 | 7.65 | 948 | 889 | 240.5 |
| C | 12 | 241 | 2484 | 6.63 | 948 | 889 | 240.5 |
| D | 15 | 46 | 2363 | 6.25 | 913 | 831 | 245.3 |
| D | 6 | 67 | 2271 | 5.87 | 913 | 831 | 245.3 |
| D | 10 | 189 | 2270 | 5.87 | 913 | 831 | 245.3 |
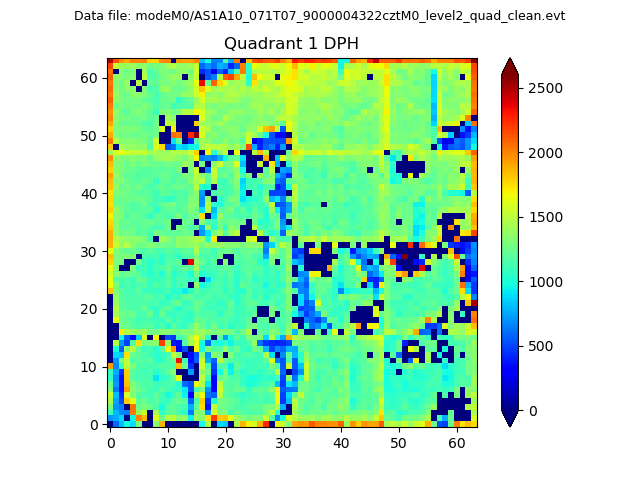
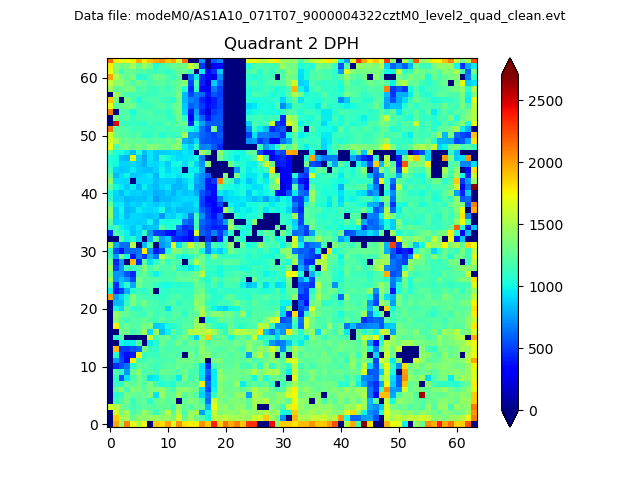
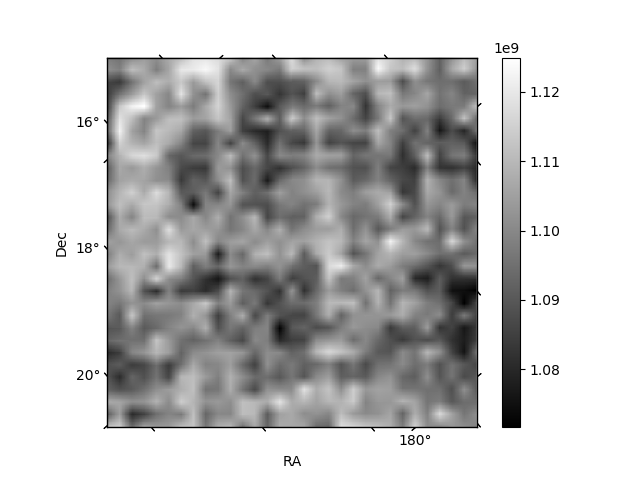
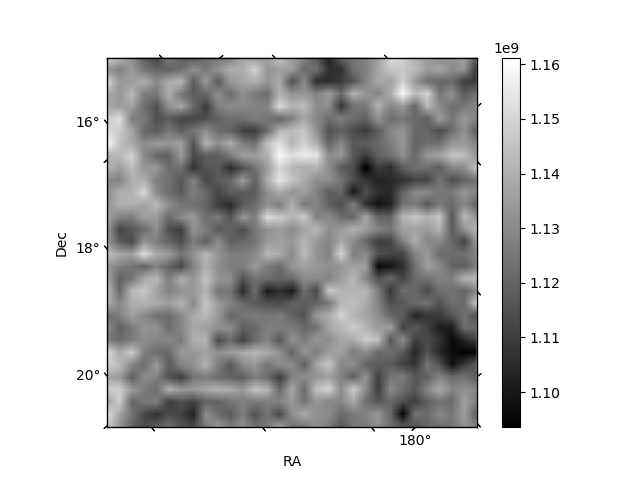
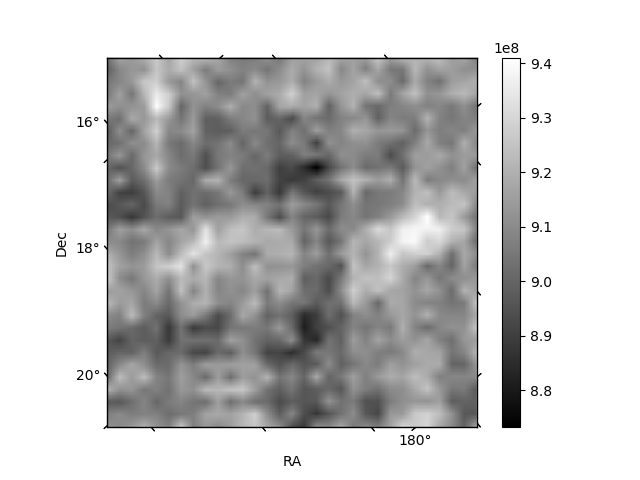
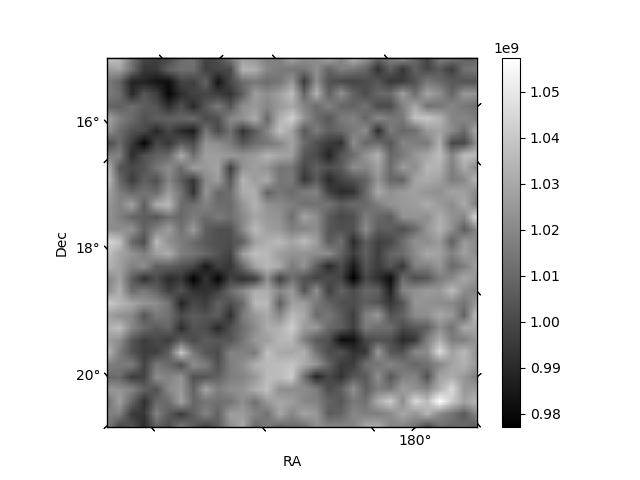
Histogram calculated using DETX and DETY for each event in the final _common_clean file
| Quadrant A | 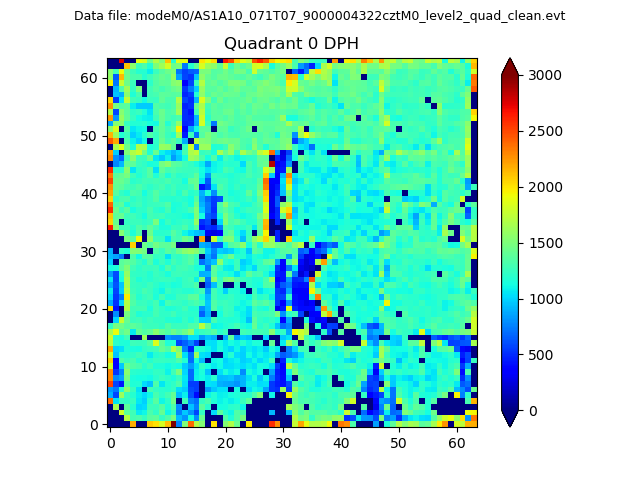 |
 |
Quadrant B |
|---|---|---|---|
| Quadrant D | 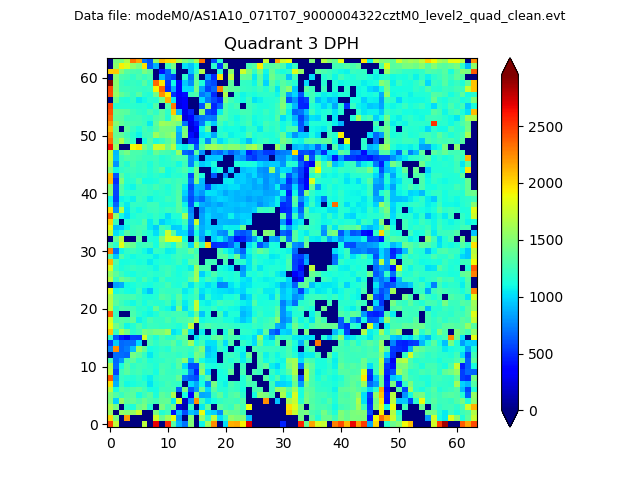 |
 |
Quadrant C |
| Plot type | Count rate plots | Images |
|---|---|---|
| Comparison with Poisson distribution Blue bars denote a histogram of data divided into 1 sec bins. Red curve is a Poisson curve with rate = median count rate of data. |
 |
 |
| Quadrant-wise count rates Data is divided into 100 sec bins |
 |
|
| Module-wise count rates for Quadrant A Data is divided into 100 sec bins |
 |
 |
| Module-wise count rates for Quadrant B Data is divided into 100 sec bins |
 |
 |
| Module-wise count rates for Quadrant C Data is divided into 100 sec bins |
 |
 |
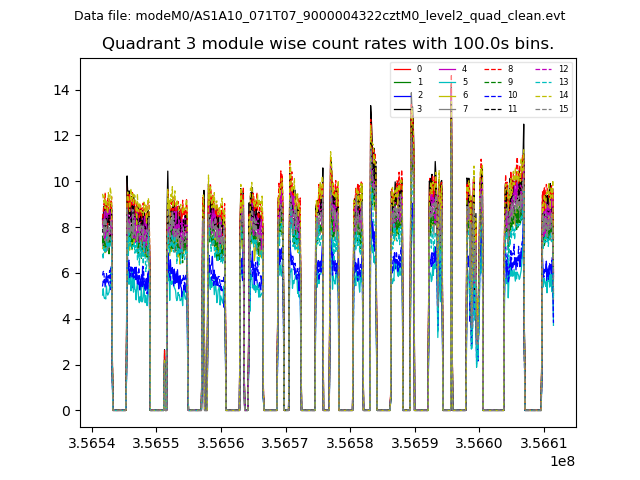
| Module-wise count rates for Quadrant D Data is divided into 100 sec bins |
 |
 |
| Parameter | Plot |
|---|---|
| CZT HV Monitor |  |
| D_VDD | 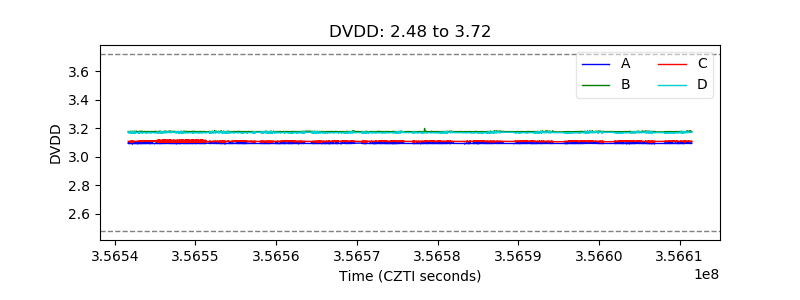 |
| Temperature 1 |  |
| Veto HV Monitor | 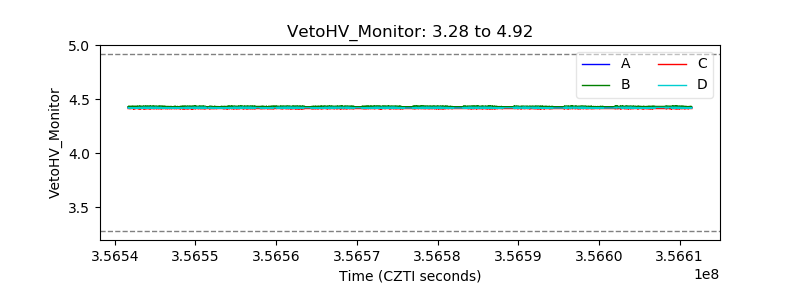 |
| Veto LLD | 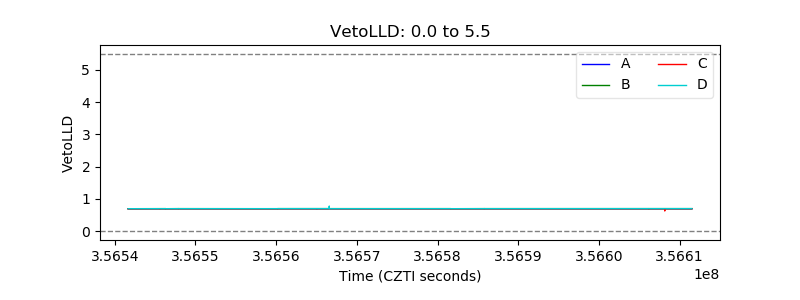 |
| Alpha Counter | 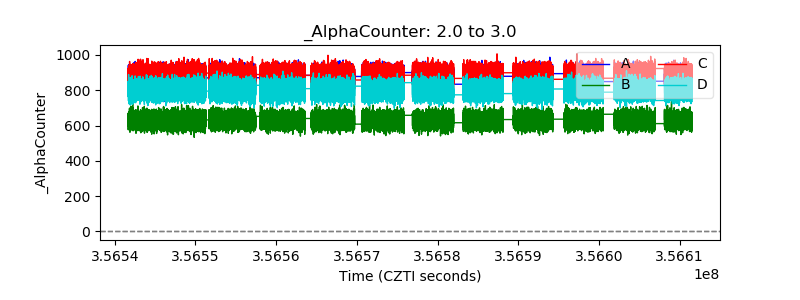 |
| _CPM_Rate | 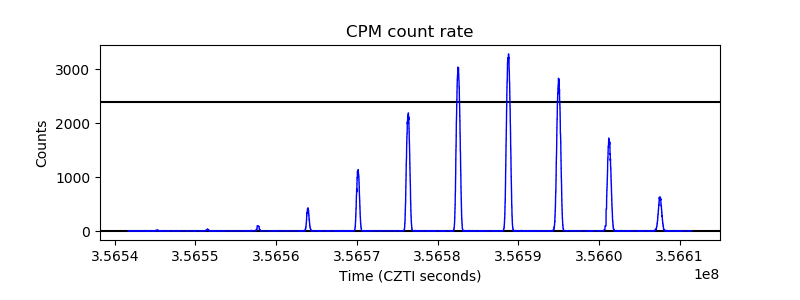 |
| CZT Counter |  |
| +2.5 Volts monitor |  |
| +5 Volts monitor | 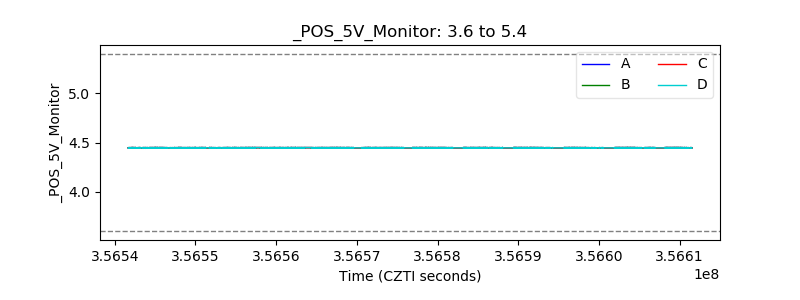 |
| _ROLL_ROT | 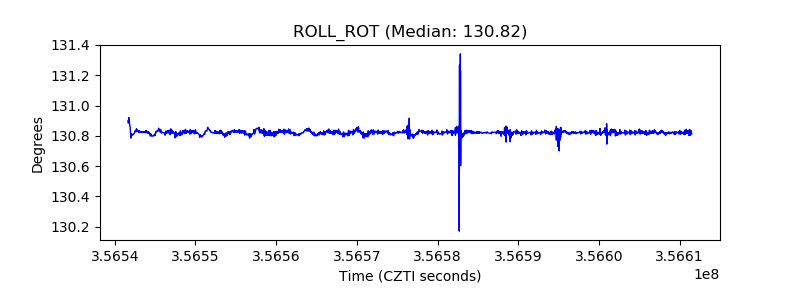 |
| _Roll_DEC | 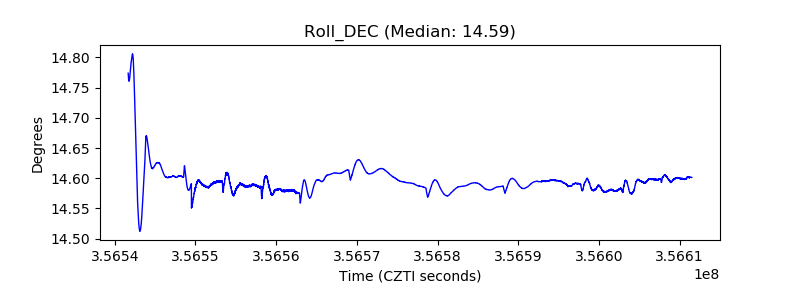 |
| _Roll_RA | 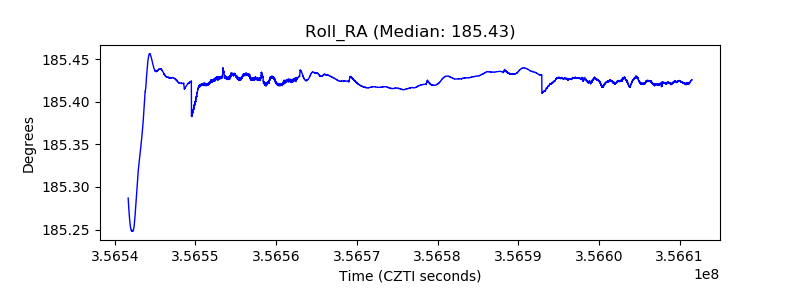 |
| Veto Counter | 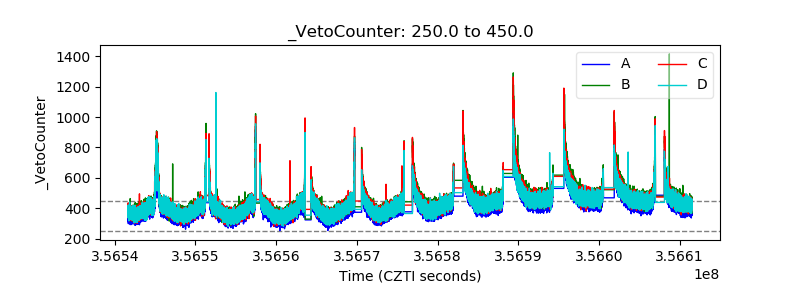 |