| Param | Original file | Final file |
|---|---|---|
| Filename | modeM0/AS1A10_071T07_9000004322_30055cztM0_level2.evt | modeM0/AS1A10_071T07_9000004322_30055cztM0_level2_quad_clean.evt |
| Size (bytes) | 419,843,520 | 60,865,920 |
| Size | 400.4 MB | 58.0 MB |
| Events in quadrant A | 2,621,585 | 382,846 |
| Events in quadrant B | 4,030,225 | 379,068 |
| Events in quadrant C | 3,051,410 | 351,247 |
| Events in quadrant D | 2,658,721 | 365,966 |
| Mode M0 | |||
|---|---|---|---|
| Quadrant | BADHDUFLAG | Total packets | Discarded packets |
| A | 0 | 11129 | 1 |
| B | 0 | 16035 | 1 |
| C | 0 | 12339 | 1 |
| D | 0 | 11252 | 1 |
| Mode SS | |||
|---|---|---|---|
| Quadrant | BADHDUFLAG | Total packets | Discarded packets |
| A | 0 | 104 | 0 |
| B | 0 | 104 | 0 |
| C | 0 | 104 | 0 |
| D | 0 | 104 | 0 |
| Quadrant | Total seconds | Saturated seconds | Saturation percentage |
|---|---|---|---|
| A | 5189 | 262 | 5.049142% |
| B | 5189 | 393 | 7.573714% |
| C | 5189 | 492 | 9.481596% |
| D | 5189 | 200 | 3.854307% |
Noise dominated data is calculated using 1-second bins in cleaned event files. If a bin has >2000 counts, and if more than 50% of those come from <1% of pixels, then it is considered to be noise-dominated and hence unusable.
| Quadrant | # 1 sec bins | Bins with >0 counts | Bins with >2000 counts | High rate bins dominated by noise | Noise dominated (total time) | Noise dominated (detector-on time) | Marked lightcurve |
|---|---|---|---|---|---|---|---|
| A | 5214 | 5190 | 0 | 0 | 0.00% | 0.00% | 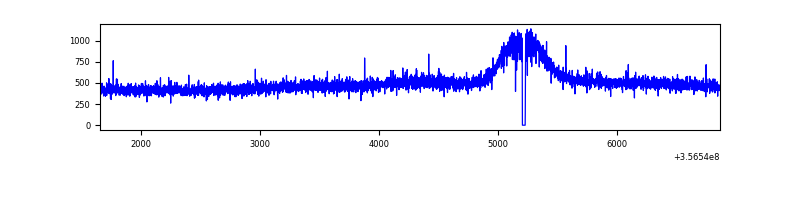 |
| B | 5214 | 5190 | 4 | 4 | 0.08% | 0.08% | 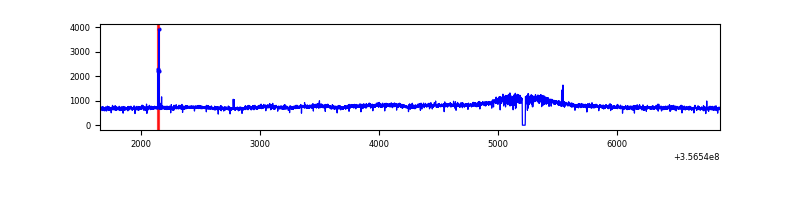 |
| C | 5214 | 5190 | 112 | 112 | 2.15% | 2.16% | 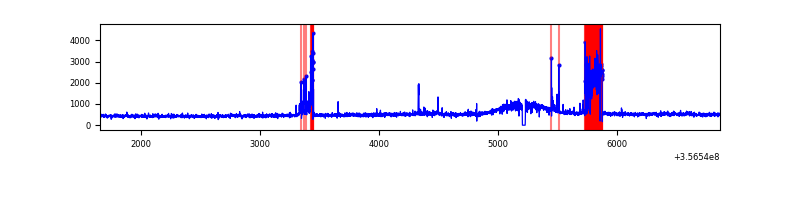 |
| D | 5214 | 5190 | 6 | 6 | 0.12% | 0.12% | 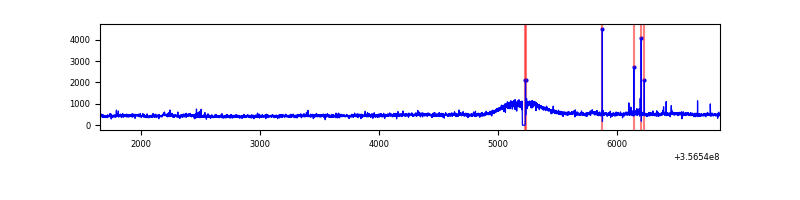 |
Top three noisy pixels from each quadrant. If the there are fewer than three noisy pixels in the level2.evt file, extra rows are filled as -1
| Pixel properties | Quadrant properties | ||||||
|---|---|---|---|---|---|---|---|
| Quadrant | DetID | PixID | Counts | Sigma | Mean | Median | Sigma |
| A | 13 | 254 | 9778 | 64.79 | 679 | 663 | 140.7 |
| A | 3 | 137 | 7328 | 47.37 | 679 | 663 | 140.7 |
| A | 0 | 226 | 5770 | 36.3 | 679 | 663 | 140.7 |
| B | 6 | 159 | 1427150 | 10853.46 | 656 | 639 | 131.4 |
| B | 5 | 250 | 16951 | 124.11 | 656 | 639 | 131.4 |
| B | 12 | 111 | 16769 | 122.72 | 656 | 639 | 131.4 |
| C | 15 | 208 | 404237 | 2660.28 | 628 | 632 | 151.7 |
| C | 14 | 238 | 103957 | 681.05 | 628 | 632 | 151.7 |
| C | 3 | 233 | 70495 | 460.49 | 628 | 632 | 151.7 |
| D | 8 | 195 | 123607 | 782.47 | 655 | 641 | 157.2 |
| D | 7 | 223 | 22553 | 139.43 | 655 | 641 | 157.2 |
| D | 2 | 234 | 21572 | 133.19 | 655 | 641 | 157.2 |
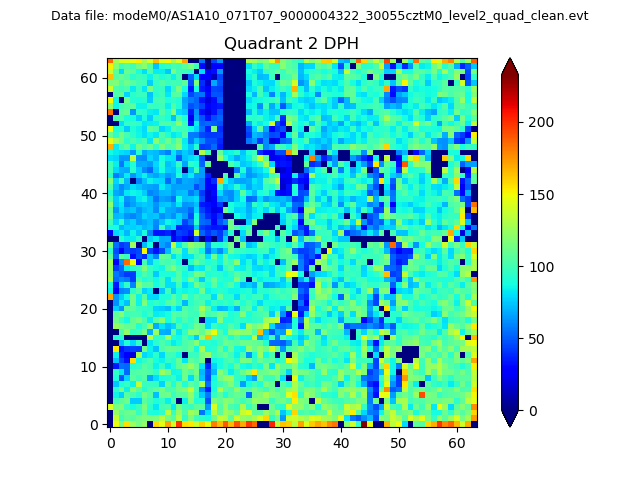
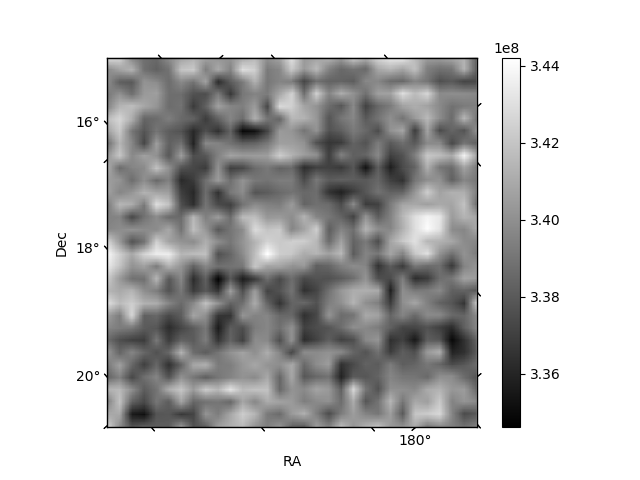
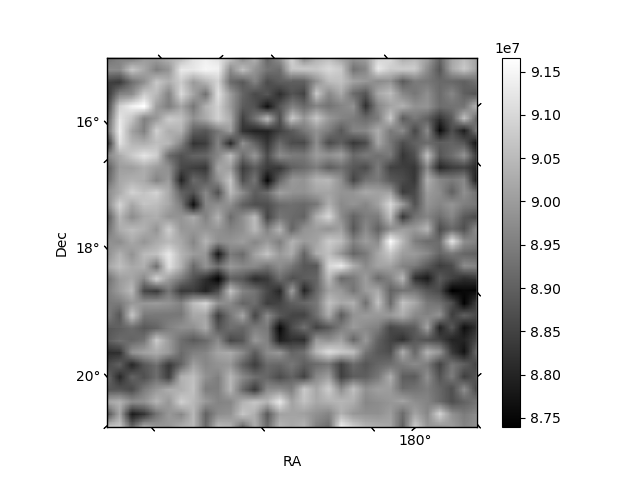
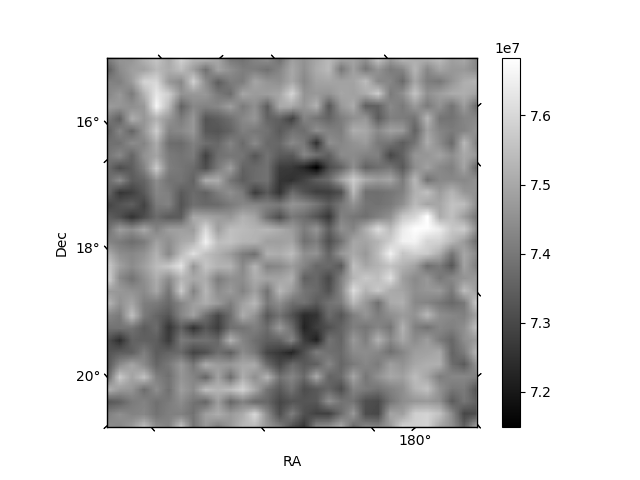
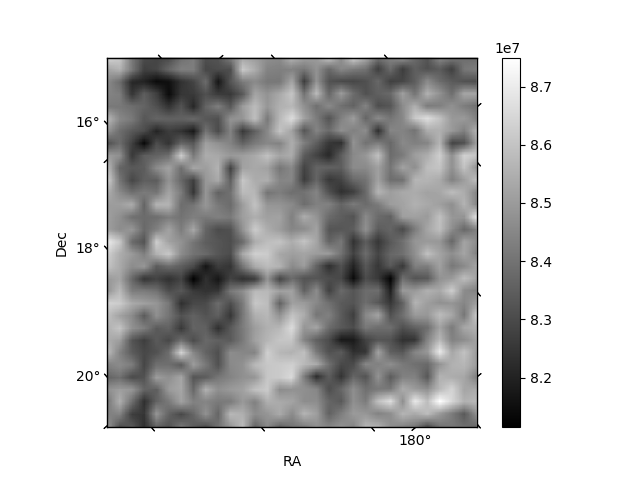
Histogram calculated using DETX and DETY for each event in the final _common_clean file
| Quadrant A | 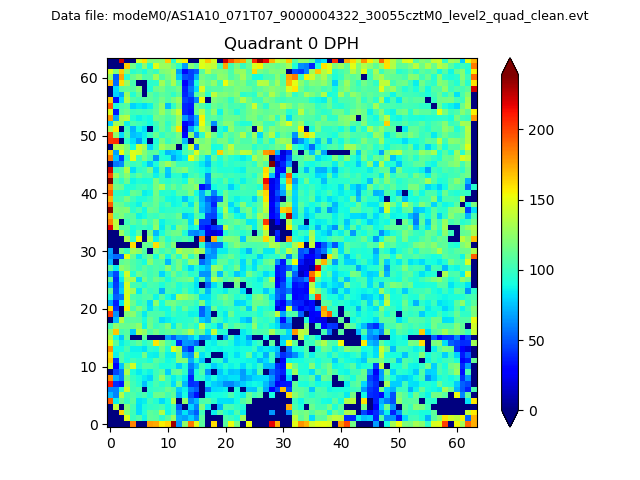 |
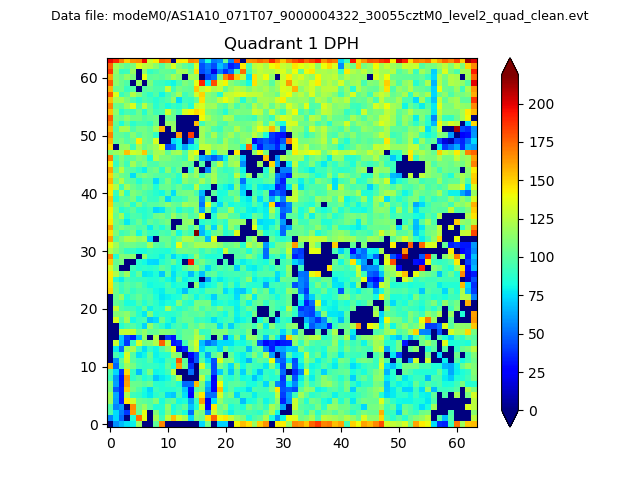 |
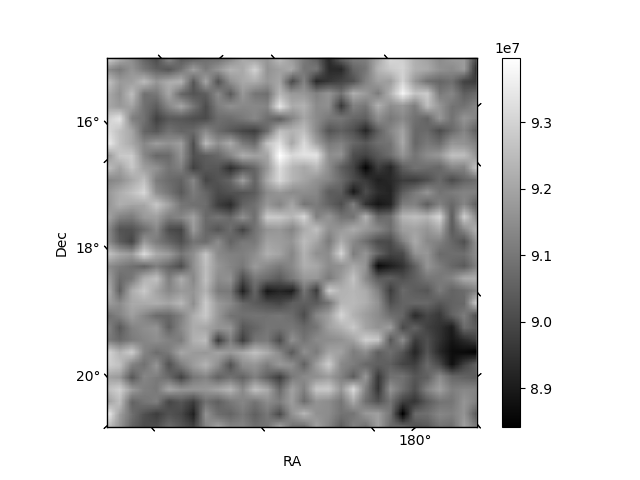
Quadrant B |
|---|---|---|---|
| Quadrant D | 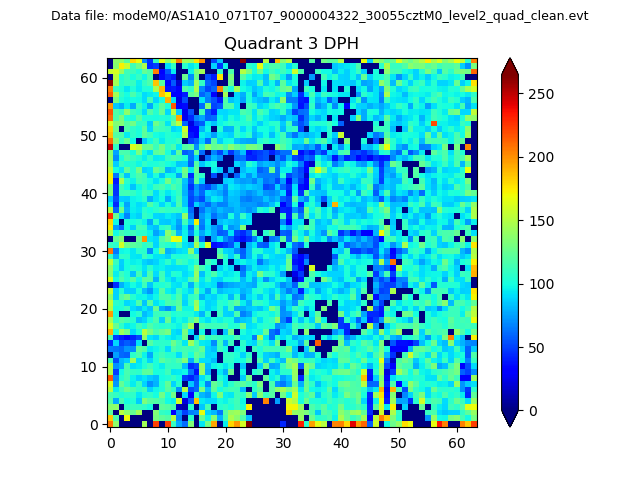 |
 |
Quadrant C |
| Plot type | Count rate plots | Images |
|---|---|---|
| Comparison with Poisson distribution Blue bars denote a histogram of data divided into 1 sec bins. Red curve is a Poisson curve with rate = median count rate of data. |
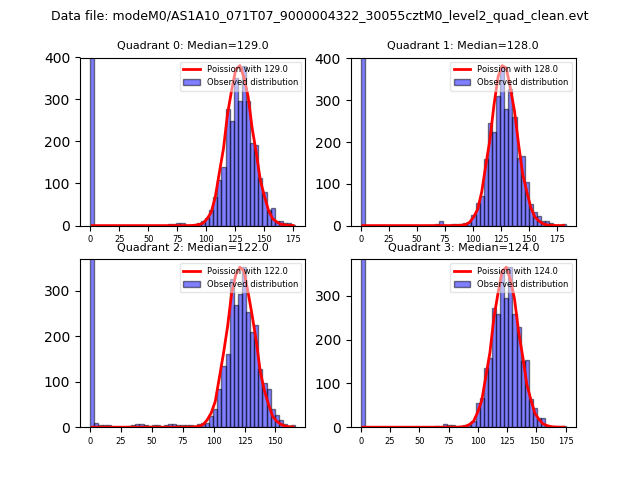 |
 |
| Quadrant-wise count rates Data is divided into 100 sec bins |
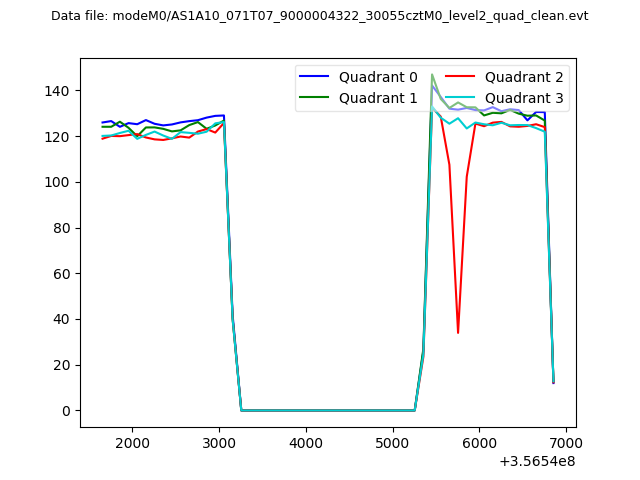 |
|
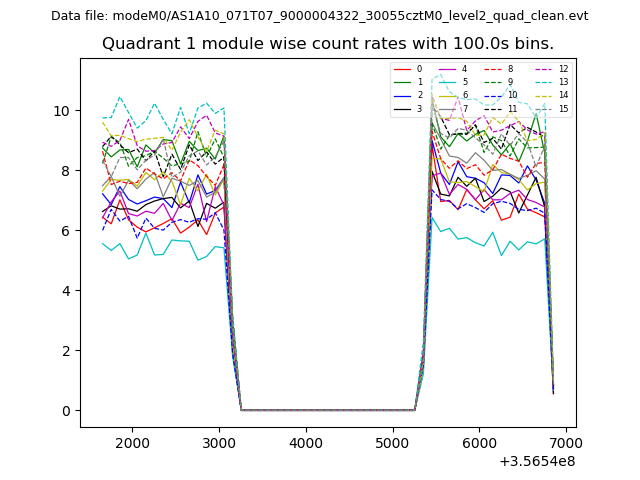
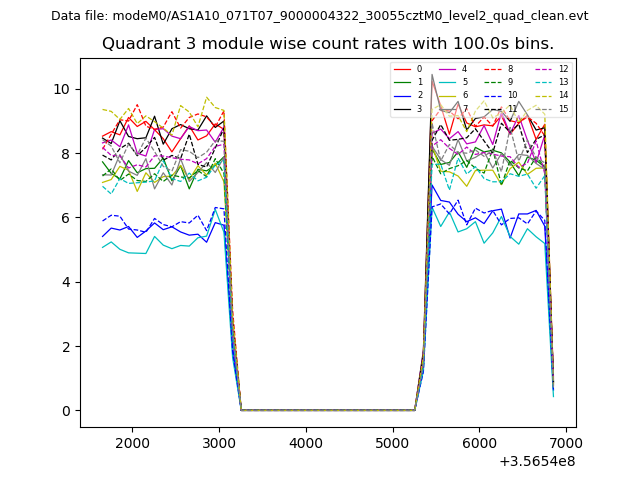
| Module-wise count rates for Quadrant A Data is divided into 100 sec bins |
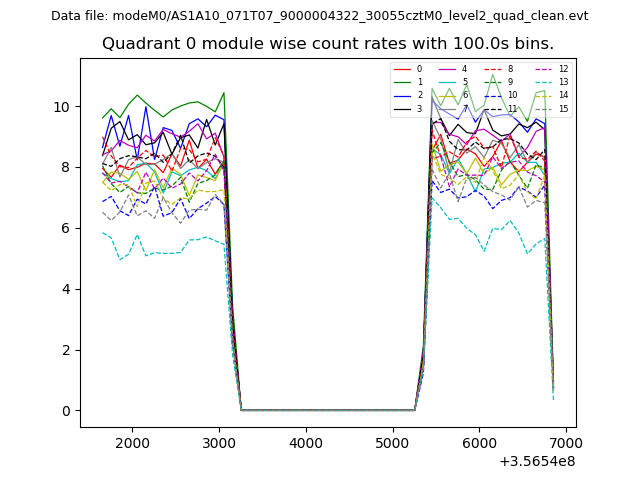 |
 |
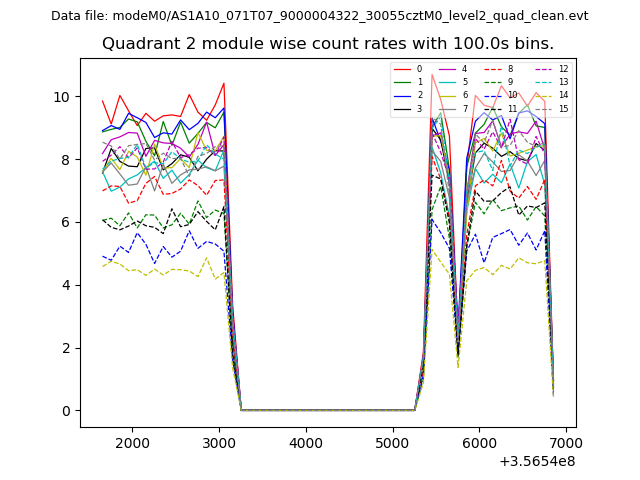
| Module-wise count rates for Quadrant B Data is divided into 100 sec bins |
 |
 |
| Module-wise count rates for Quadrant C Data is divided into 100 sec bins |
 |
 |
| Module-wise count rates for Quadrant D Data is divided into 100 sec bins |
 |
 |
| Parameter | Plot |
|---|---|
| CZT HV Monitor | 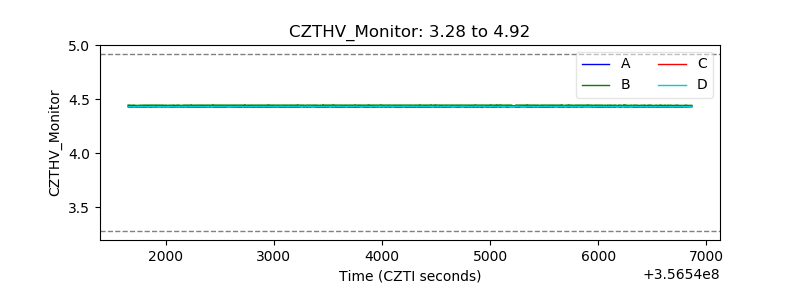 |
| D_VDD | 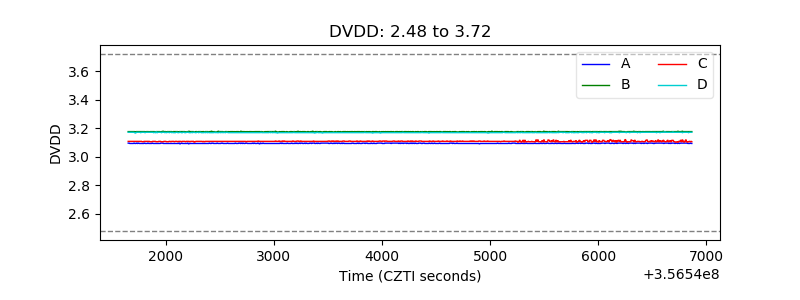 |
| Temperature 1 | 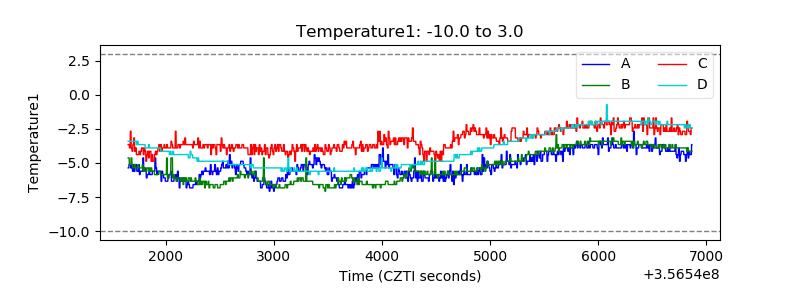 |
| Veto HV Monitor | 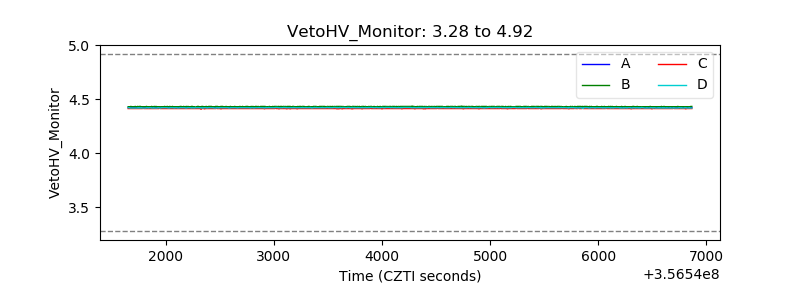 |
| Veto LLD | 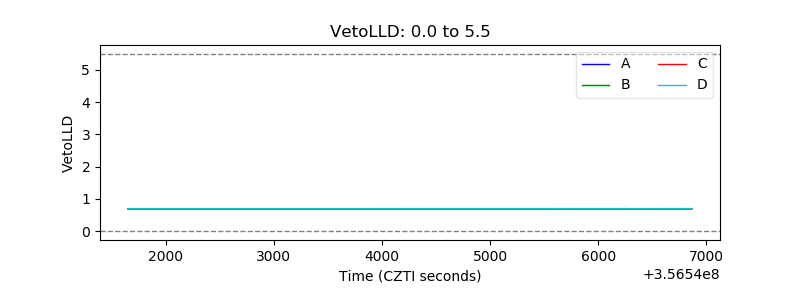 |
| Alpha Counter | 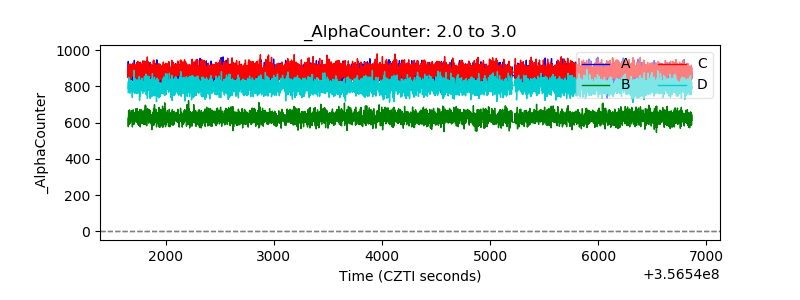 |
| _CPM_Rate | 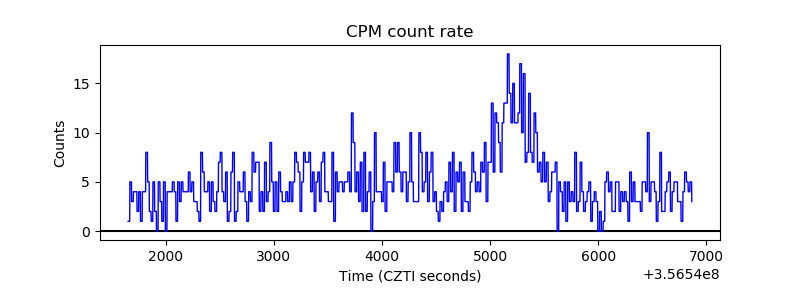 |
| CZT Counter | 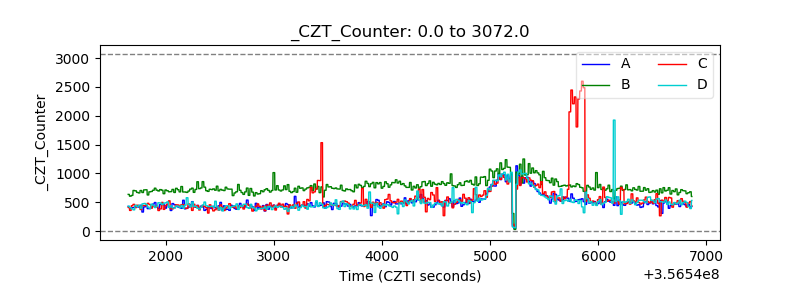 |
| +2.5 Volts monitor |  |
| +5 Volts monitor |  |
| _ROLL_ROT | 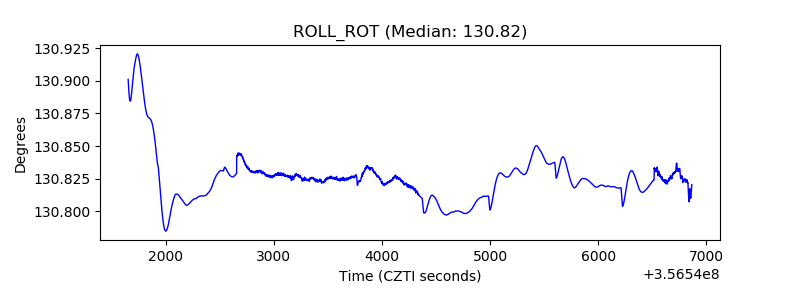 |
| _Roll_DEC | 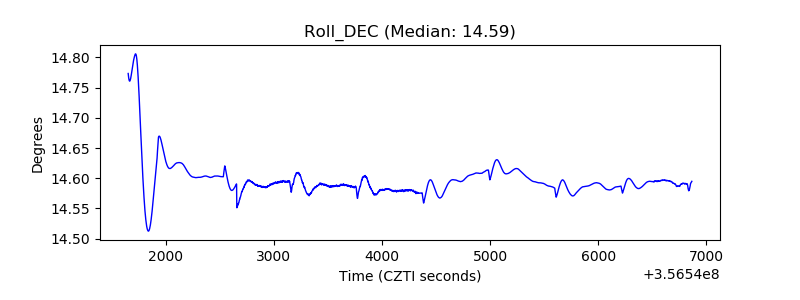 |
| _Roll_RA | 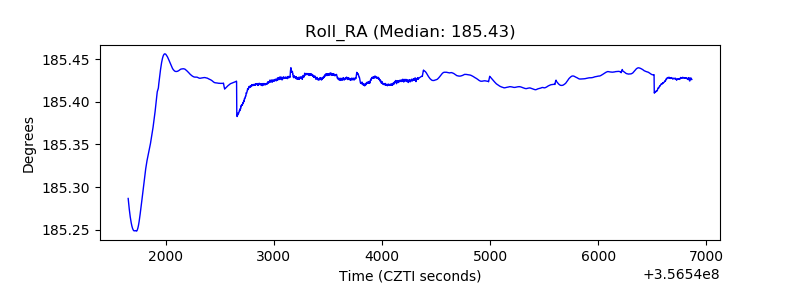 |
| Veto Counter | 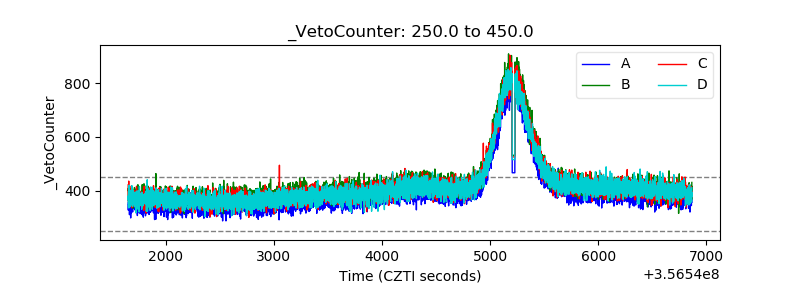 |