| Param | Original file | Final file |
|---|---|---|
| Filename | modeM0/AS1A10_071T07_9000004322_30056cztM0_level2.evt | modeM0/AS1A10_071T07_9000004322_30056cztM0_level2_quad_clean.evt |
| Size (bytes) | 661,282,560 | 104,656,320 |
| Size | 630.6 MB | 99.8 MB |
| Events in quadrant A | 4,049,334 | 673,612 |
| Events in quadrant B | 6,148,767 | 668,908 |
| Events in quadrant C | 4,621,289 | 627,545 |
| Events in quadrant D | 4,660,750 | 638,422 |
| Mode M0 | |||
|---|---|---|---|
| Quadrant | BADHDUFLAG | Total packets | Discarded packets |
| A | 0 | 17273 | 2 |
| B | 0 | 24797 | 2 |
| C | 0 | 18839 | 3 |
| D | 0 | 18919 | 2 |
| Mode SS | |||
|---|---|---|---|
| Quadrant | BADHDUFLAG | Total packets | Discarded packets |
| A | 0 | 164 | 0 |
| B | 0 | 164 | 0 |
| C | 0 | 164 | 0 |
| D | 0 | 164 | 0 |
| Mode M9 | |||
|---|---|---|---|
| Quadrant | BADHDUFLAG | Total packets | Discarded packets |
| A | 0 | 4 | 0 |
| B | 0 | 4 | 0 |
| C | 0 | 4 | 0 |
| D | 0 | 4 | 0 |
| Quadrant | Total seconds | Saturated seconds | Saturation percentage |
|---|---|---|---|
| A | 8068 | 330 | 4.090233% |
| B | 8068 | 514 | 6.370848% |
| C | 8068 | 610 | 7.560734% |
| D | 8068 | 314 | 3.891919% |
Noise dominated data is calculated using 1-second bins in cleaned event files. If a bin has >2000 counts, and if more than 50% of those come from <1% of pixels, then it is considered to be noise-dominated and hence unusable.
| Quadrant | # 1 sec bins | Bins with >0 counts | Bins with >2000 counts | High rate bins dominated by noise | Noise dominated (total time) | Noise dominated (detector-on time) | Marked lightcurve |
|---|---|---|---|---|---|---|---|
| A | 8468 | 8070 | 0 | 0 | 0.00% | 0.00% | 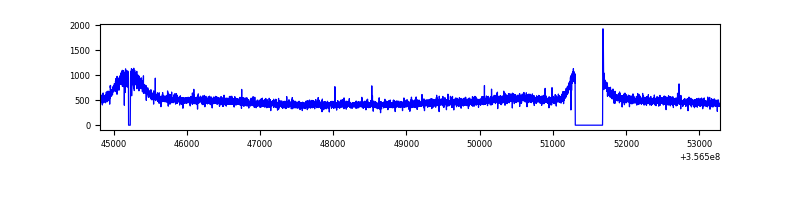 |
| B | 8468 | 8070 | 2 | 2 | 0.02% | 0.02% | 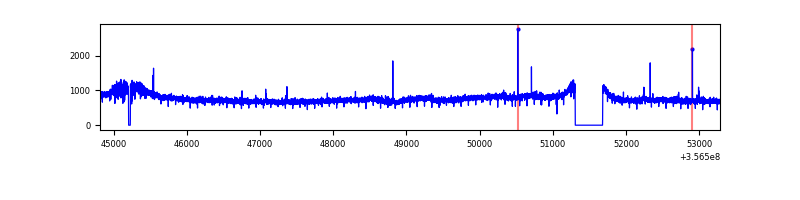 |
| C | 8468 | 8070 | 96 | 96 | 1.13% | 1.19% | 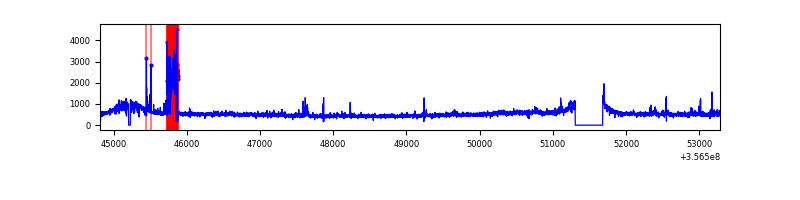 |
| D | 8468 | 8070 | 52 | 52 | 0.61% | 0.64% | 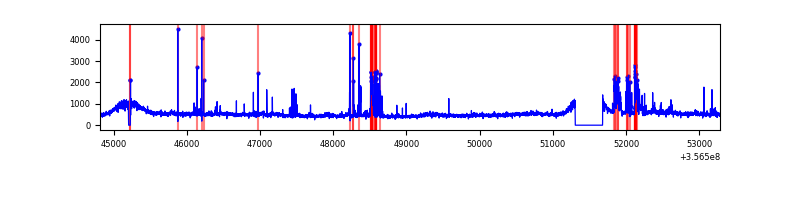 |
Top three noisy pixels from each quadrant. If the there are fewer than three noisy pixels in the level2.evt file, extra rows are filled as -1
| Pixel properties | Quadrant properties | ||||||
|---|---|---|---|---|---|---|---|
| Quadrant | DetID | PixID | Counts | Sigma | Mean | Median | Sigma |
| A | 13 | 254 | 14902 | 64.88 | 1046 | 1022 | 213.9 |
| A | 8 | 192 | 13529 | 58.46 | 1046 | 1022 | 213.9 |
| A | 3 | 137 | 11273 | 47.92 | 1046 | 1022 | 213.9 |
| B | 6 | 159 | 2138499 | 10602.87 | 1014 | 986 | 201.6 |
| B | 12 | 111 | 25596 | 122.07 | 1014 | 986 | 201.6 |
| B | 11 | 111 | 23955 | 113.93 | 1014 | 986 | 201.6 |
| C | 15 | 208 | 320648 | 1359.47 | 980 | 987 | 235.1 |
| C | 3 | 233 | 249799 | 1058.16 | 980 | 987 | 235.1 |
| C | 14 | 238 | 168716 | 713.33 | 980 | 987 | 235.1 |
| D | 13 | 104 | 349986 | 1445.24 | 1016 | 995 | 241.5 |
| D | 8 | 195 | 253589 | 1046.04 | 1016 | 995 | 241.5 |
| D | 7 | 223 | 107606 | 441.5 | 1016 | 995 | 241.5 |
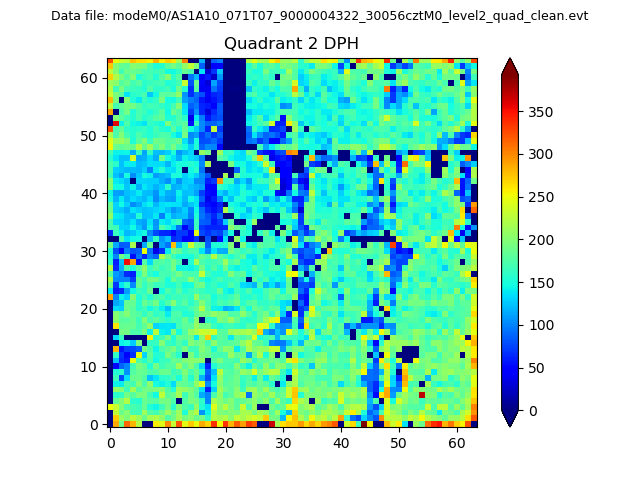
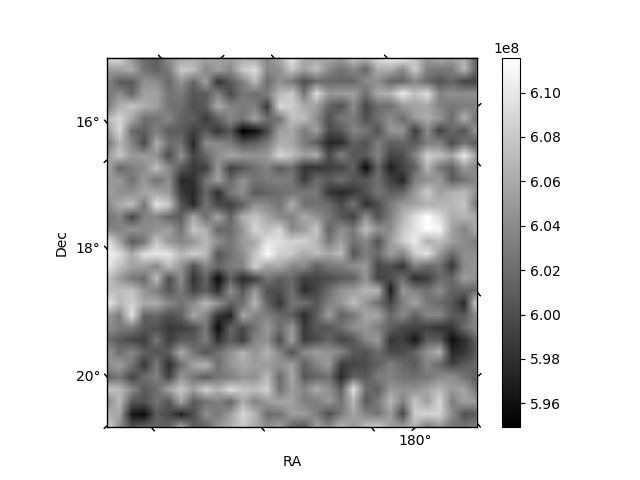
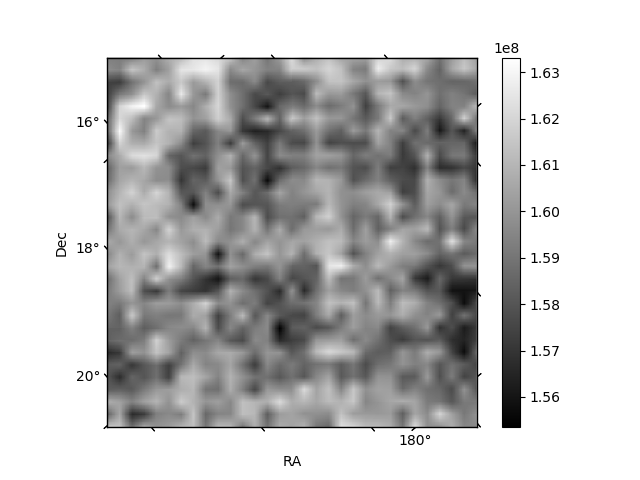
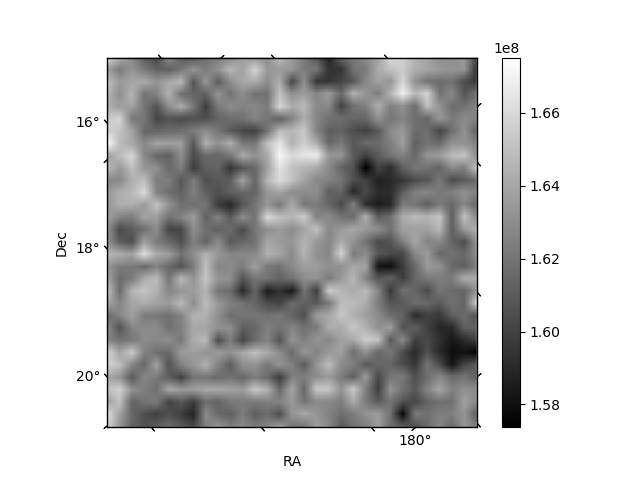
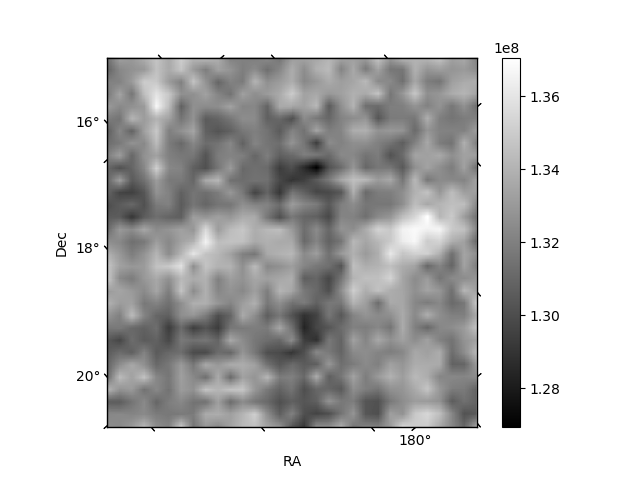
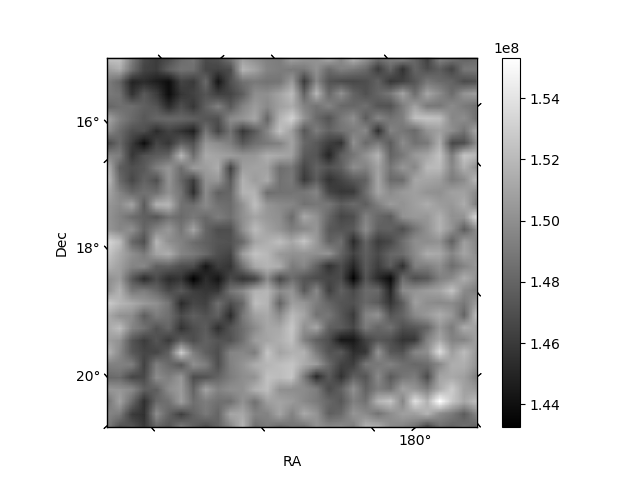
Histogram calculated using DETX and DETY for each event in the final _common_clean file
| Quadrant A | 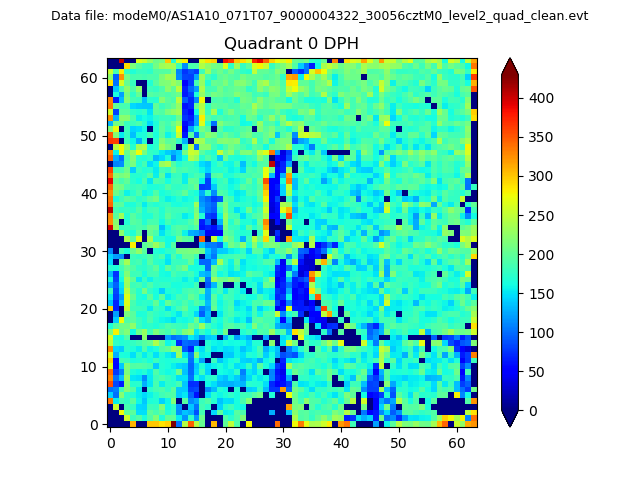 |
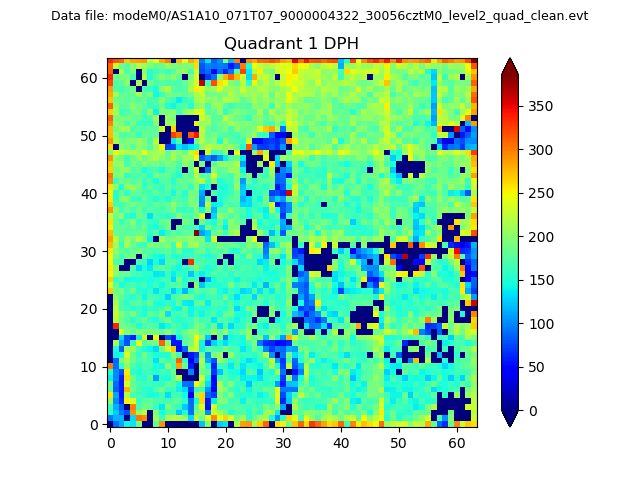 |
Quadrant B |
|---|---|---|---|
| Quadrant D | 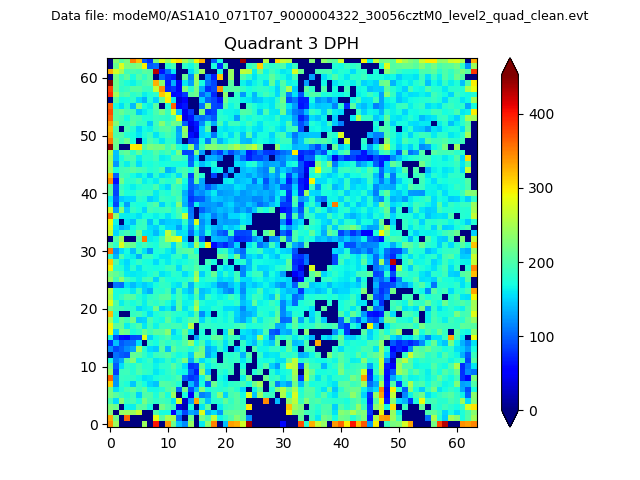 |
 |
Quadrant C |
| Plot type | Count rate plots | Images |
|---|---|---|
| Comparison with Poisson distribution Blue bars denote a histogram of data divided into 1 sec bins. Red curve is a Poisson curve with rate = median count rate of data. |
 |
 |
| Quadrant-wise count rates Data is divided into 100 sec bins |
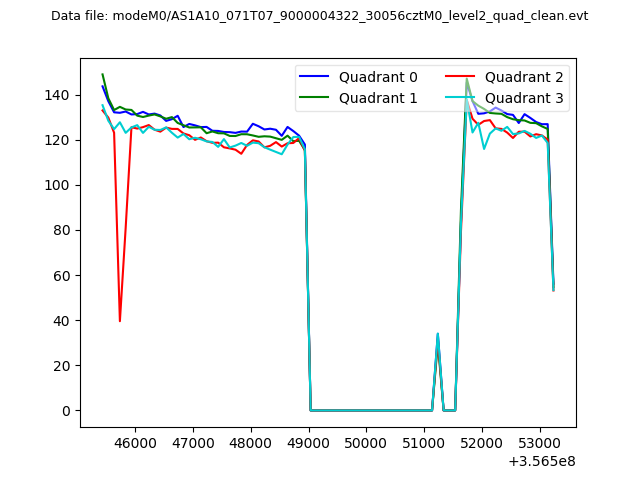 |
|
| Module-wise count rates for Quadrant A Data is divided into 100 sec bins |
 |
 |
| Module-wise count rates for Quadrant B Data is divided into 100 sec bins |
 |
 |
| Module-wise count rates for Quadrant C Data is divided into 100 sec bins |
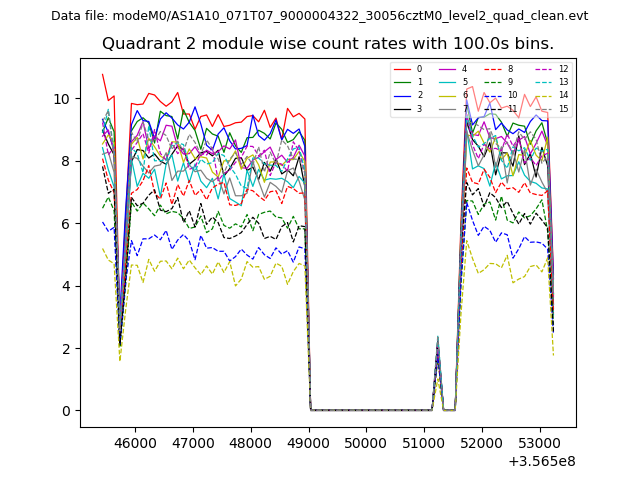 |
 |
| Module-wise count rates for Quadrant D Data is divided into 100 sec bins |
 |
 |
| Parameter | Plot |
|---|---|
| CZT HV Monitor | 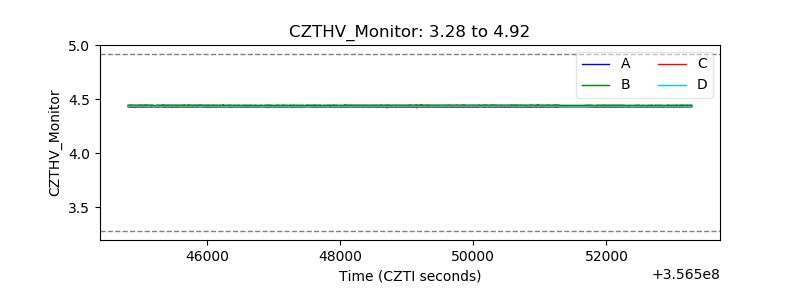 |
| D_VDD | 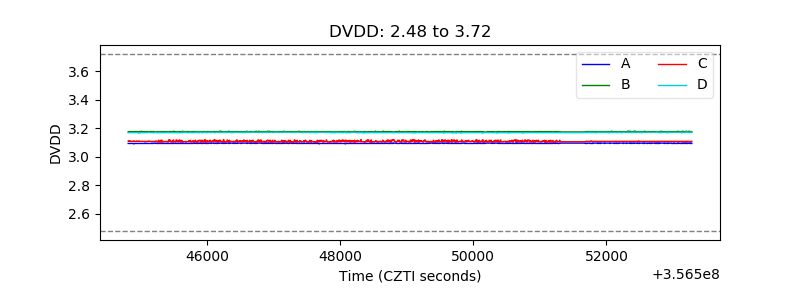 |
| Temperature 1 | 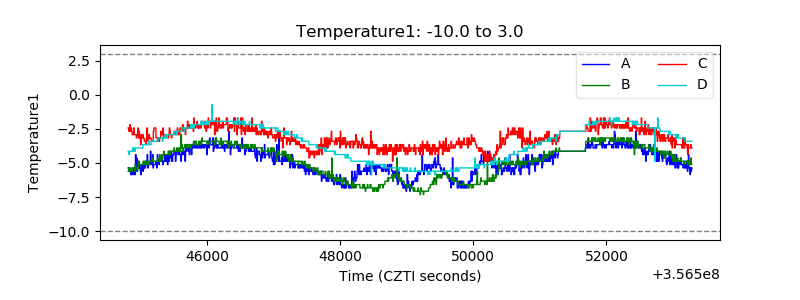 |
| Veto HV Monitor | 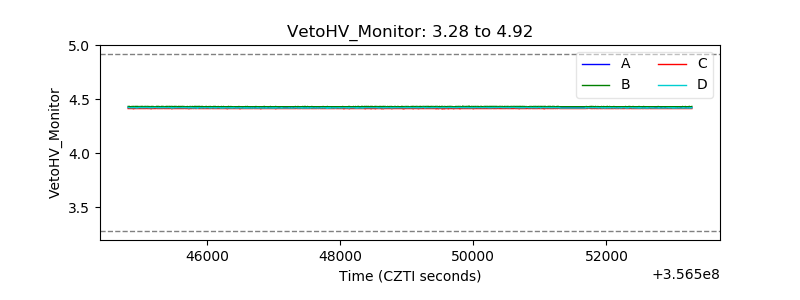 |
| Veto LLD | 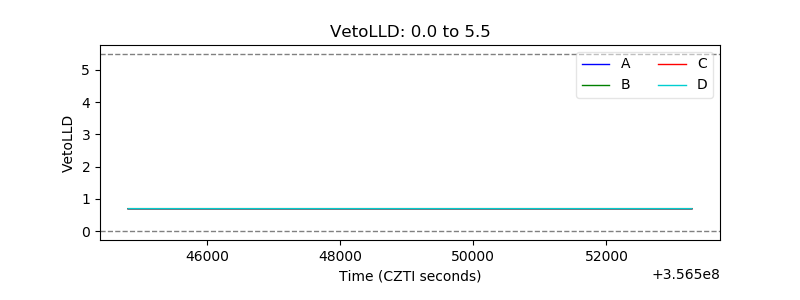 |
| Alpha Counter | 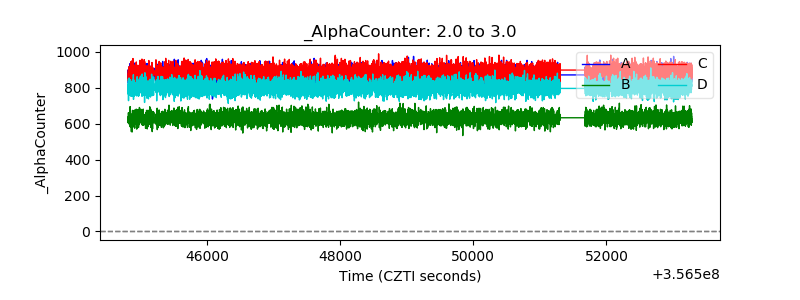 |
| _CPM_Rate | 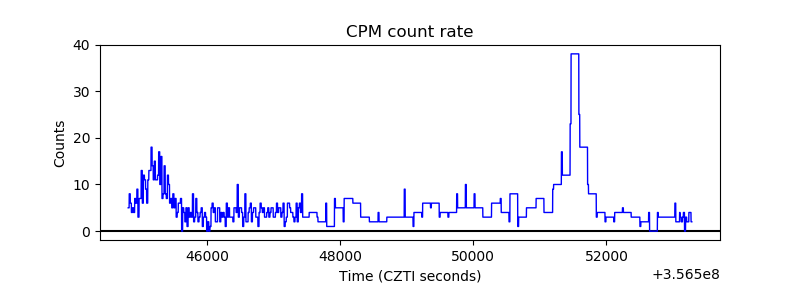 |
| CZT Counter | 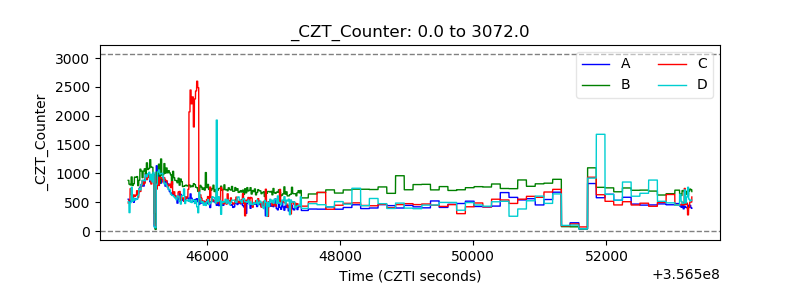 |
| +2.5 Volts monitor | 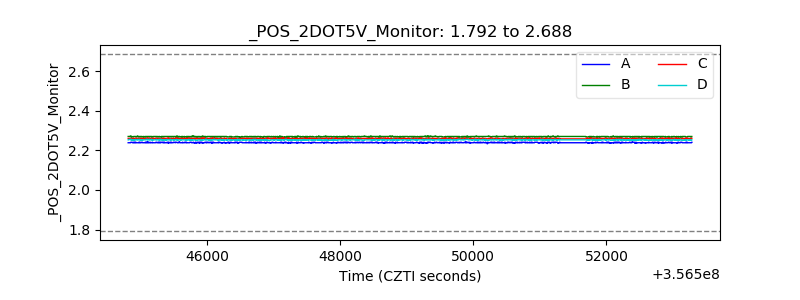 |
| +5 Volts monitor |  |
| _ROLL_ROT |  |
| _Roll_DEC | 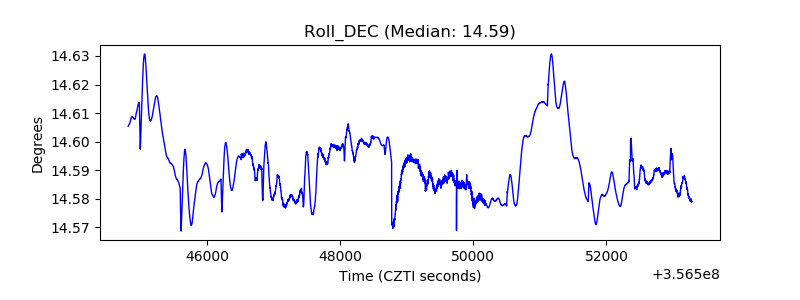 |
| _Roll_RA | 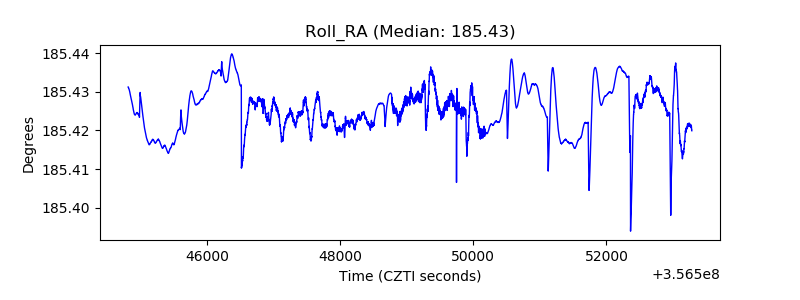 |
| Veto Counter |  |