| Param | Original file | Final file |
|---|---|---|
| Filename | modeM0/AS1A10_071T07_9000004322_30058cztM0_level2.evt | modeM0/AS1A10_071T07_9000004322_30058cztM0_level2_quad_clean.evt |
| Size (bytes) | 1,009,252,800 | 167,863,680 |
| Size | 962.5 MB | 160.1 MB |
| Events in quadrant A | 6,071,467 | 1,079,175 |
| Events in quadrant B | 9,636,207 | 1,066,495 |
| Events in quadrant C | 7,015,428 | 1,027,435 |
| Events in quadrant D | 6,972,594 | 1,021,009 |
| Mode M0 | |||
|---|---|---|---|
| Quadrant | BADHDUFLAG | Total packets | Discarded packets |
| A | 0 | 26656 | 3 |
| B | 0 | 38841 | 3 |
| C | 0 | 29139 | 3 |
| D | 0 | 29286 | 3 |
| Mode SS | |||
|---|---|---|---|
| Quadrant | BADHDUFLAG | Total packets | Discarded packets |
| A | 0 | 262 | 0 |
| B | 0 | 262 | 0 |
| C | 0 | 262 | 0 |
| D | 0 | 262 | 0 |
| Mode M9 | |||
|---|---|---|---|
| Quadrant | BADHDUFLAG | Total packets | Discarded packets |
| A | 0 | 14 | 0 |
| B | 0 | 15 | 0 |
| C | 0 | 15 | 0 |
| D | 0 | 15 | 0 |
| Quadrant | Total seconds | Saturated seconds | Saturation percentage |
|---|---|---|---|
| A | 12872 | 124 | 0.963331% |
| B | 12872 | 239 | 1.856743% |
| C | 12872 | 415 | 3.224052% |
| D | 12872 | 230 | 1.786824% |
Noise dominated data is calculated using 1-second bins in cleaned event files. If a bin has >2000 counts, and if more than 50% of those come from <1% of pixels, then it is considered to be noise-dominated and hence unusable.
| Quadrant | # 1 sec bins | Bins with >0 counts | Bins with >2000 counts | High rate bins dominated by noise | Noise dominated (total time) | Noise dominated (detector-on time) | Marked lightcurve |
|---|---|---|---|---|---|---|---|
| A | 14157 | 12874 | 1 | 1 | 0.01% | 0.01% | 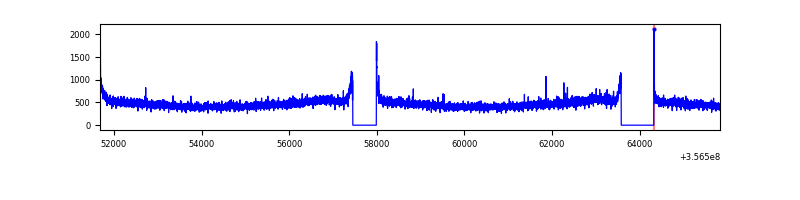 |
| B | 14157 | 12874 | 7 | 7 | 0.05% | 0.05% | 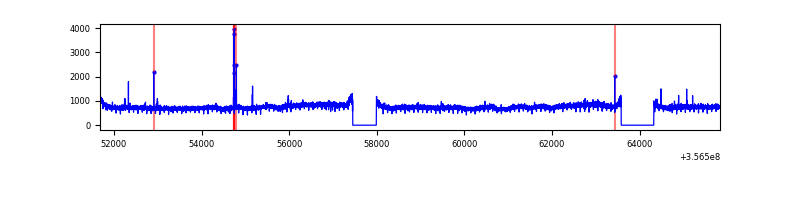 |
| C | 14157 | 12874 | 20 | 20 | 0.14% | 0.16% | 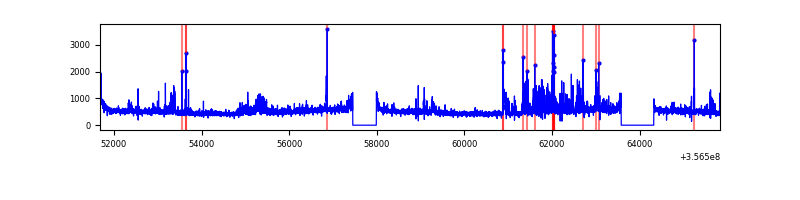 |
| D | 14157 | 12874 | 103 | 103 | 0.73% | 0.80% | 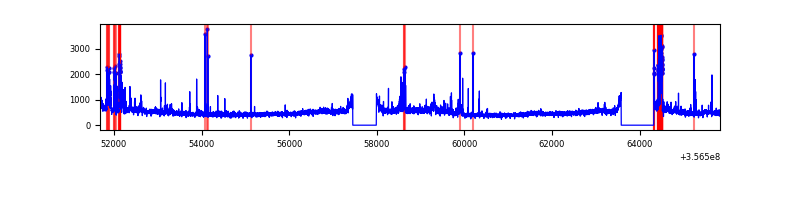 |
Top three noisy pixels from each quadrant. If the there are fewer than three noisy pixels in the level2.evt file, extra rows are filled as -1
| Pixel properties | Quadrant properties | ||||||
|---|---|---|---|---|---|---|---|
| Quadrant | DetID | PixID | Counts | Sigma | Mean | Median | Sigma |
| A | 8 | 192 | 37683 | 115.38 | 1564 | 1531 | 313.3 |
| A | 13 | 254 | 22600 | 67.24 | 1564 | 1531 | 313.3 |
| A | 3 | 137 | 16568 | 47.99 | 1564 | 1531 | 313.3 |
| B | 6 | 159 | 3552839 | 11972.34 | 1535 | 1498 | 296.6 |
| B | 12 | 111 | 38041 | 123.19 | 1535 | 1498 | 296.6 |
| B | 11 | 111 | 35435 | 114.41 | 1535 | 1498 | 296.6 |
| C | 3 | 233 | 485537 | 1378.35 | 1491 | 1502 | 351.2 |
| C | 14 | 238 | 296668 | 840.52 | 1491 | 1502 | 351.2 |
| C | 2 | 16 | 265833 | 752.72 | 1491 | 1502 | 351.2 |
| D | 13 | 104 | 482432 | 1353.88 | 1504 | 1471 | 355.2 |
| D | 8 | 195 | 428196 | 1201.21 | 1504 | 1471 | 355.2 |
| D | 7 | 223 | 190021 | 530.76 | 1504 | 1471 | 355.2 |
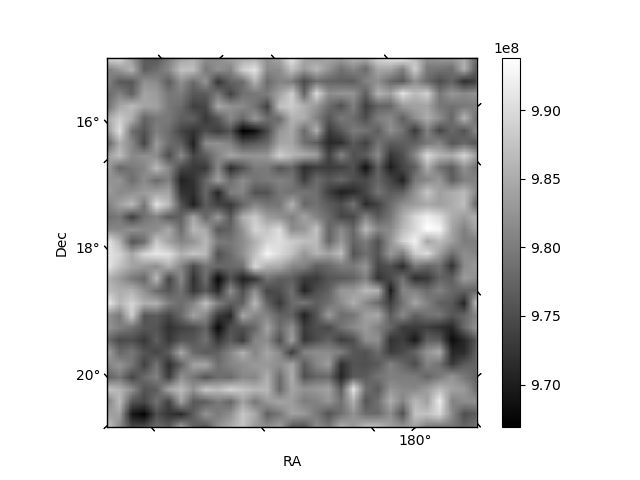
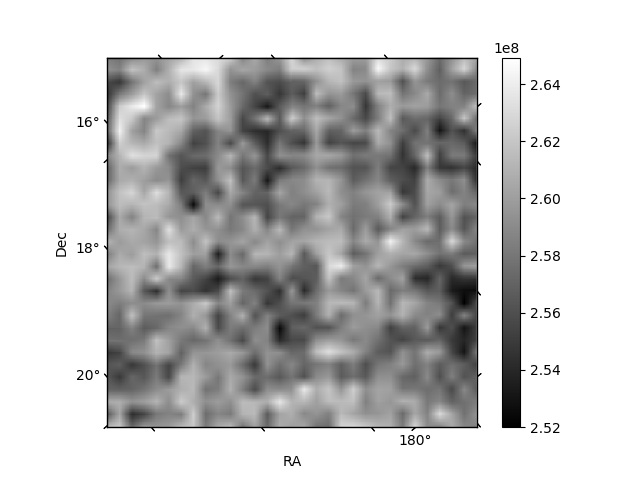
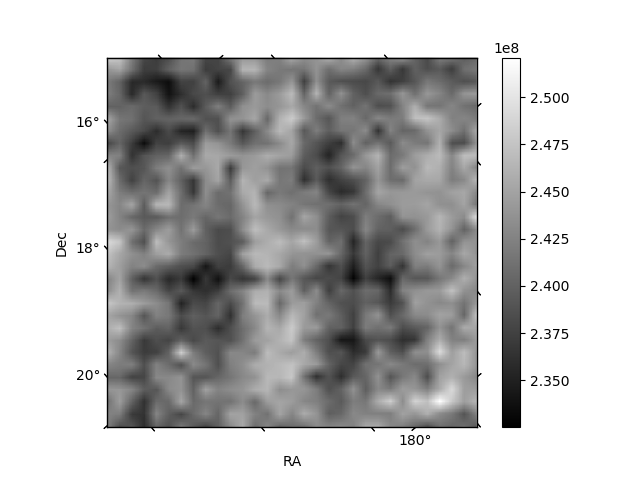
Histogram calculated using DETX and DETY for each event in the final _common_clean file
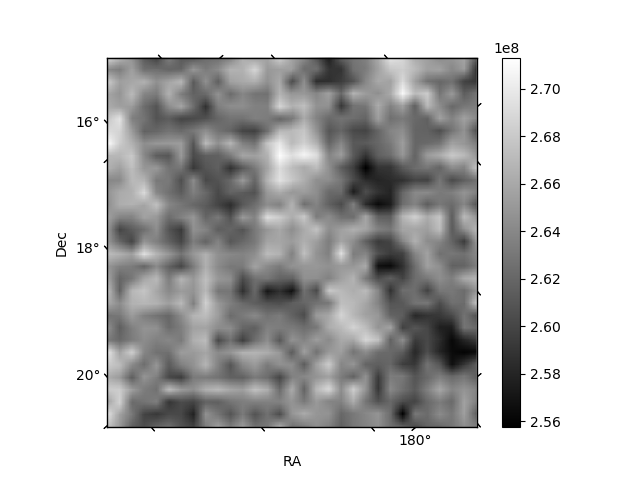
| Quadrant A | 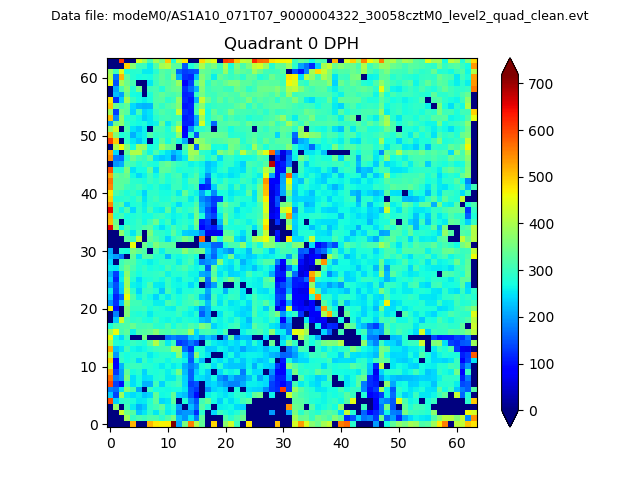 |
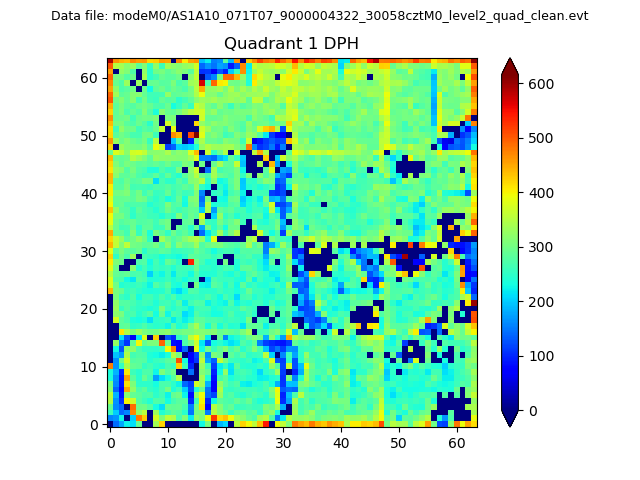 |
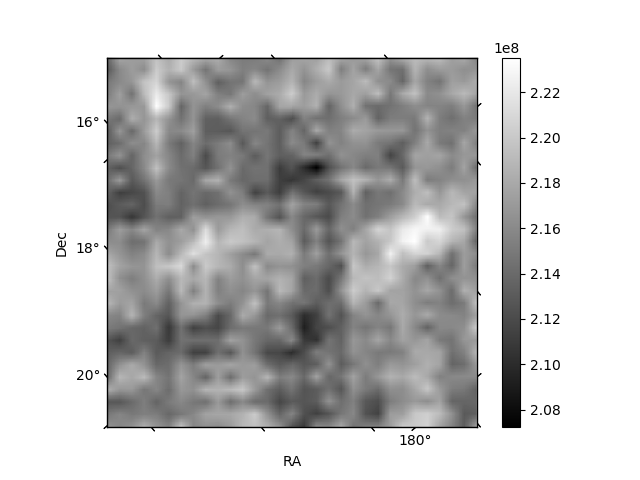
Quadrant B |
|---|---|---|---|
| Quadrant D | 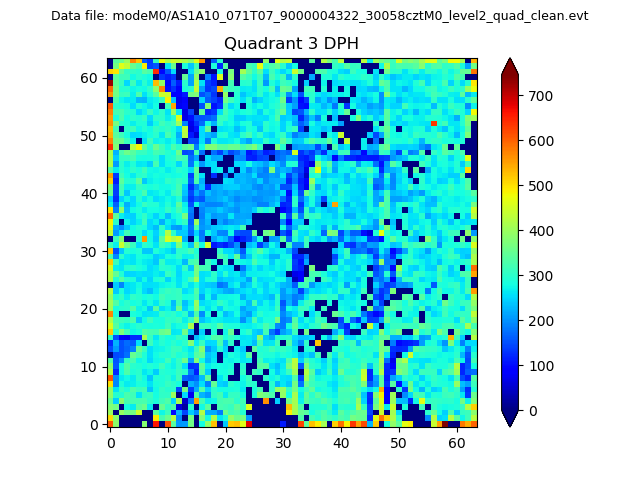 |
 |
Quadrant C |
| Plot type | Count rate plots | Images |
|---|---|---|
| Comparison with Poisson distribution Blue bars denote a histogram of data divided into 1 sec bins. Red curve is a Poisson curve with rate = median count rate of data. |
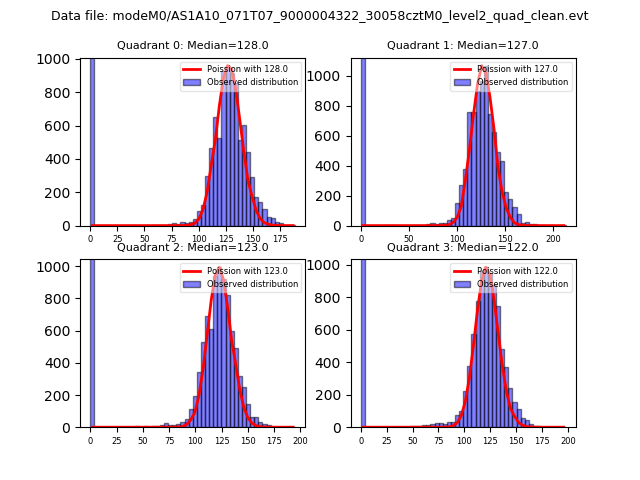 |
 |
| Quadrant-wise count rates Data is divided into 100 sec bins |
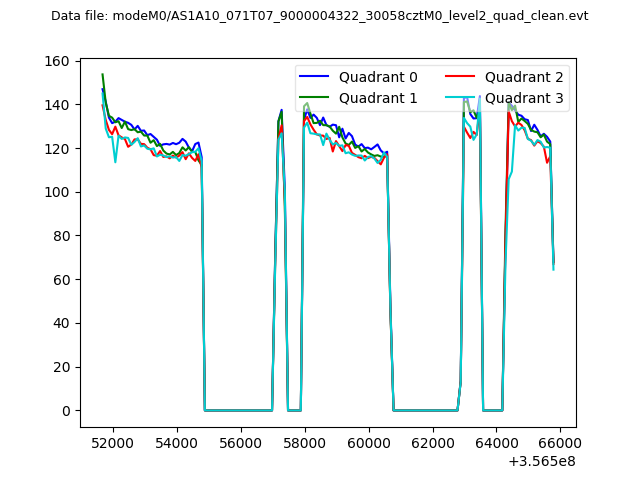 |
|
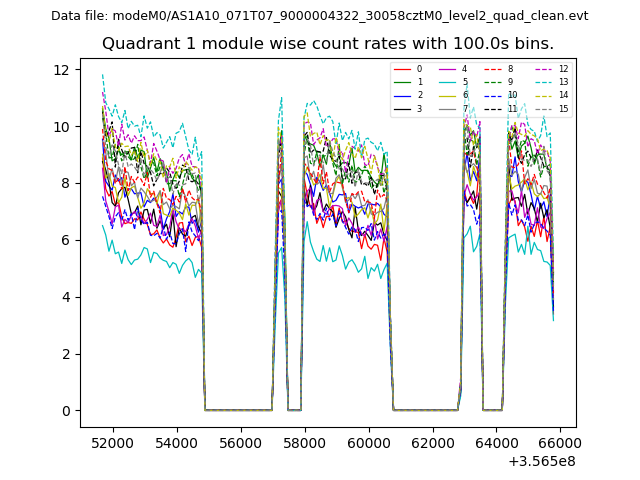
| Module-wise count rates for Quadrant A Data is divided into 100 sec bins |
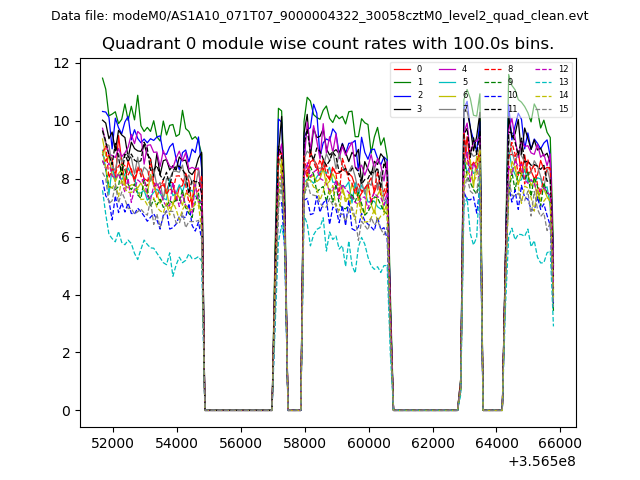 |
 |
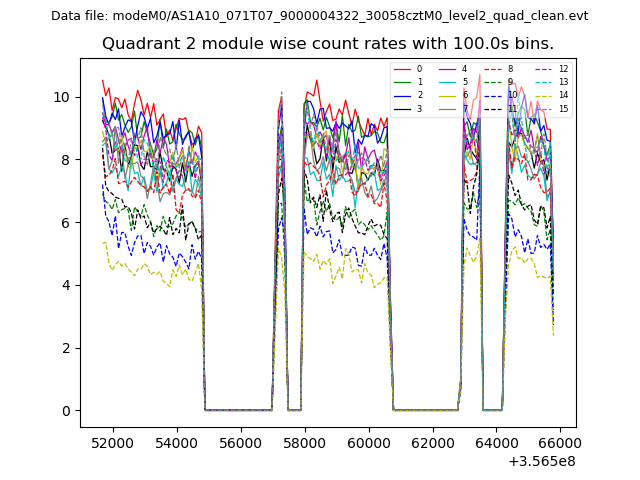
| Module-wise count rates for Quadrant B Data is divided into 100 sec bins |
 |
 |
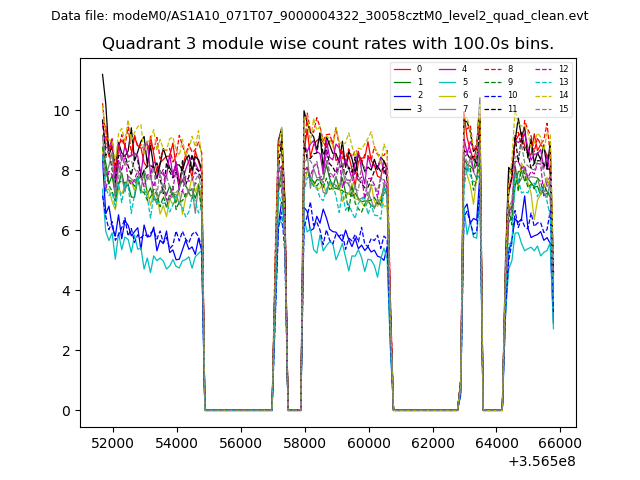
| Module-wise count rates for Quadrant C Data is divided into 100 sec bins |
 |
 |
| Module-wise count rates for Quadrant D Data is divided into 100 sec bins |
 |
 |
| Parameter | Plot |
|---|---|
| CZT HV Monitor | 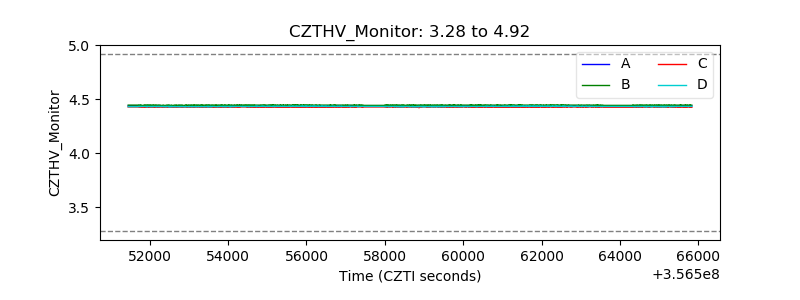 |
| D_VDD | 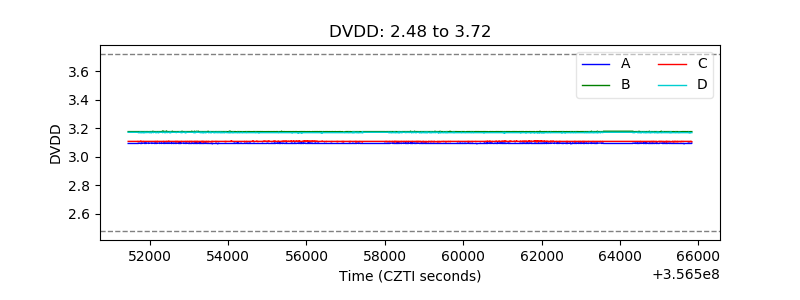 |
| Temperature 1 | 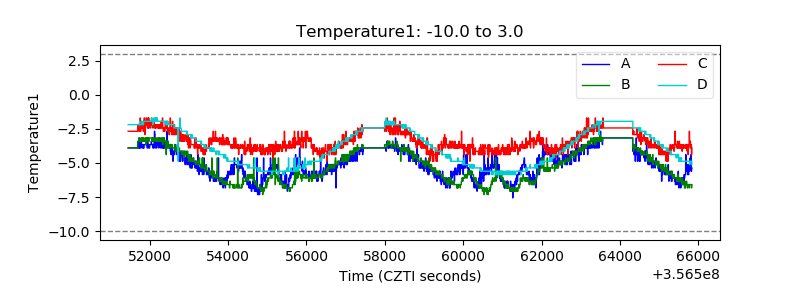 |
| Veto HV Monitor | 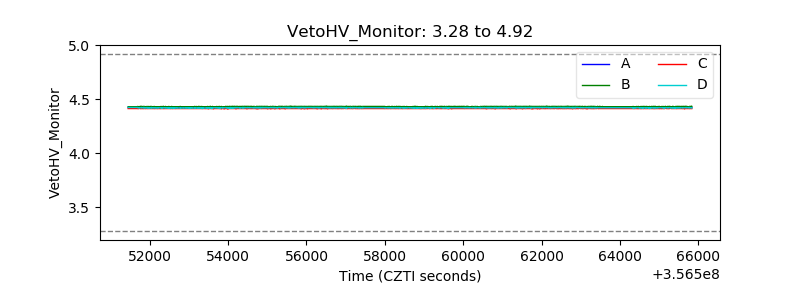 |
| Veto LLD | 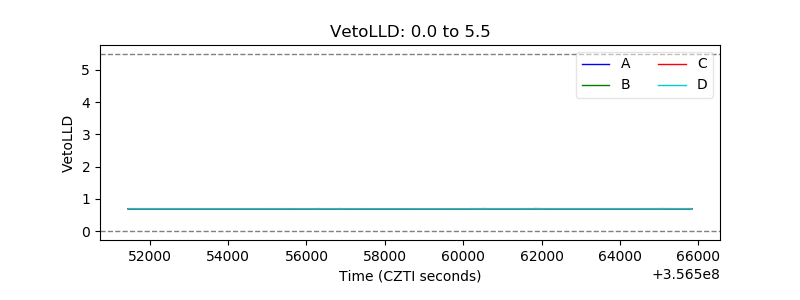 |
| Alpha Counter | 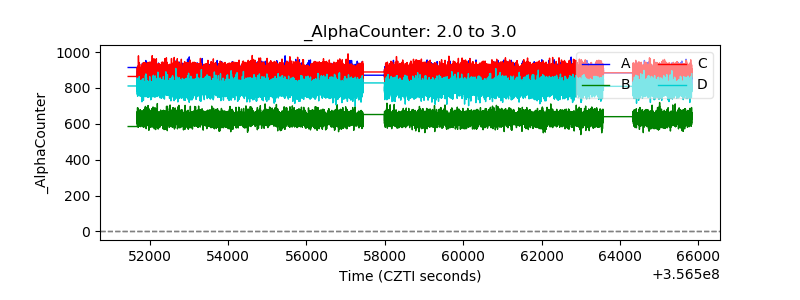 |
| _CPM_Rate | 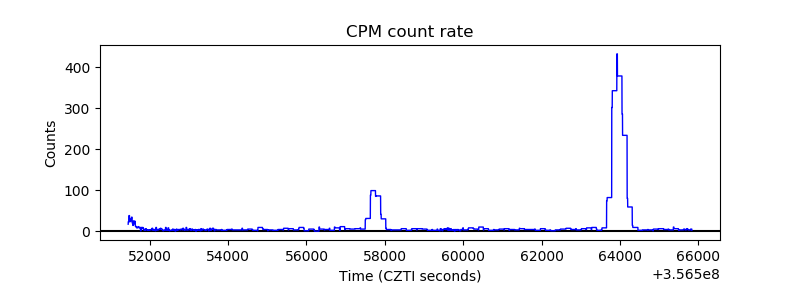 |
| CZT Counter | 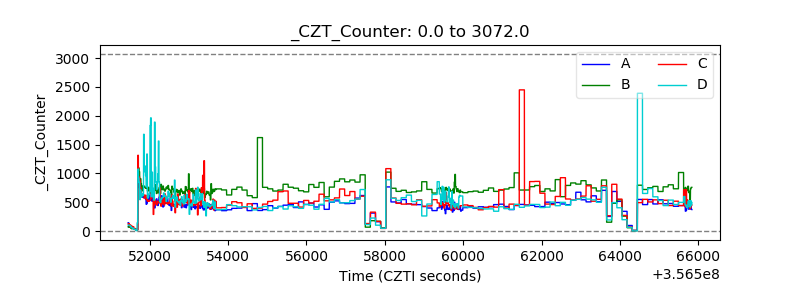 |
| +2.5 Volts monitor |  |
| +5 Volts monitor |  |
| _ROLL_ROT | 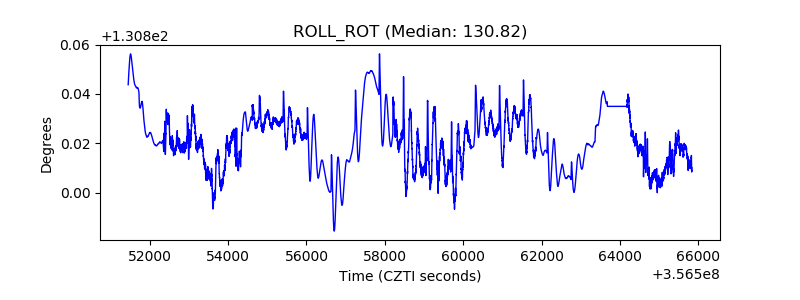 |
| _Roll_DEC | 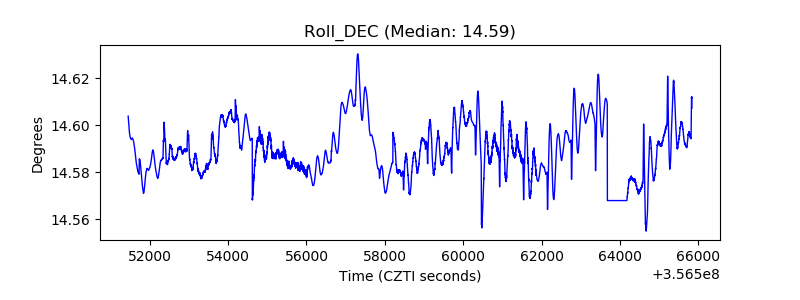 |
| _Roll_RA | 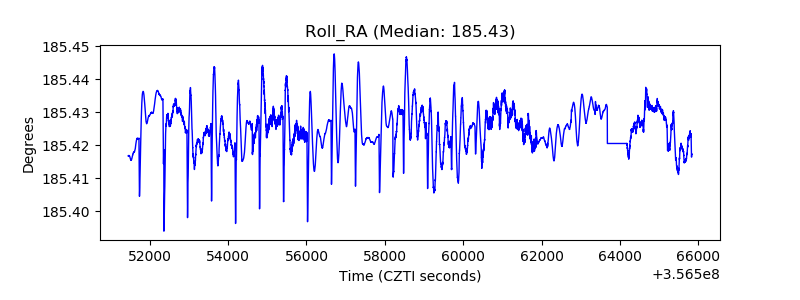 |
| Veto Counter | 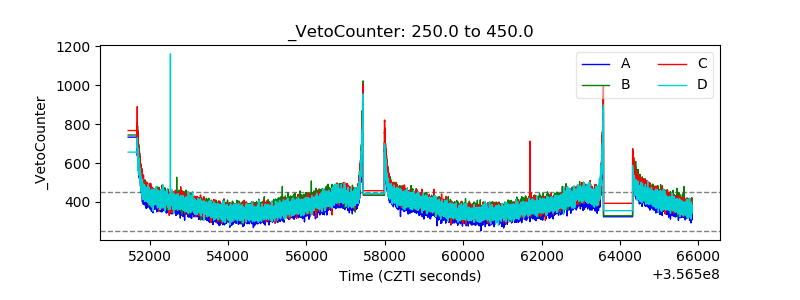 |