| Param | Original file | Final file |
|---|---|---|
| Filename | modeM0/AS1A10_071T07_9000004322_30059cztM0_level2.evt | modeM0/AS1A10_071T07_9000004322_30059cztM0_level2_quad_clean.evt |
| Size (bytes) | 556,516,800 | 98,821,440 |
| Size | 530.7 MB | 94.2 MB |
| Events in quadrant A | 3,367,164 | 641,655 |
| Events in quadrant B | 5,405,543 | 640,339 |
| Events in quadrant C | 3,874,607 | 608,332 |
| Events in quadrant D | 3,727,283 | 609,600 |
| Mode M0 | |||
|---|---|---|---|
| Quadrant | BADHDUFLAG | Total packets | Discarded packets |
| A | 0 | 14653 | 2 |
| B | 0 | 21369 | 2 |
| C | 0 | 16153 | 2 |
| D | 0 | 15861 | 2 |
| Mode SS | |||
|---|---|---|---|
| Quadrant | BADHDUFLAG | Total packets | Discarded packets |
| A | 0 | 146 | 0 |
| B | 0 | 146 | 0 |
| C | 0 | 146 | 0 |
| D | 0 | 146 | 0 |
| Mode M9 | |||
|---|---|---|---|
| Quadrant | BADHDUFLAG | Total packets | Discarded packets |
| A | 0 | 16 | 0 |
| B | 0 | 16 | 0 |
| C | 0 | 16 | 0 |
| D | 0 | 16 | 0 |
| Quadrant | Total seconds | Saturated seconds | Saturation percentage |
|---|---|---|---|
| A | 7072 | 76 | 1.074661% |
| B | 7073 | 120 | 1.696593% |
| C | 7073 | 253 | 3.576983% |
| D | 7073 | 147 | 2.078326% |
Noise dominated data is calculated using 1-second bins in cleaned event files. If a bin has >2000 counts, and if more than 50% of those come from <1% of pixels, then it is considered to be noise-dominated and hence unusable.
| Quadrant | # 1 sec bins | Bins with >0 counts | Bins with >2000 counts | High rate bins dominated by noise | Noise dominated (total time) | Noise dominated (detector-on time) | Marked lightcurve |
|---|---|---|---|---|---|---|---|
| A | 8692 | 7074 | 1 | 1 | 0.01% | 0.01% | 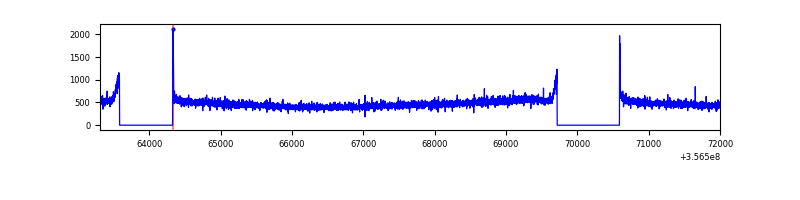 |
| B | 8693 | 7075 | 3 | 3 | 0.03% | 0.04% | 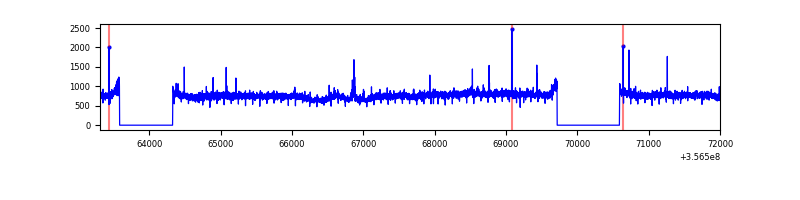 |
| C | 8693 | 7075 | 48 | 48 | 0.55% | 0.68% | 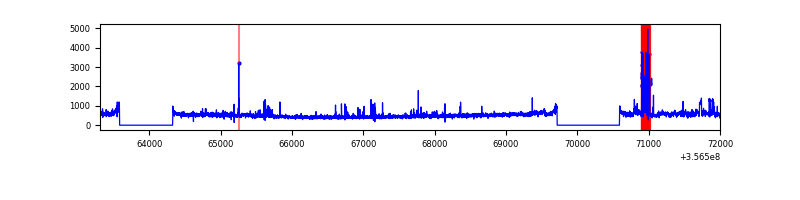 |
| D | 8693 | 7075 | 75 | 75 | 0.86% | 1.06% | 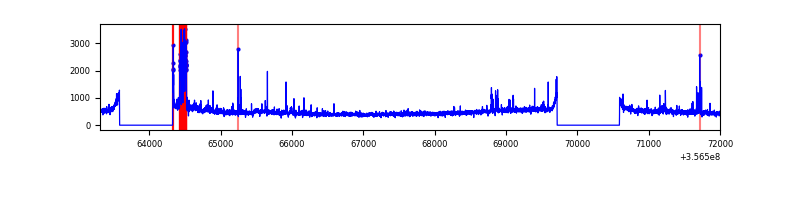 |
Top three noisy pixels from each quadrant. If the there are fewer than three noisy pixels in the level2.evt file, extra rows are filled as -1
| Pixel properties | Quadrant properties | ||||||
|---|---|---|---|---|---|---|---|
| Quadrant | DetID | PixID | Counts | Sigma | Mean | Median | Sigma |
| A | 8 | 192 | 26476 | 146.49 | 865 | 845 | 175.0 |
| A | 13 | 254 | 13118 | 70.15 | 865 | 845 | 175.0 |
| A | 3 | 137 | 9071 | 47.02 | 865 | 845 | 175.0 |
| B | 6 | 159 | 1976269 | 11925.89 | 852 | 829 | 165.6 |
| B | 0 | 229 | 35207 | 207.54 | 852 | 829 | 165.6 |
| B | 5 | 255 | 31737 | 186.59 | 852 | 829 | 165.6 |
| C | 15 | 208 | 181203 | 922.27 | 825 | 834 | 195.6 |
| C | 14 | 238 | 164028 | 834.45 | 825 | 834 | 195.6 |
| C | 1 | 90 | 159280 | 810.17 | 825 | 834 | 195.6 |
| D | 13 | 104 | 191338 | 972.59 | 830 | 812 | 195.9 |
| D | 8 | 195 | 122495 | 621.17 | 830 | 812 | 195.9 |
| D | 7 | 223 | 106798 | 541.04 | 830 | 812 | 195.9 |
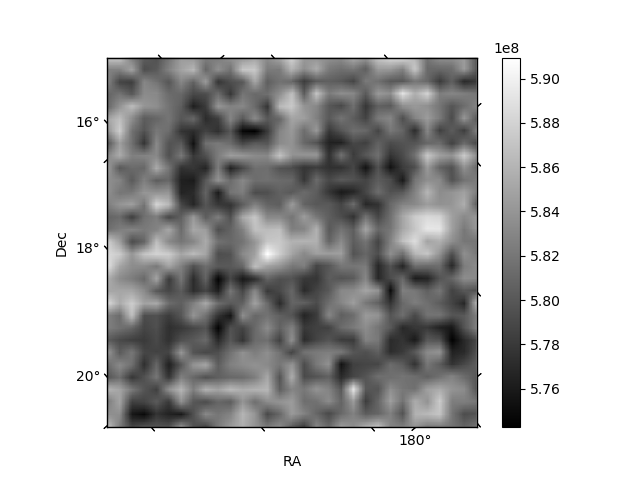
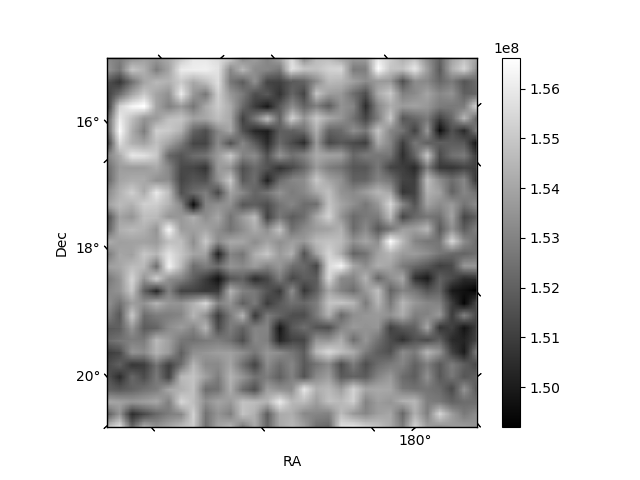
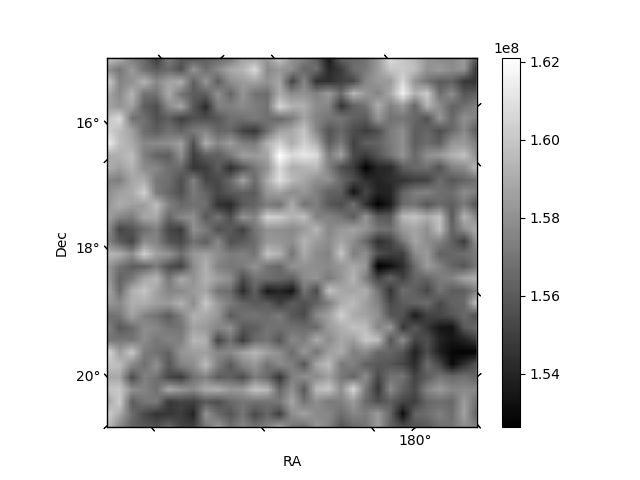
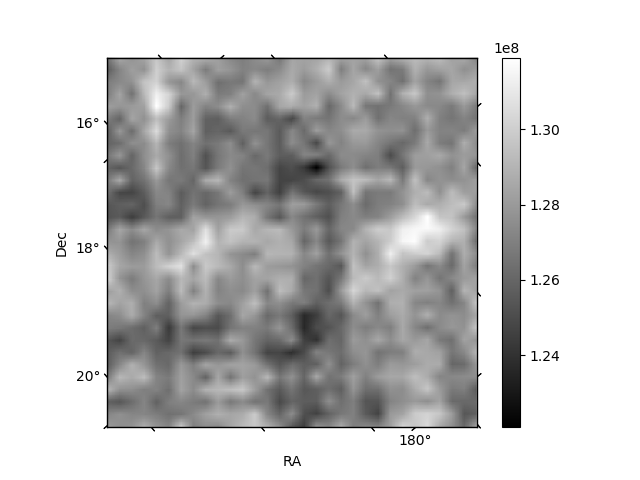
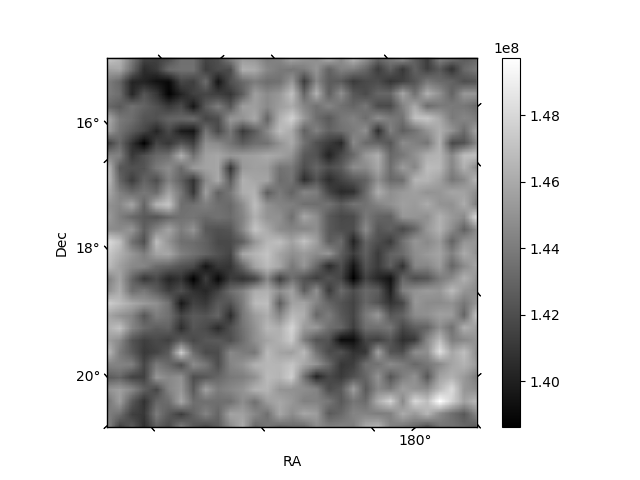
Histogram calculated using DETX and DETY for each event in the final _common_clean file
| Quadrant A | 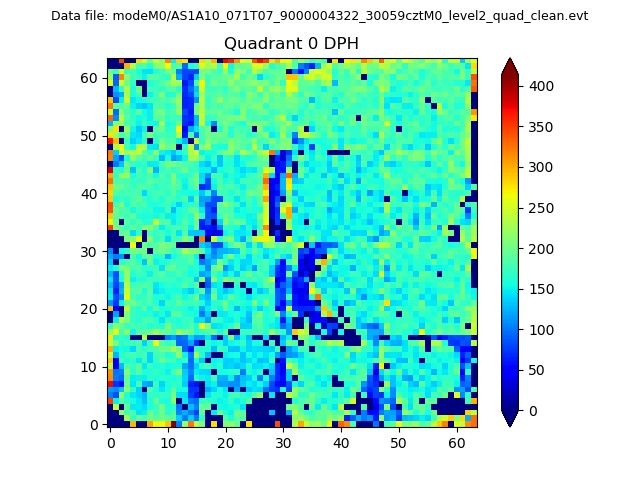 |
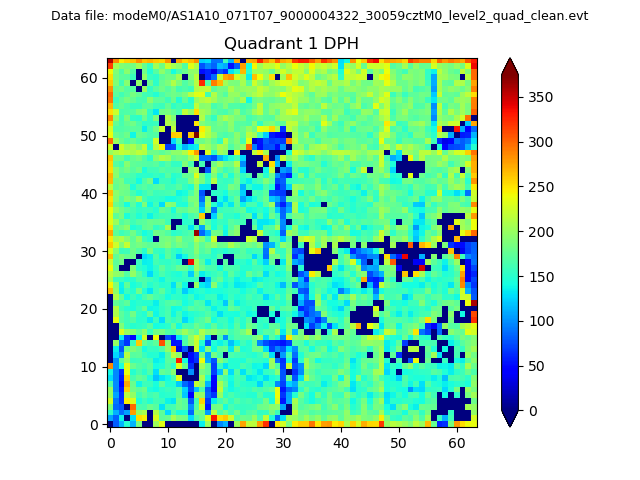 |
Quadrant B |
|---|---|---|---|
| Quadrant D |  |
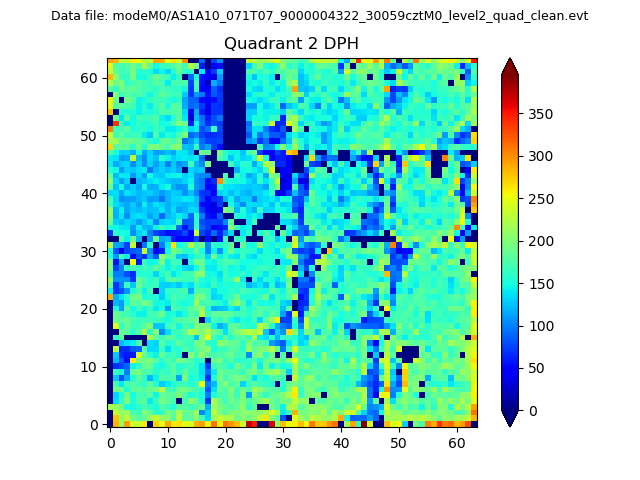 |
Quadrant C |
| Plot type | Count rate plots | Images |
|---|---|---|
| Comparison with Poisson distribution Blue bars denote a histogram of data divided into 1 sec bins. Red curve is a Poisson curve with rate = median count rate of data. |
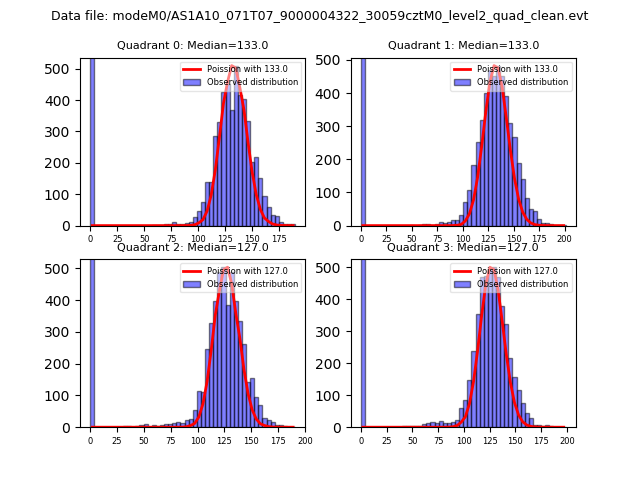 |
 |
| Quadrant-wise count rates Data is divided into 100 sec bins |
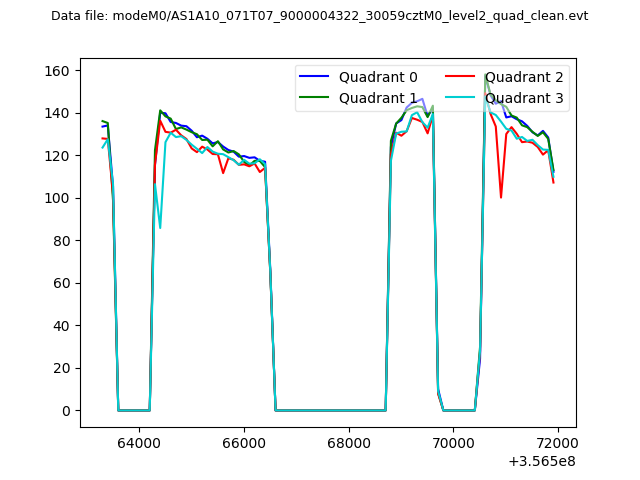 |
|
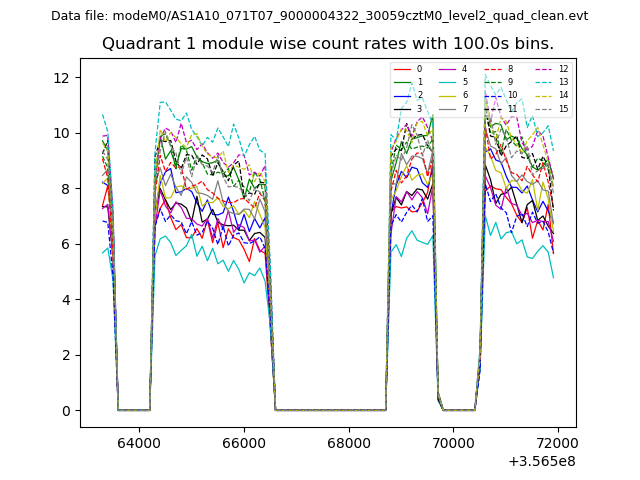
| Module-wise count rates for Quadrant A Data is divided into 100 sec bins |
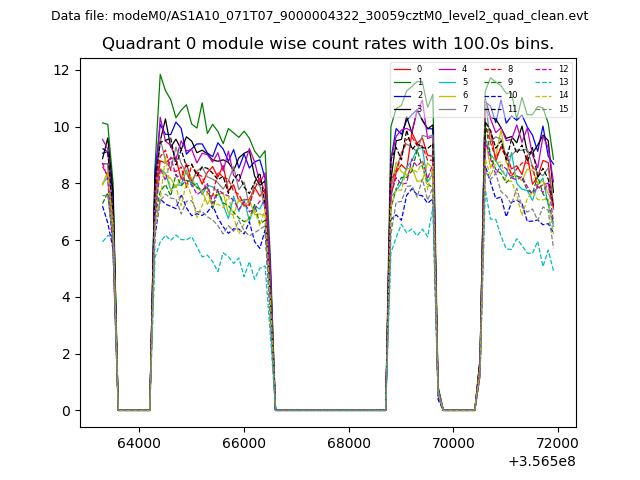 |
 |
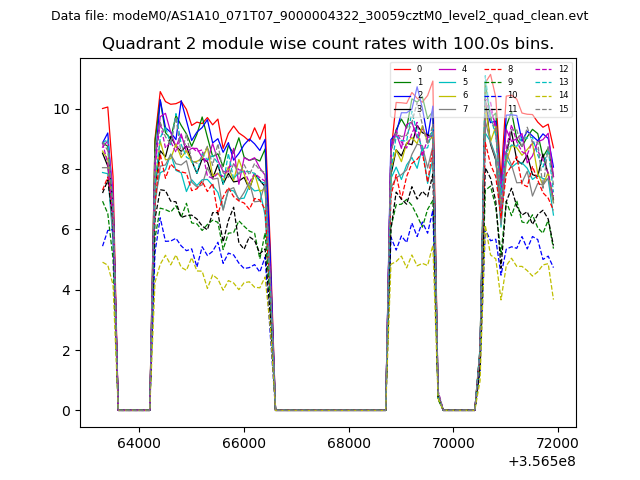
| Module-wise count rates for Quadrant B Data is divided into 100 sec bins |
 |
 |
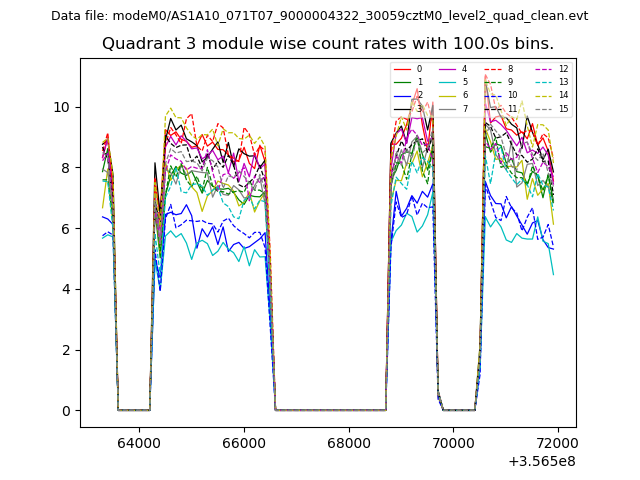
| Module-wise count rates for Quadrant C Data is divided into 100 sec bins |
 |
 |
| Module-wise count rates for Quadrant D Data is divided into 100 sec bins |
 |
 |
| Parameter | Plot |
|---|---|
| CZT HV Monitor | 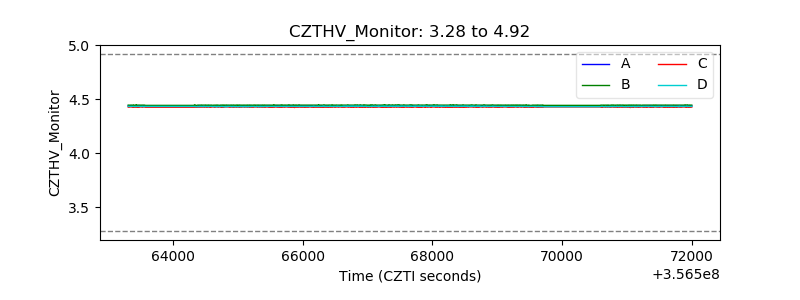 |
| D_VDD | 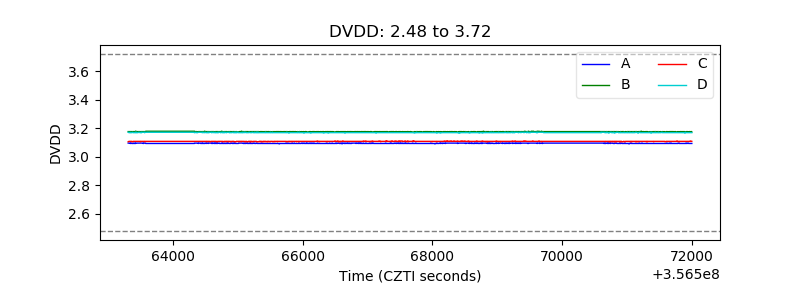 |
| Temperature 1 | 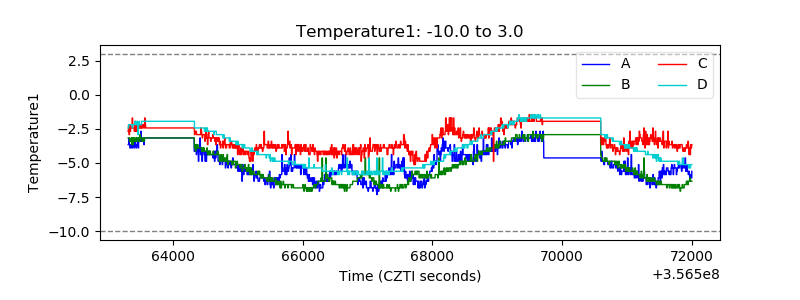 |
| Veto HV Monitor | 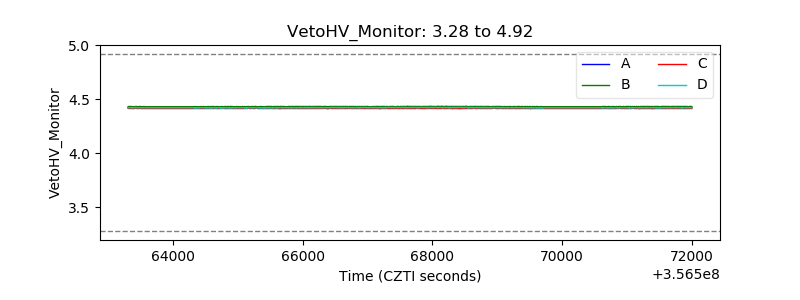 |
| Veto LLD | 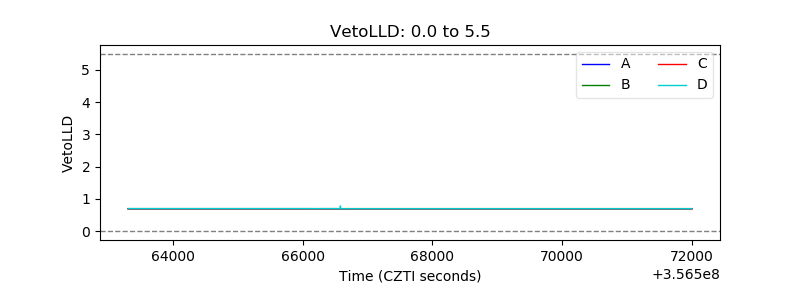 |
| Alpha Counter | 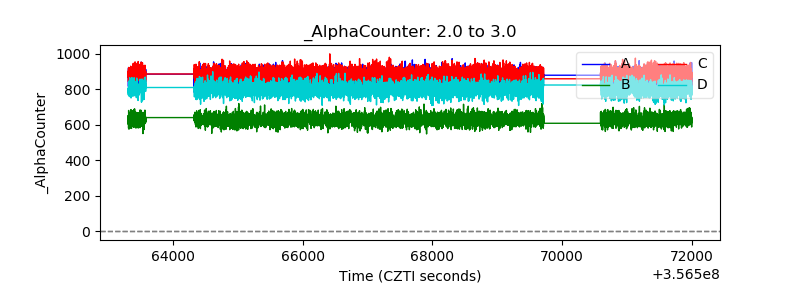 |
| _CPM_Rate | 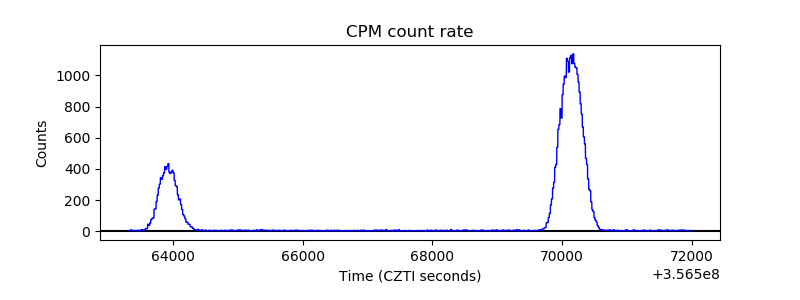 |
| CZT Counter | 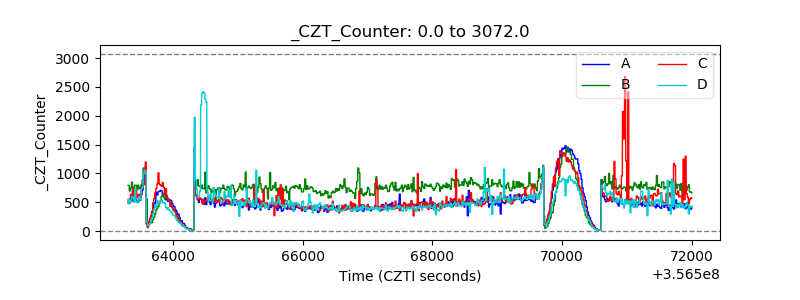 |
| +2.5 Volts monitor |  |
| +5 Volts monitor |  |
| _ROLL_ROT | 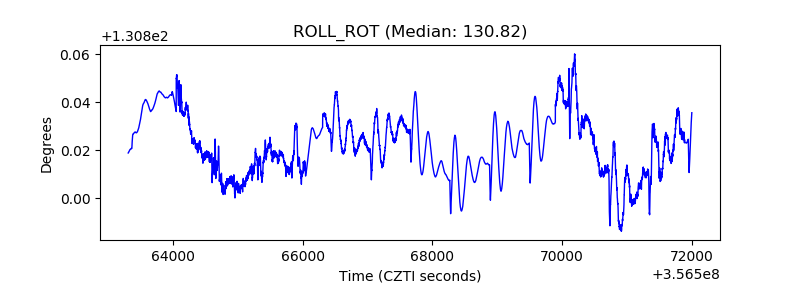 |
| _Roll_DEC | 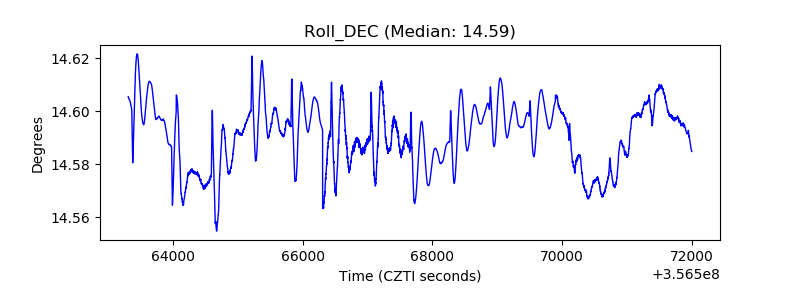 |
| _Roll_RA | 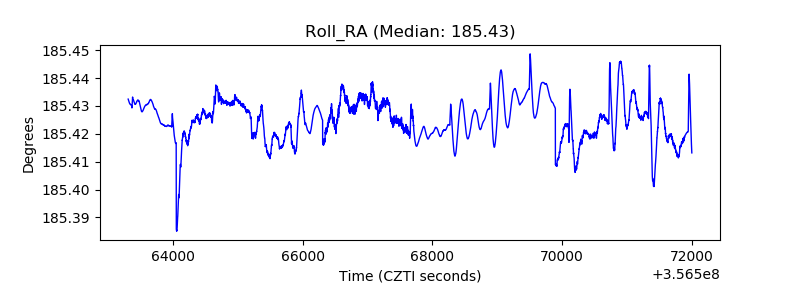 |
| Veto Counter | 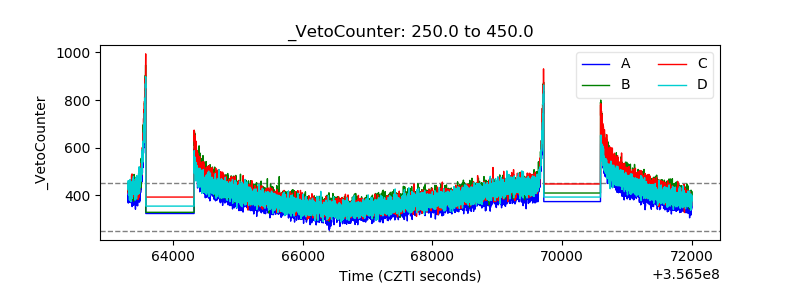 |