| Param | Original file | Final file |
|---|---|---|
| Filename | modeM0/AS1A10_071T07_9000004322_30060cztM0_level2.evt | modeM0/AS1A10_071T07_9000004322_30060cztM0_level2_quad_clean.evt |
| Size (bytes) | 542,468,160 | 93,922,560 |
| Size | 517.3 MB | 89.6 MB |
| Events in quadrant A | 3,184,776 | 612,462 |
| Events in quadrant B | 5,124,201 | 614,447 |
| Events in quadrant C | 3,725,365 | 579,940 |
| Events in quadrant D | 3,943,543 | 573,474 |
| Mode M0 | |||
|---|---|---|---|
| Quadrant | BADHDUFLAG | Total packets | Discarded packets |
| A | 0 | 13684 | 2 |
| B | 0 | 20116 | 2 |
| C | 0 | 15293 | 2 |
| D | 0 | 16239 | 2 |
| Mode SS | |||
|---|---|---|---|
| Quadrant | BADHDUFLAG | Total packets | Discarded packets |
| A | 0 | 138 | 0 |
| B | 0 | 138 | 0 |
| C | 0 | 138 | 0 |
| D | 0 | 138 | 0 |
| Mode M9 | |||
|---|---|---|---|
| Quadrant | BADHDUFLAG | Total packets | Discarded packets |
| A | 0 | 19 | 0 |
| B | 0 | 19 | 0 |
| C | 0 | 19 | 0 |
| D | 0 | 19 | 0 |
| Quadrant | Total seconds | Saturated seconds | Saturation percentage |
|---|---|---|---|
| A | 6649 | 52 | 0.782072% |
| B | 6650 | 81 | 1.218045% |
| C | 6650 | 163 | 2.451128% |
| D | 6650 | 140 | 2.105263% |
Noise dominated data is calculated using 1-second bins in cleaned event files. If a bin has >2000 counts, and if more than 50% of those come from <1% of pixels, then it is considered to be noise-dominated and hence unusable.
| Quadrant | # 1 sec bins | Bins with >0 counts | Bins with >2000 counts | High rate bins dominated by noise | Noise dominated (total time) | Noise dominated (detector-on time) | Marked lightcurve |
|---|---|---|---|---|---|---|---|
| A | 8559 | 6651 | 1 | 1 | 0.01% | 0.02% | 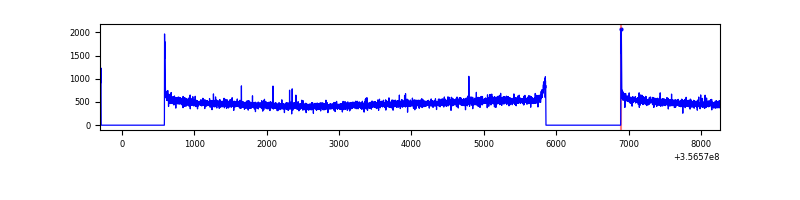 |
| B | 8560 | 6652 | 5 | 5 | 0.06% | 0.08% | 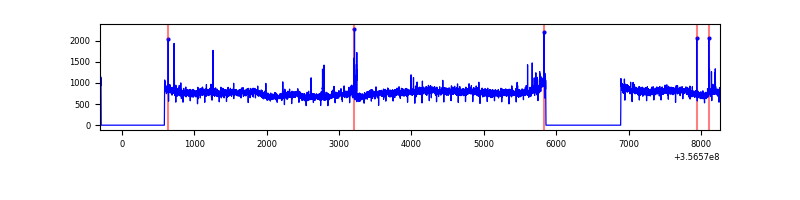 |
| C | 8560 | 6652 | 47 | 47 | 0.55% | 0.71% | 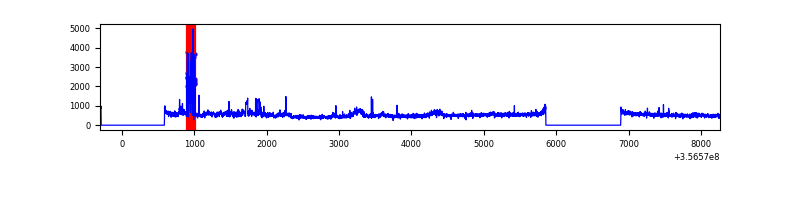 |
| D | 8560 | 6652 | 82 | 82 | 0.96% | 1.23% | 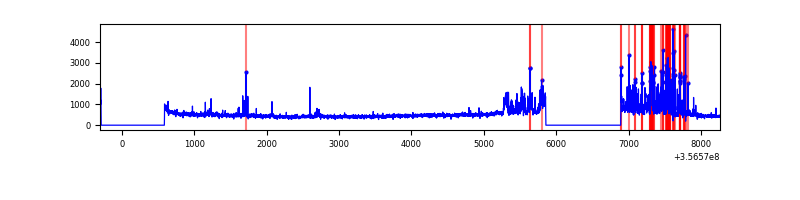 |
Top three noisy pixels from each quadrant. If the there are fewer than three noisy pixels in the level2.evt file, extra rows are filled as -1
| Pixel properties | Quadrant properties | ||||||
|---|---|---|---|---|---|---|---|
| Quadrant | DetID | PixID | Counts | Sigma | Mean | Median | Sigma |
| A | 8 | 192 | 27193 | 160.87 | 818 | 802 | 164.1 |
| A | 13 | 254 | 11349 | 64.29 | 818 | 802 | 164.1 |
| A | 3 | 137 | 8420 | 46.44 | 818 | 802 | 164.1 |
| B | 6 | 159 | 1876703 | 11975.57 | 808 | 787 | 156.6 |
| B | 5 | 255 | 37235 | 232.68 | 808 | 787 | 156.6 |
| B | 12 | 111 | 19373 | 118.65 | 808 | 787 | 156.6 |
| C | 1 | 90 | 216947 | 1183.27 | 779 | 784 | 182.7 |
| C | 15 | 208 | 170887 | 931.14 | 779 | 784 | 182.7 |
| C | 14 | 238 | 128105 | 696.95 | 779 | 784 | 182.7 |
| D | 13 | 104 | 611175 | 3324.57 | 780 | 762 | 183.6 |
| D | 8 | 195 | 127682 | 691.26 | 780 | 762 | 183.6 |
| D | 2 | 250 | 110198 | 596.04 | 780 | 762 | 183.6 |
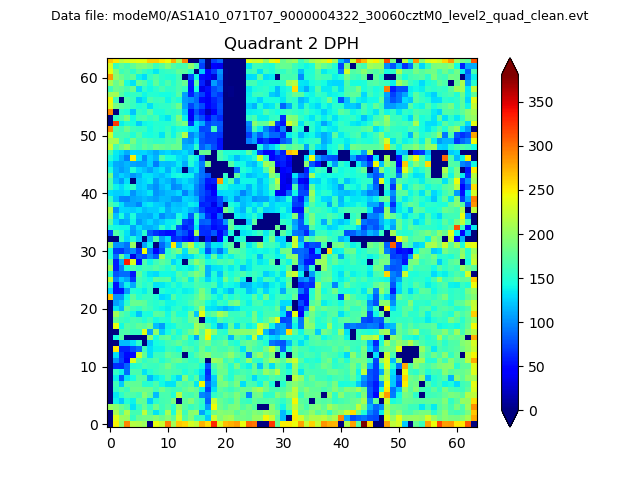
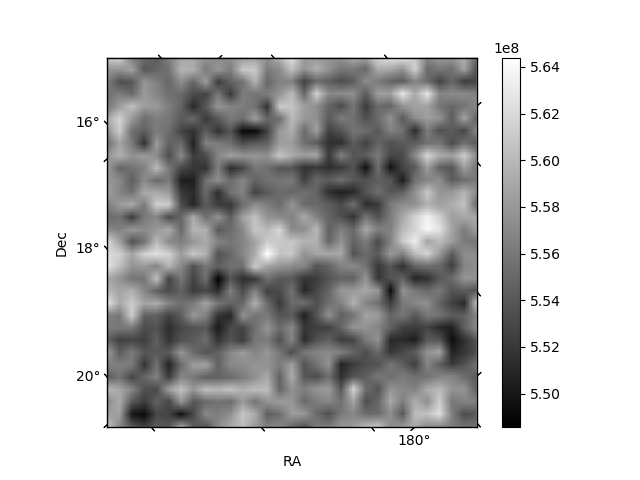
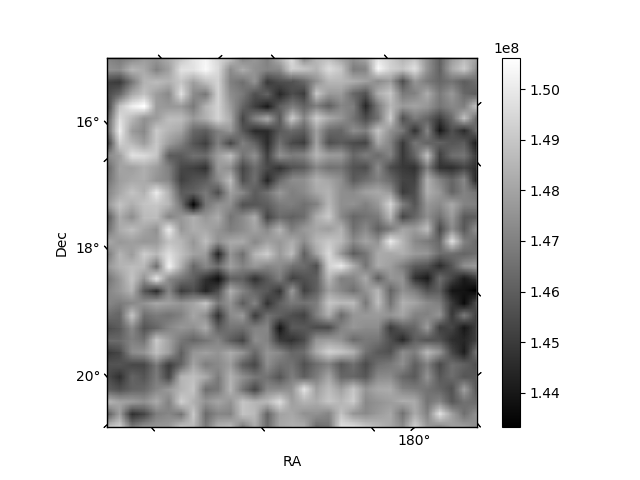
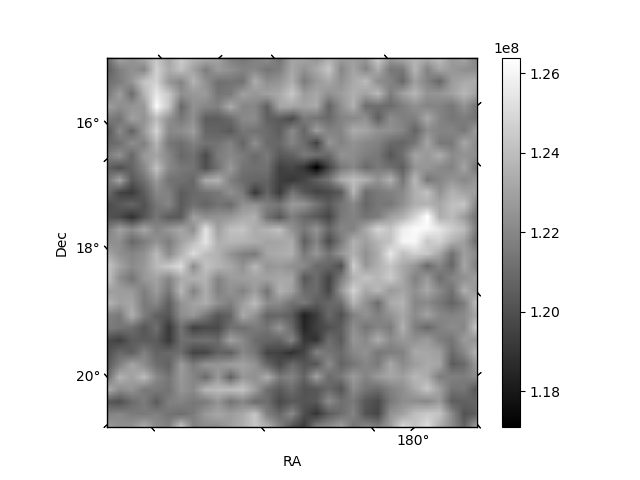
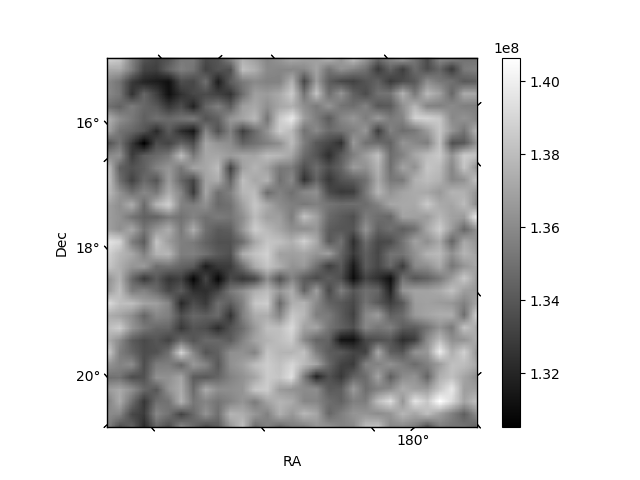
Histogram calculated using DETX and DETY for each event in the final _common_clean file
| Quadrant A | 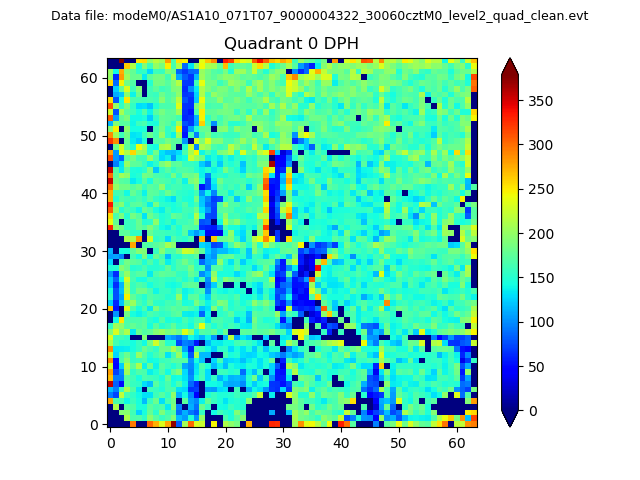 |
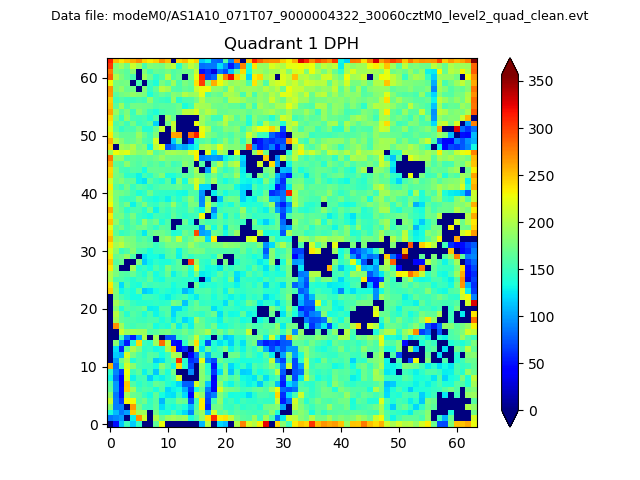 |
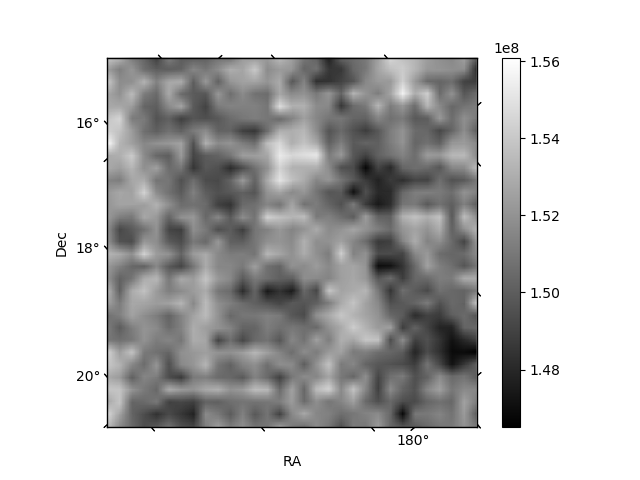
Quadrant B |
|---|---|---|---|
| Quadrant D | 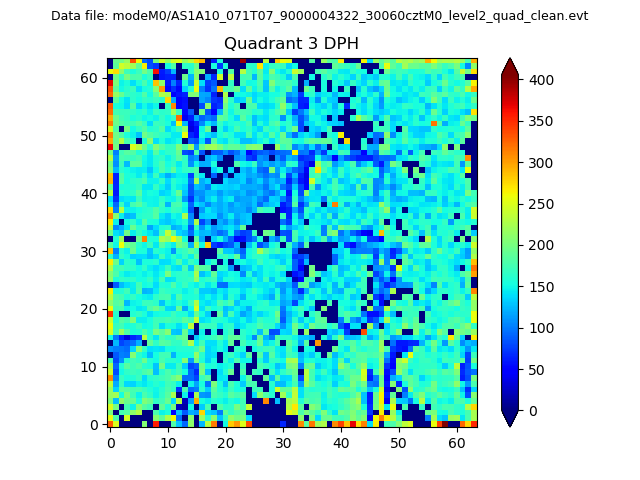 |
 |
Quadrant C |
| Plot type | Count rate plots | Images |
|---|---|---|
| Comparison with Poisson distribution Blue bars denote a histogram of data divided into 1 sec bins. Red curve is a Poisson curve with rate = median count rate of data. |
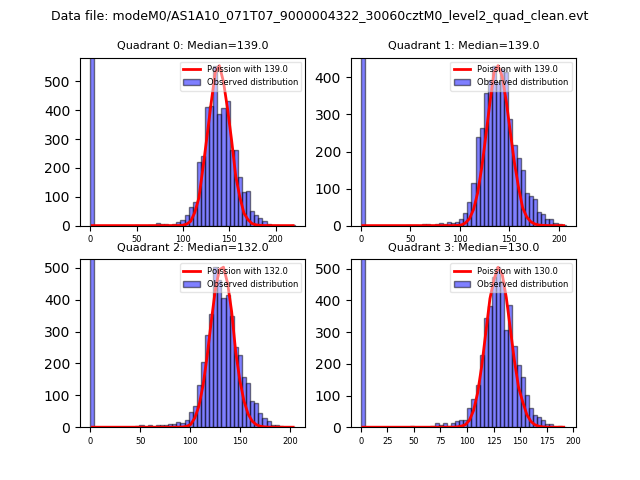 |
 |
| Quadrant-wise count rates Data is divided into 100 sec bins |
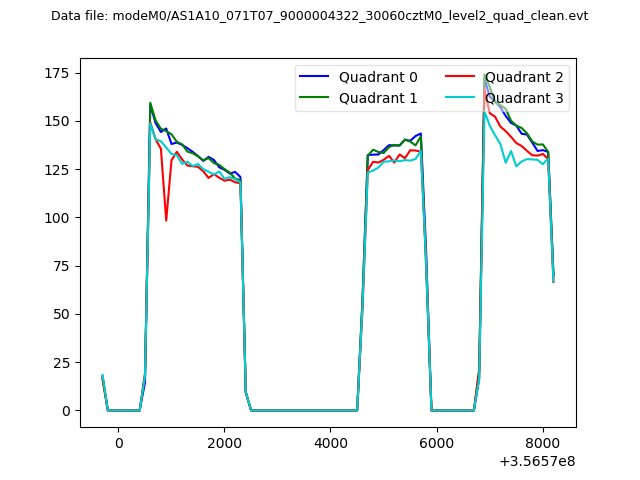 |
|
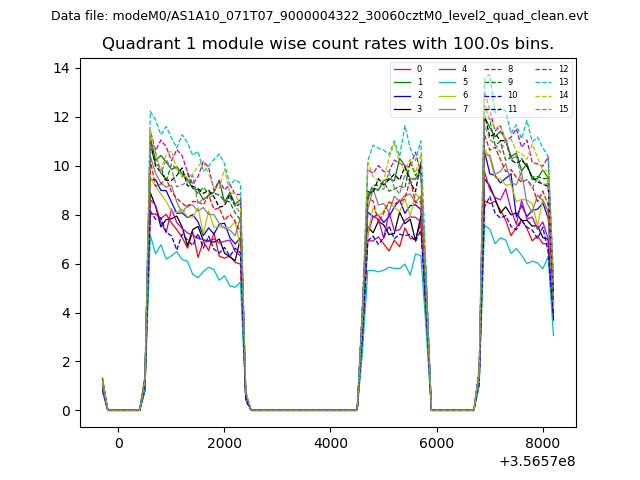
| Module-wise count rates for Quadrant A Data is divided into 100 sec bins |
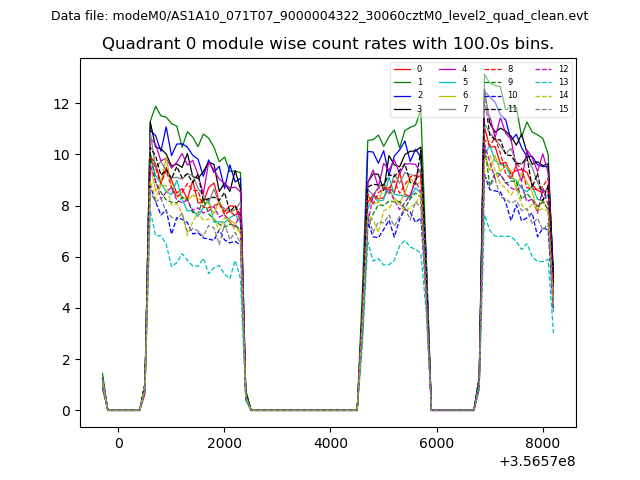 |
 |
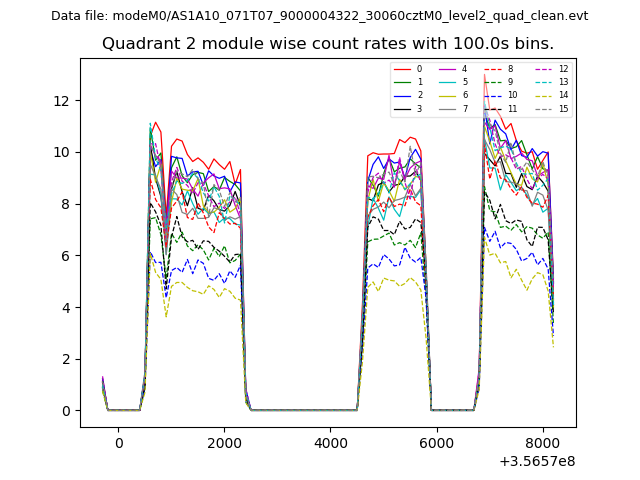
| Module-wise count rates for Quadrant B Data is divided into 100 sec bins |
 |
 |
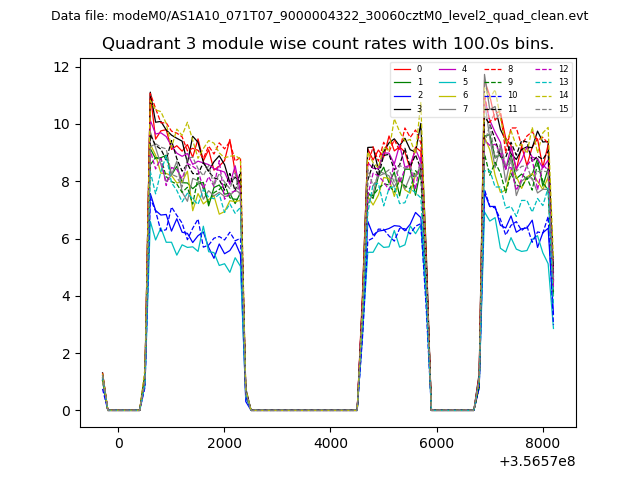
| Module-wise count rates for Quadrant C Data is divided into 100 sec bins |
 |
 |
| Module-wise count rates for Quadrant D Data is divided into 100 sec bins |
 |
 |
| Parameter | Plot |
|---|---|
| CZT HV Monitor | 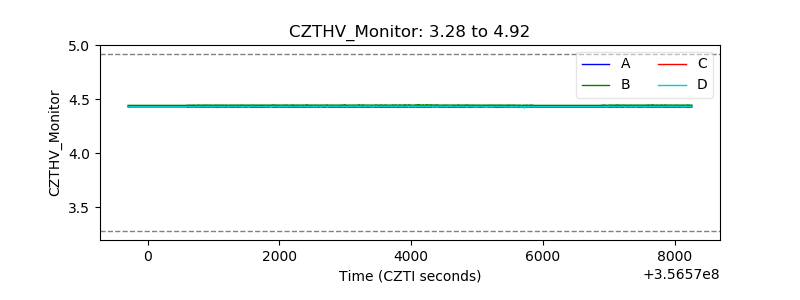 |
| D_VDD | 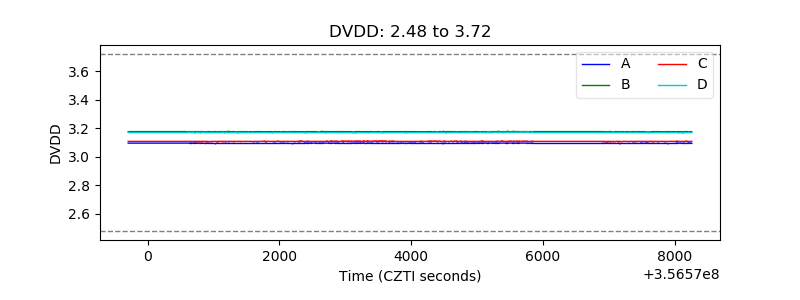 |
| Temperature 1 | 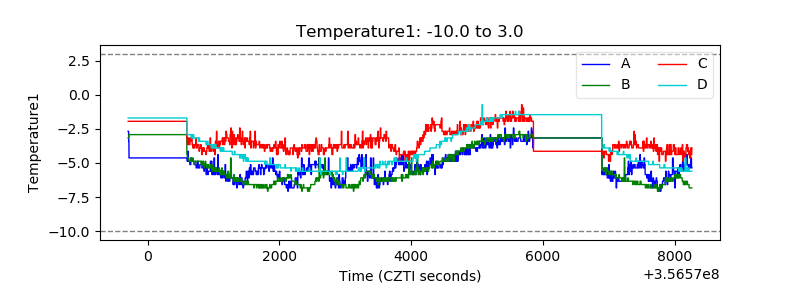 |
| Veto HV Monitor | 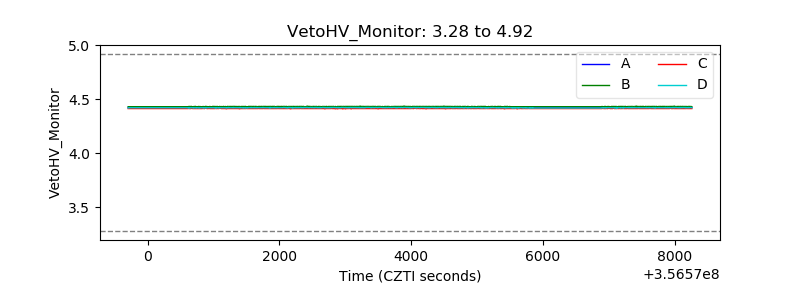 |
| Veto LLD | 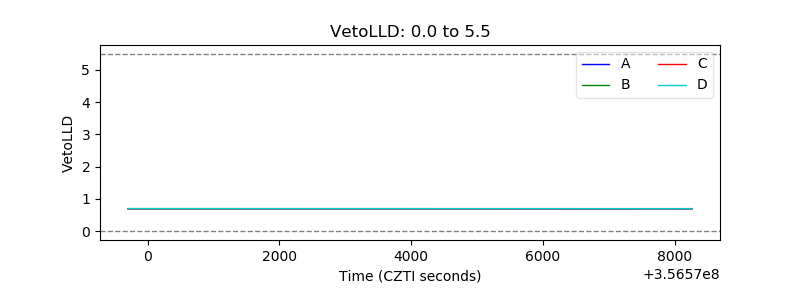 |
| Alpha Counter | 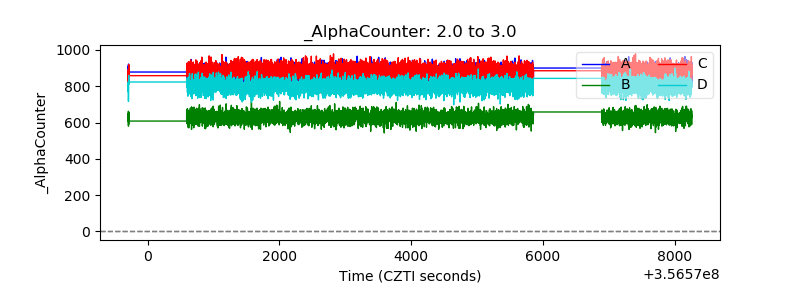 |
| _CPM_Rate | 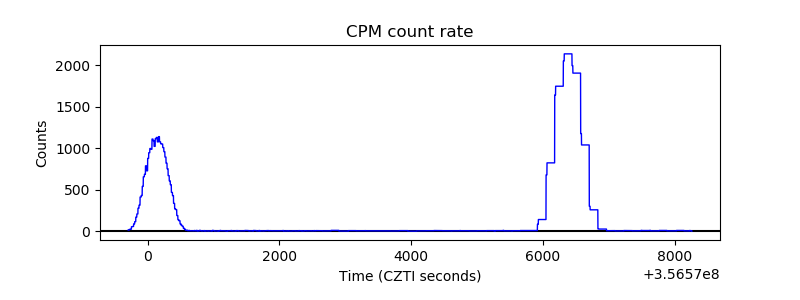 |
| CZT Counter | 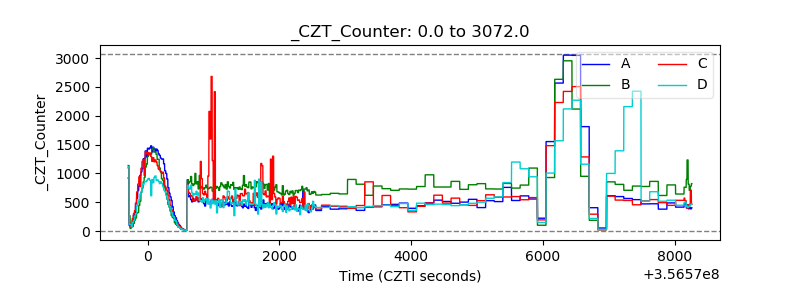 |
| +2.5 Volts monitor | 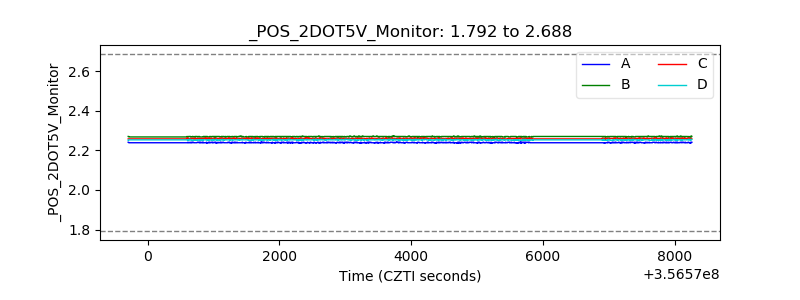 |
| +5 Volts monitor | 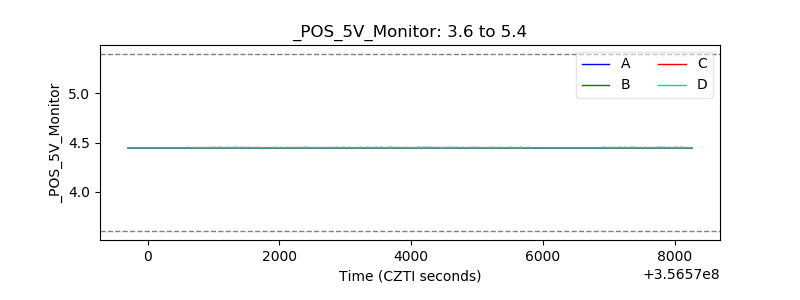 |
| _ROLL_ROT | 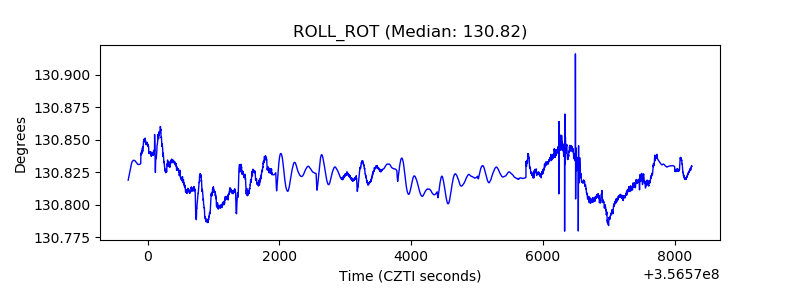 |
| _Roll_DEC | 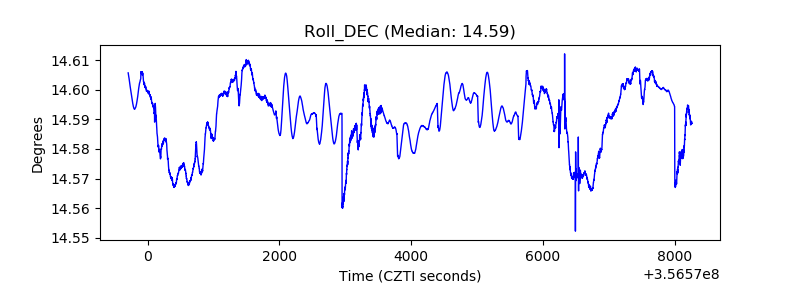 |
| _Roll_RA | 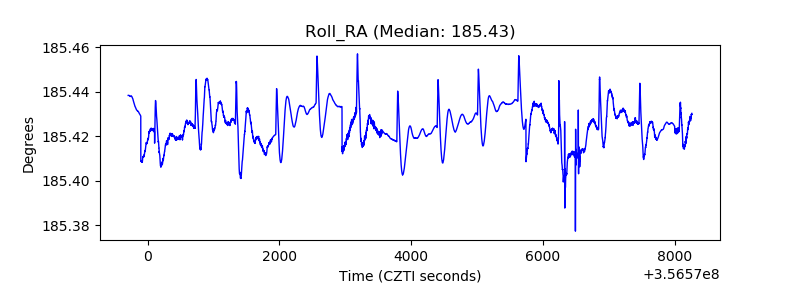 |
| Veto Counter | 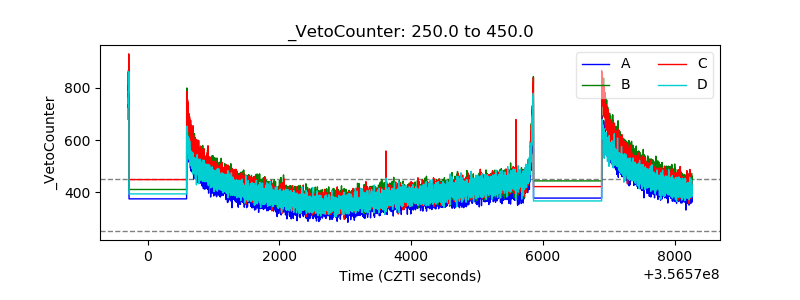 |