| Param | Original file | Final file |
|---|---|---|
| Filename | modeM0/AS1A10_071T07_9000004322_30062cztM0_level2.evt | modeM0/AS1A10_071T07_9000004322_30062cztM0_level2_quad_clean.evt |
| Size (bytes) | 534,242,880 | 87,935,040 |
| Size | 509.5 MB | 83.9 MB |
| Events in quadrant A | 3,203,704 | 568,550 |
| Events in quadrant B | 5,080,790 | 578,619 |
| Events in quadrant C | 3,295,035 | 542,505 |
| Events in quadrant D | 4,162,452 | 522,443 |
| Mode M0 | |||
|---|---|---|---|
| Quadrant | BADHDUFLAG | Total packets | Discarded packets |
| A | 0 | 13426 | 3 |
| B | 0 | 19619 | 2 |
| C | 0 | 13647 | 2 |
| D | 0 | 16872 | 2 |
| Mode SS | |||
|---|---|---|---|
| Quadrant | BADHDUFLAG | Total packets | Discarded packets |
| A | 0 | 130 | 0 |
| B | 0 | 130 | 0 |
| C | 0 | 130 | 0 |
| D | 0 | 130 | 0 |
| Mode M9 | |||
|---|---|---|---|
| Quadrant | BADHDUFLAG | Total packets | Discarded packets |
| A | 0 | 18 | 0 |
| B | 0 | 19 | 0 |
| C | 0 | 19 | 0 |
| D | 0 | 19 | 0 |
| Quadrant | Total seconds | Saturated seconds | Saturation percentage |
|---|---|---|---|
| A | 6464 | 38 | 0.587871% |
| B | 6464 | 51 | 0.788985% |
| C | 6464 | 66 | 1.021040% |
| D | 6464 | 181 | 2.800124% |
Noise dominated data is calculated using 1-second bins in cleaned event files. If a bin has >2000 counts, and if more than 50% of those come from <1% of pixels, then it is considered to be noise-dominated and hence unusable.
| Quadrant | # 1 sec bins | Bins with >0 counts | Bins with >2000 counts | High rate bins dominated by noise | Noise dominated (total time) | Noise dominated (detector-on time) | Marked lightcurve |
|---|---|---|---|---|---|---|---|
| A | 7624 | 6465 | 1 | 1 | 0.01% | 0.02% | 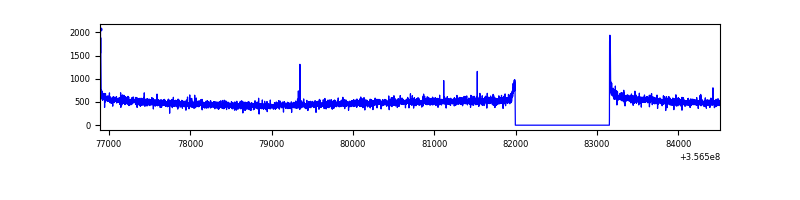 |
| B | 7624 | 6465 | 2 | 2 | 0.03% | 0.03% | 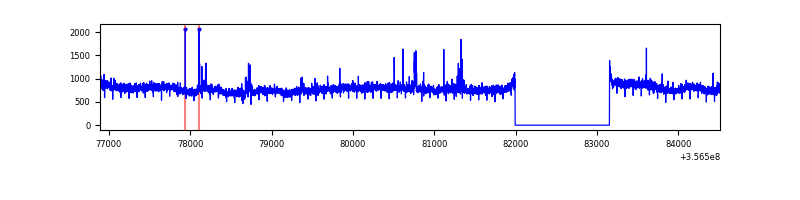 |
| C | 7624 | 6465 | 0 | 0 | 0.00% | 0.00% | 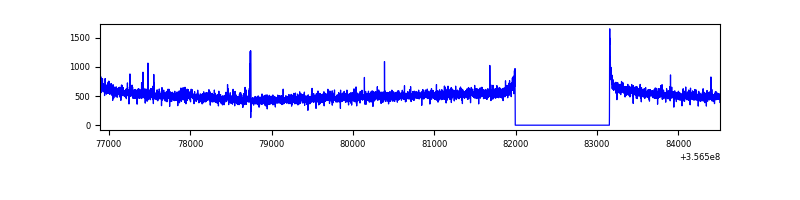 |
| D | 7624 | 6465 | 137 | 137 | 1.80% | 2.12% | 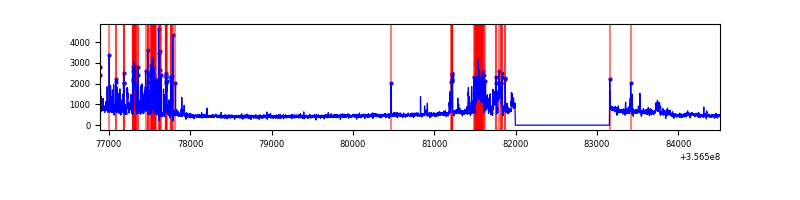 |
Top three noisy pixels from each quadrant. If the there are fewer than three noisy pixels in the level2.evt file, extra rows are filled as -1
| Pixel properties | Quadrant properties | ||||||
|---|---|---|---|---|---|---|---|
| Quadrant | DetID | PixID | Counts | Sigma | Mean | Median | Sigma |
| A | 8 | 192 | 29696 | 176.89 | 823 | 810 | 163.3 |
| A | 13 | 254 | 11660 | 66.44 | 823 | 810 | 163.3 |
| A | 3 | 137 | 8071 | 44.46 | 823 | 810 | 163.3 |
| B | 6 | 159 | 1797658 | 11535.2 | 817 | 799 | 155.8 |
| B | 0 | 230 | 40002 | 251.67 | 817 | 799 | 155.8 |
| B | 5 | 255 | 30843 | 192.87 | 817 | 799 | 155.8 |
| C | 14 | 238 | 130867 | 707.91 | 785 | 792 | 183.7 |
| C | 3 | 233 | 56693 | 304.23 | 785 | 792 | 183.7 |
| C | 1 | 90 | 25177 | 132.71 | 785 | 792 | 183.7 |
| D | 13 | 104 | 896300 | 4938.47 | 776 | 761 | 181.3 |
| D | 8 | 195 | 139468 | 764.9 | 776 | 761 | 181.3 |
| D | 2 | 250 | 84909 | 464.04 | 776 | 761 | 181.3 |
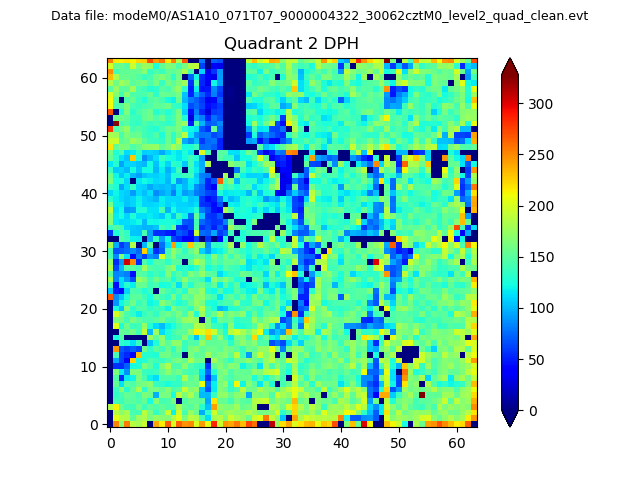
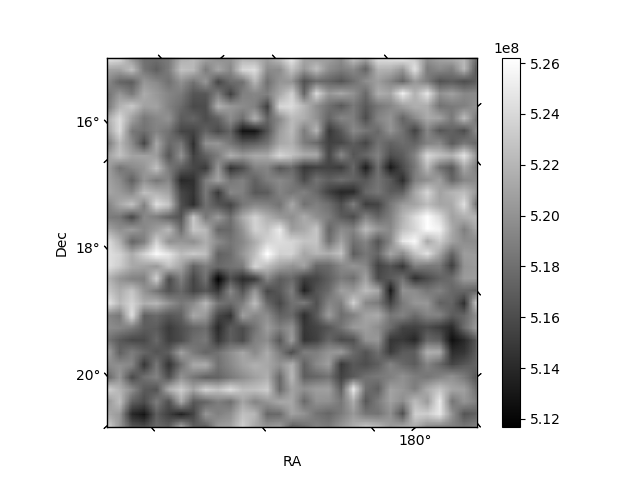
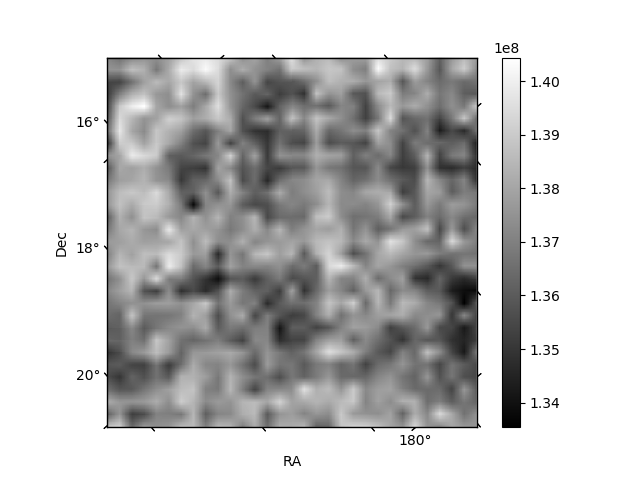
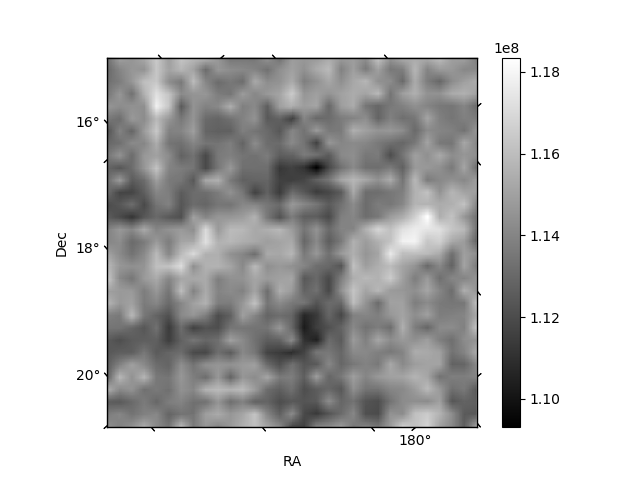
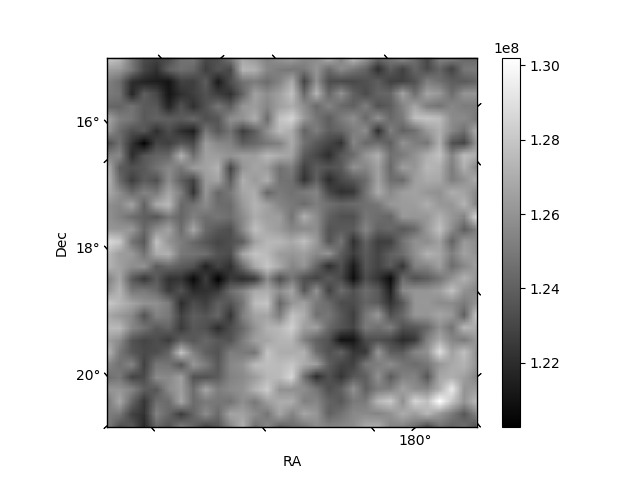
Histogram calculated using DETX and DETY for each event in the final _common_clean file
| Quadrant A | 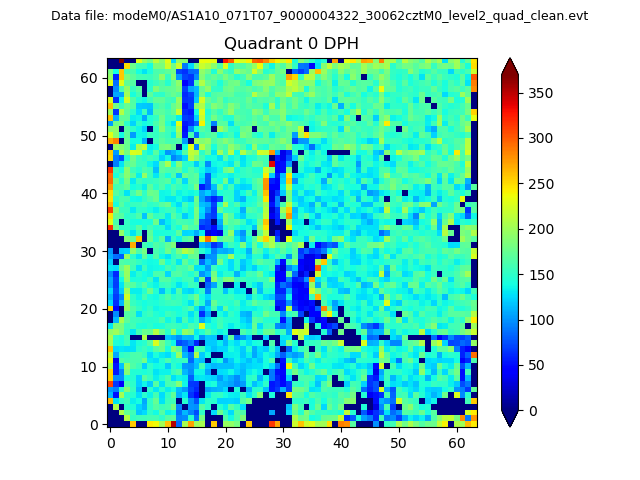 |
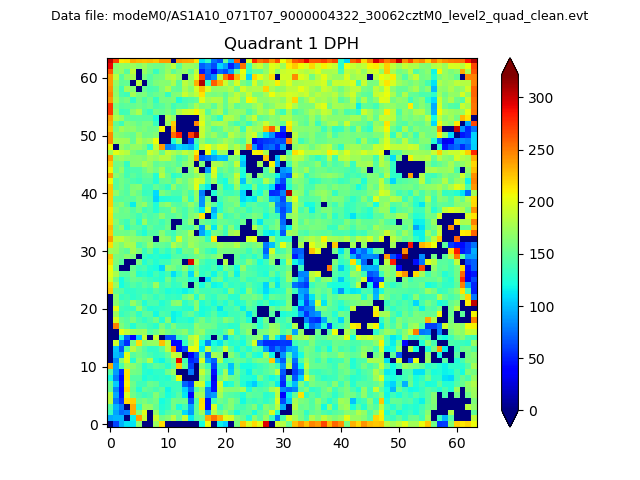 |
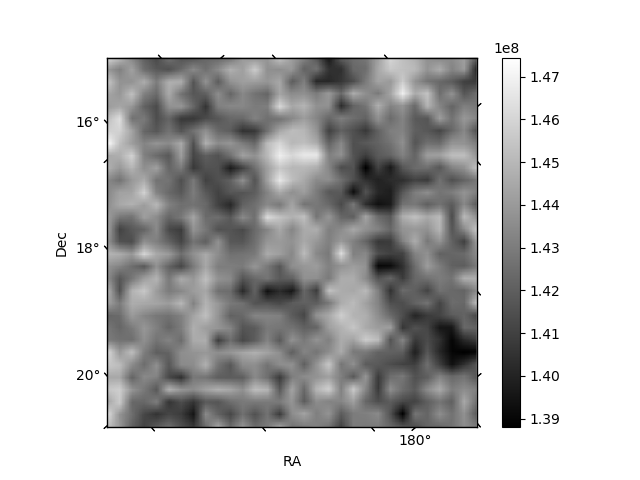
Quadrant B |
|---|---|---|---|
| Quadrant D | 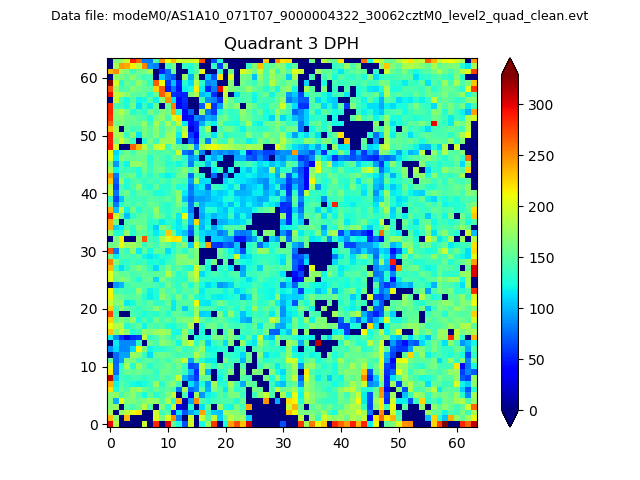 |
 |
Quadrant C |
| Plot type | Count rate plots | Images |
|---|---|---|
| Comparison with Poisson distribution Blue bars denote a histogram of data divided into 1 sec bins. Red curve is a Poisson curve with rate = median count rate of data. |
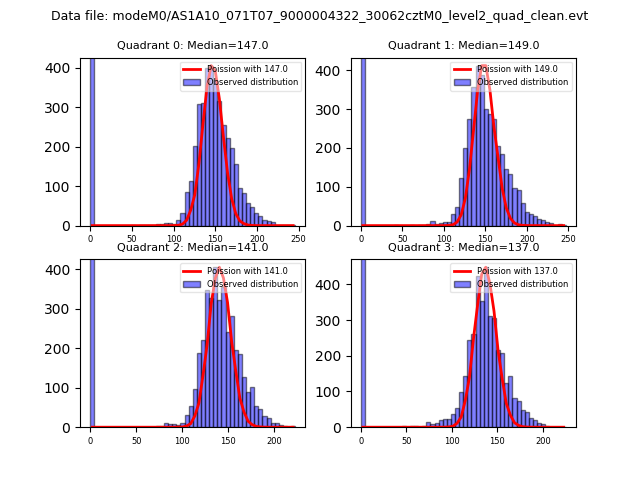 |
 |
| Quadrant-wise count rates Data is divided into 100 sec bins |
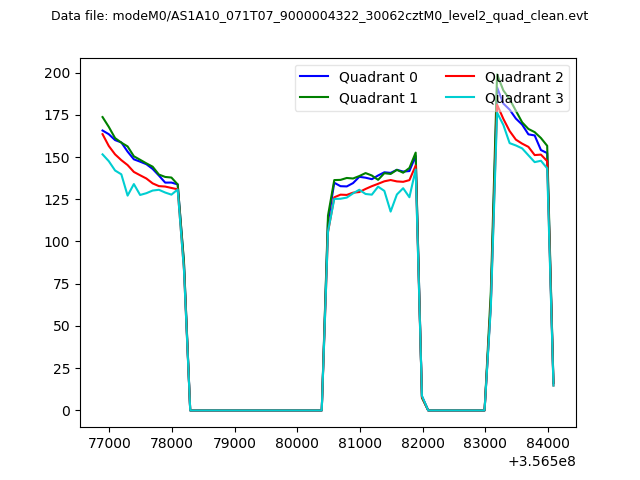 |
|
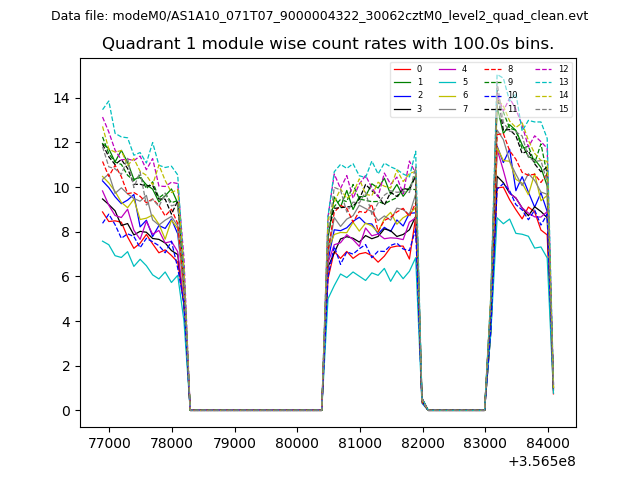
| Module-wise count rates for Quadrant A Data is divided into 100 sec bins |
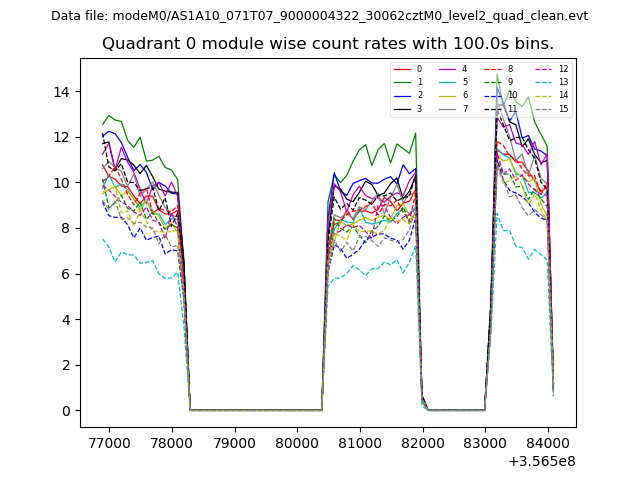 |
 |
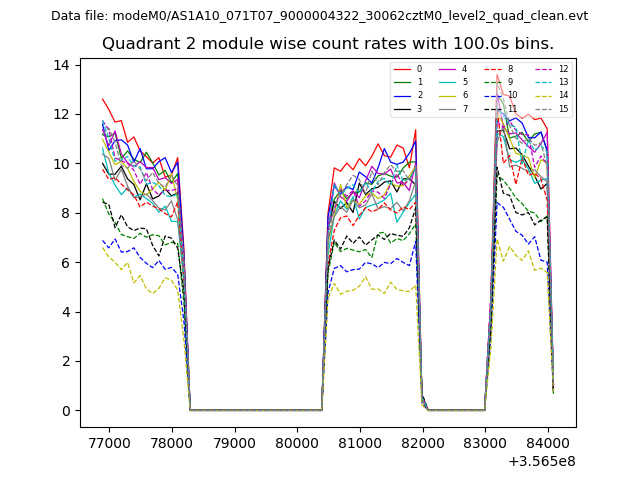
| Module-wise count rates for Quadrant B Data is divided into 100 sec bins |
 |
 |
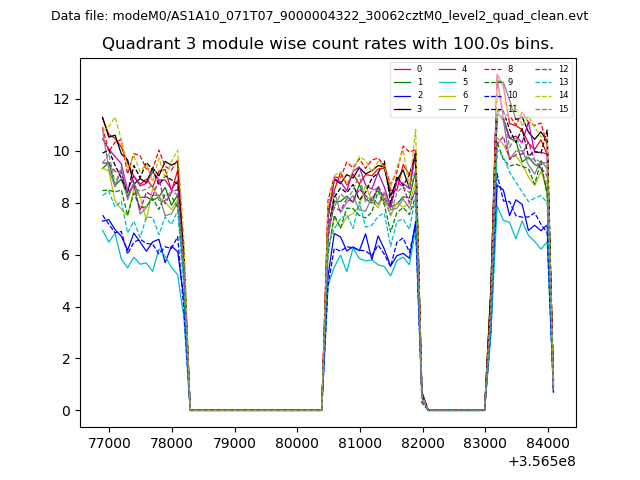
| Module-wise count rates for Quadrant C Data is divided into 100 sec bins |
 |
 |
| Module-wise count rates for Quadrant D Data is divided into 100 sec bins |
 |
 |
| Parameter | Plot |
|---|---|
| CZT HV Monitor | 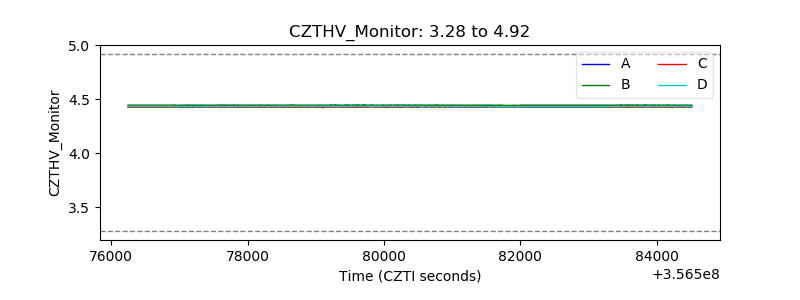 |
| D_VDD | 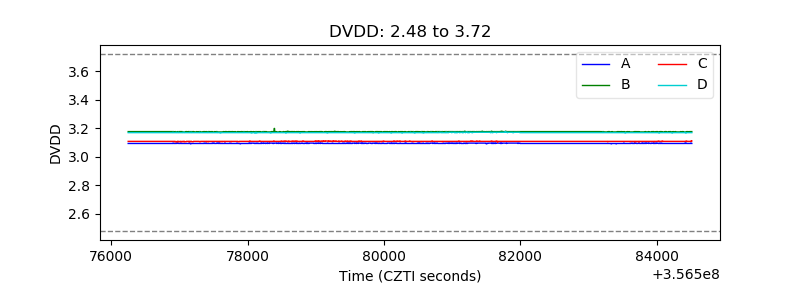 |
| Temperature 1 | 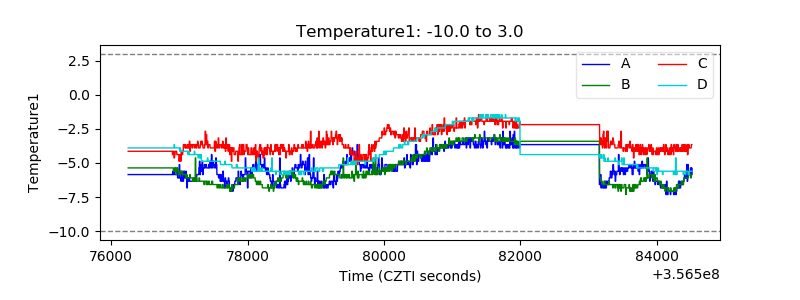 |
| Veto HV Monitor | 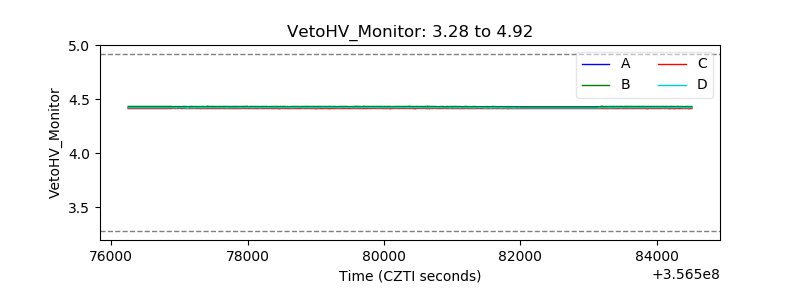 |
| Veto LLD | 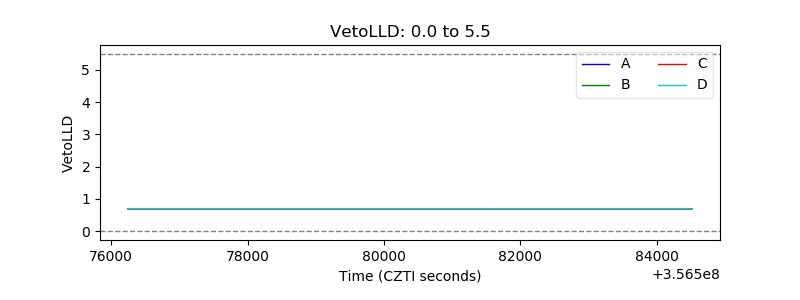 |
| Alpha Counter | 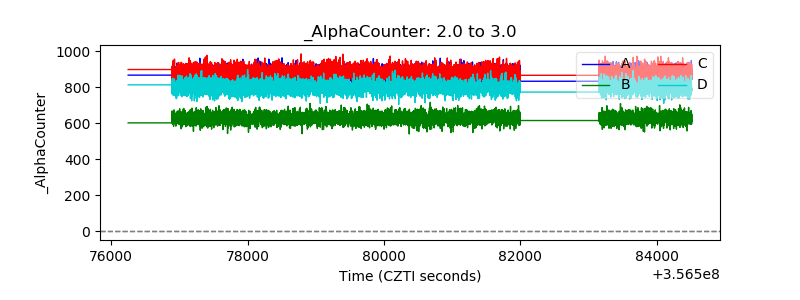 |
| _CPM_Rate | 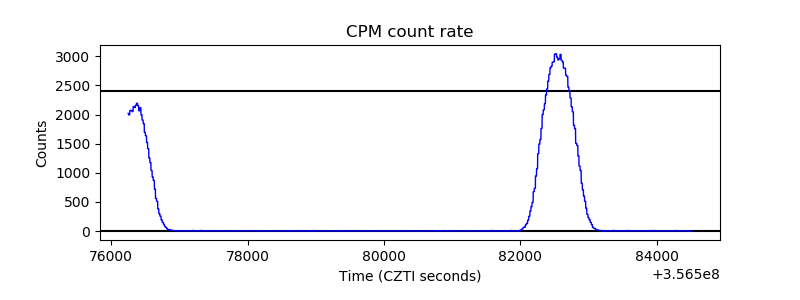 |
| CZT Counter | 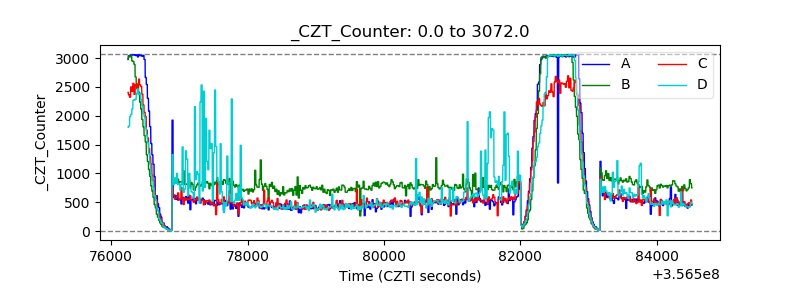 |
| +2.5 Volts monitor | 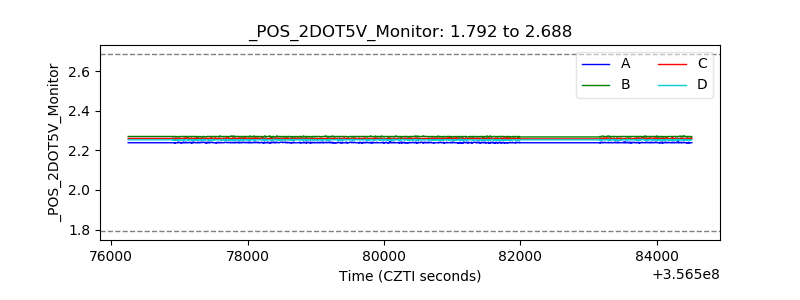 |
| +5 Volts monitor | 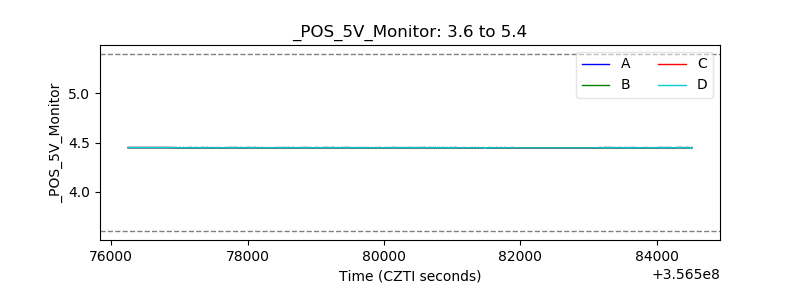 |
| _ROLL_ROT | 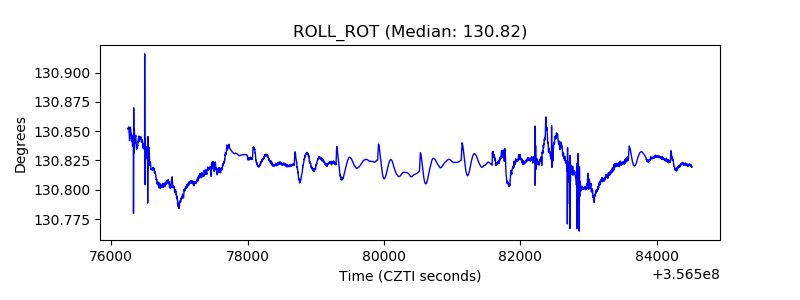 |
| _Roll_DEC | 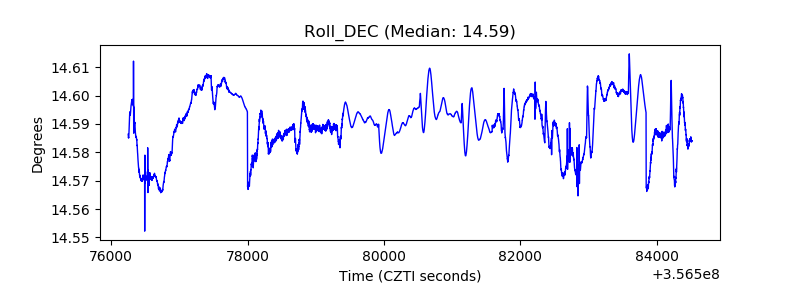 |
| _Roll_RA | 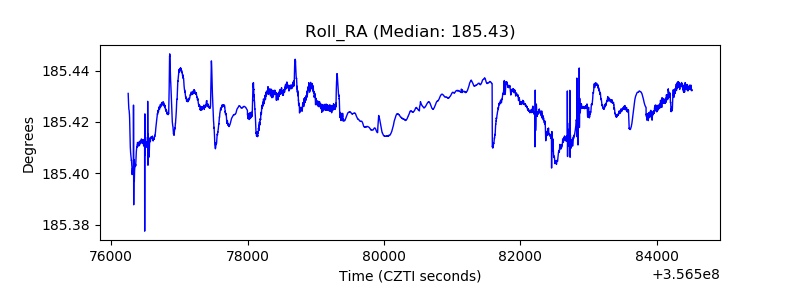 |
| Veto Counter | 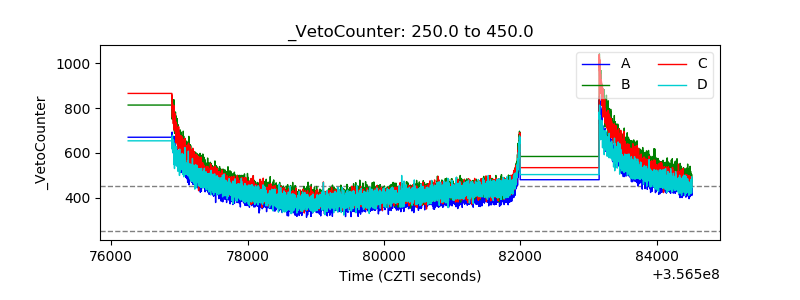 |