| Param | Original file | Final file |
|---|---|---|
| Filename | modeM0/AS1A10_071T07_9000004322_30063cztM0_level2.evt | modeM0/AS1A10_071T07_9000004322_30063cztM0_level2_quad_clean.evt |
| Size (bytes) | 517,052,160 | 81,901,440 |
| Size | 493.1 MB | 78.1 MB |
| Events in quadrant A | 3,269,386 | 526,014 |
| Events in quadrant B | 4,988,534 | 534,677 |
| Events in quadrant C | 3,391,803 | 496,579 |
| Events in quadrant D | 3,586,452 | 487,200 |
| Mode M0 | |||
|---|---|---|---|
| Quadrant | BADHDUFLAG | Total packets | Discarded packets |
| A | 0 | 13343 | 2 |
| B | 0 | 19026 | 2 |
| C | 0 | 13848 | 2 |
| D | 0 | 14826 | 2 |
| Mode SS | |||
|---|---|---|---|
| Quadrant | BADHDUFLAG | Total packets | Discarded packets |
| A | 0 | 126 | 0 |
| B | 0 | 126 | 0 |
| C | 0 | 126 | 0 |
| D | 0 | 126 | 0 |
| Mode M9 | |||
|---|---|---|---|
| Quadrant | BADHDUFLAG | Total packets | Discarded packets |
| A | 0 | 17 | 0 |
| B | 0 | 18 | 0 |
| C | 0 | 18 | 0 |
| D | 0 | 18 | 0 |
| Quadrant | Total seconds | Saturated seconds | Saturation percentage |
|---|---|---|---|
| A | 6245 | 45 | 0.720576% |
| B | 6245 | 76 | 1.216974% |
| C | 6245 | 115 | 1.841473% |
| D | 6245 | 39 | 0.624500% |
Noise dominated data is calculated using 1-second bins in cleaned event files. If a bin has >2000 counts, and if more than 50% of those come from <1% of pixels, then it is considered to be noise-dominated and hence unusable.
| Quadrant | # 1 sec bins | Bins with >0 counts | Bins with >2000 counts | High rate bins dominated by noise | Noise dominated (total time) | Noise dominated (detector-on time) | Marked lightcurve |
|---|---|---|---|---|---|---|---|
| A | 7485 | 6246 | 0 | 0 | 0.00% | 0.00% | 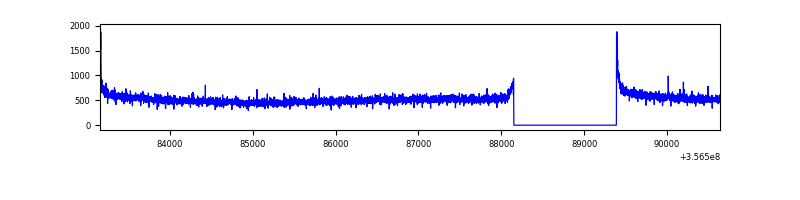 |
| B | 7485 | 6246 | 0 | 0 | 0.00% | 0.00% | 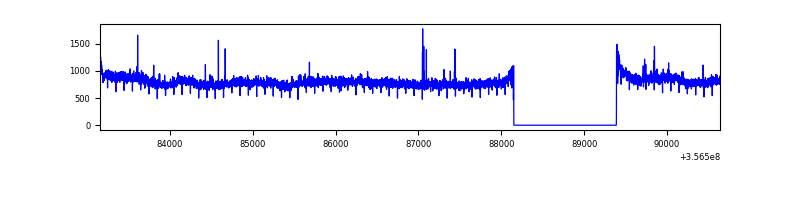 |
| C | 7485 | 6246 | 0 | 0 | 0.00% | 0.00% | 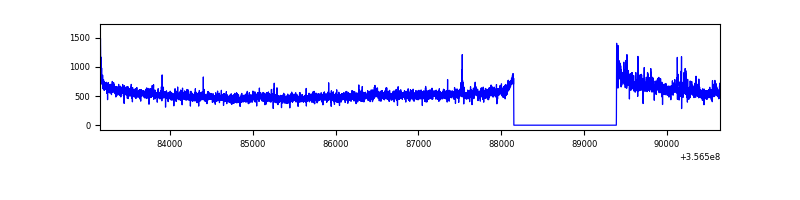 |
| D | 7485 | 6246 | 10 | 10 | 0.13% | 0.16% | 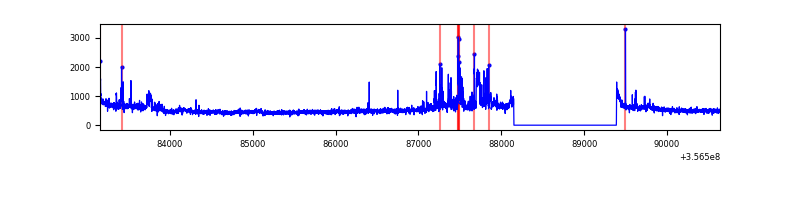 |
Top three noisy pixels from each quadrant. If the there are fewer than three noisy pixels in the level2.evt file, extra rows are filled as -1
| Pixel properties | Quadrant properties | ||||||
|---|---|---|---|---|---|---|---|
| Quadrant | DetID | PixID | Counts | Sigma | Mean | Median | Sigma |
| A | 8 | 192 | 26498 | 154.84 | 840 | 829 | 165.8 |
| A | 13 | 254 | 11801 | 66.19 | 840 | 829 | 165.8 |
| A | 3 | 137 | 8189 | 44.4 | 840 | 829 | 165.8 |
| B | 6 | 159 | 1686104 | 10711.18 | 835 | 817 | 157.3 |
| B | 12 | 111 | 19197 | 116.82 | 835 | 817 | 157.3 |
| B | 11 | 111 | 17463 | 105.8 | 835 | 817 | 157.3 |
| C | 14 | 238 | 157854 | 852.18 | 793 | 800 | 184.3 |
| C | 3 | 233 | 87355 | 469.65 | 793 | 800 | 184.3 |
| C | 14 | 254 | 36752 | 195.08 | 793 | 800 | 184.3 |
| D | 13 | 104 | 262334 | 1405.77 | 794 | 777 | 186.1 |
| D | 8 | 195 | 126616 | 676.34 | 794 | 777 | 186.1 |
| D | 1 | 52 | 70787 | 376.28 | 794 | 777 | 186.1 |
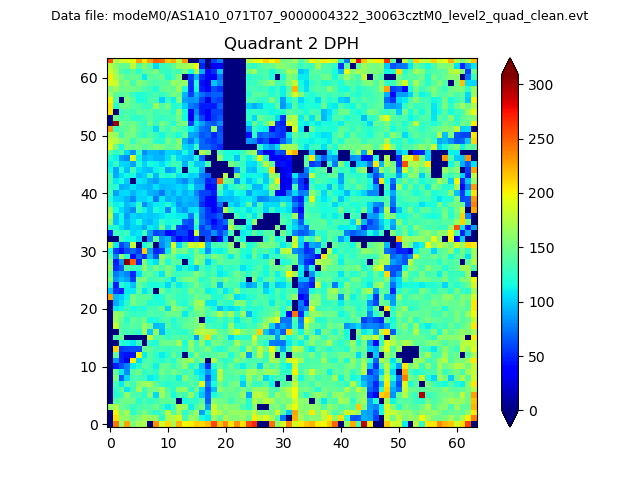
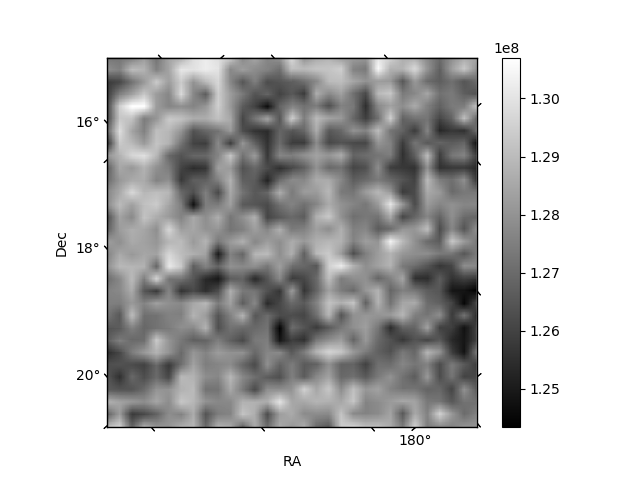
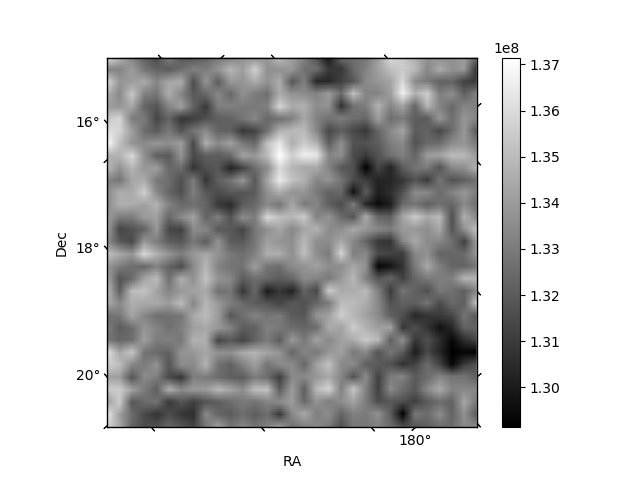
Histogram calculated using DETX and DETY for each event in the final _common_clean file
| Quadrant A |  |
 |
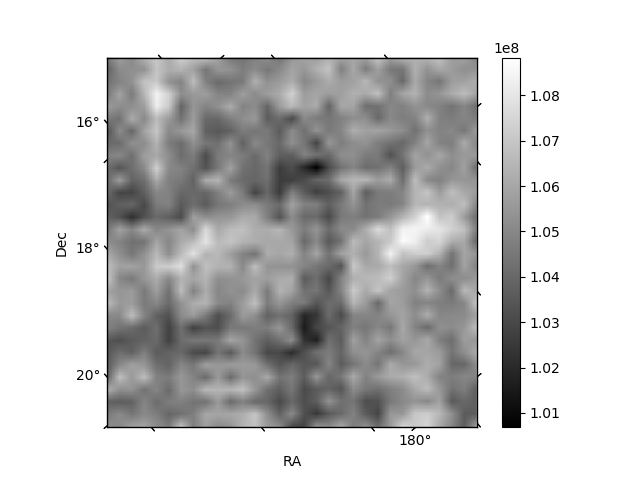
Quadrant B |
|---|---|---|---|
| Quadrant D | 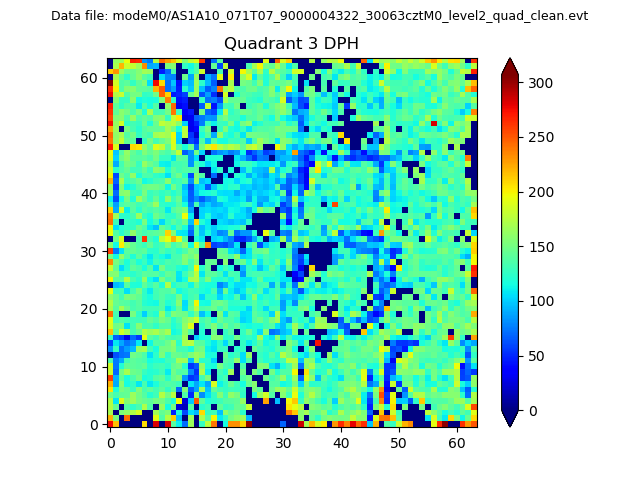 |
 |
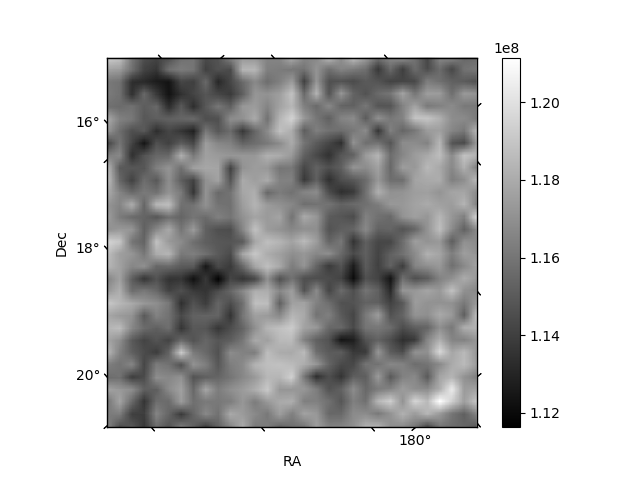
Quadrant C |
| Plot type | Count rate plots | Images |
|---|---|---|
| Comparison with Poisson distribution Blue bars denote a histogram of data divided into 1 sec bins. Red curve is a Poisson curve with rate = median count rate of data. |
 |
 |
| Quadrant-wise count rates Data is divided into 100 sec bins |
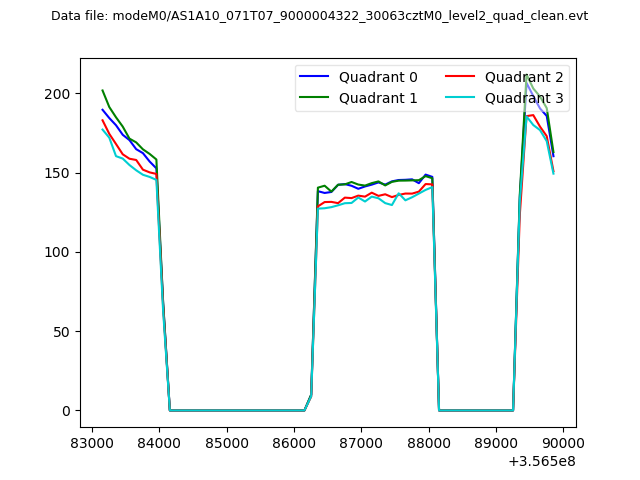 |
|
| Module-wise count rates for Quadrant A Data is divided into 100 sec bins |
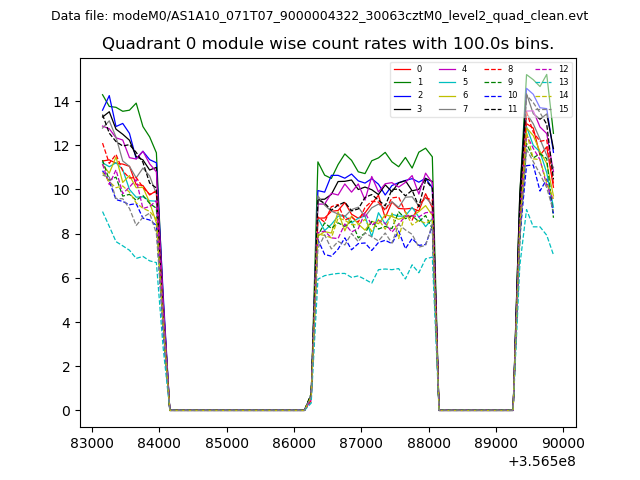 |
 |
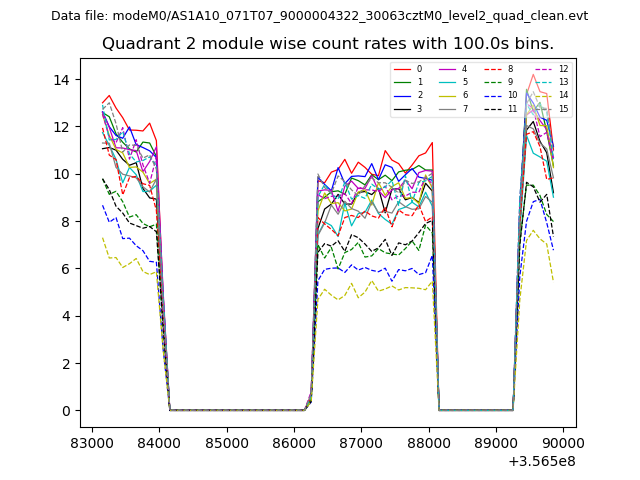
| Module-wise count rates for Quadrant B Data is divided into 100 sec bins |
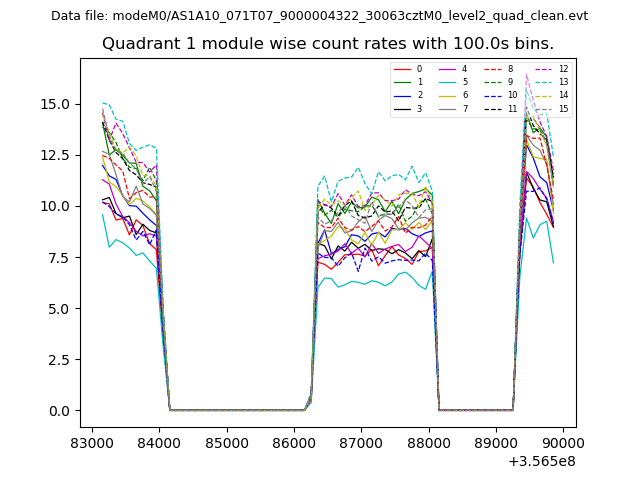 |
 |
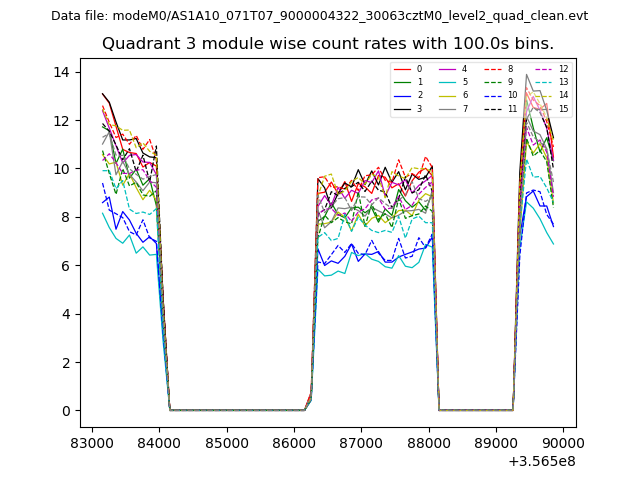
| Module-wise count rates for Quadrant C Data is divided into 100 sec bins |
 |
 |
| Module-wise count rates for Quadrant D Data is divided into 100 sec bins |
 |
 |
| Parameter | Plot |
|---|---|
| CZT HV Monitor | 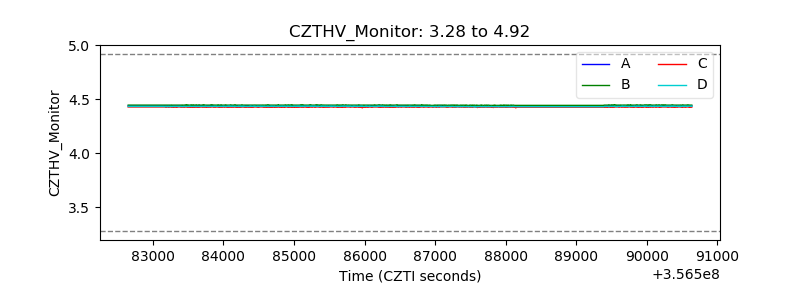 |
| D_VDD | 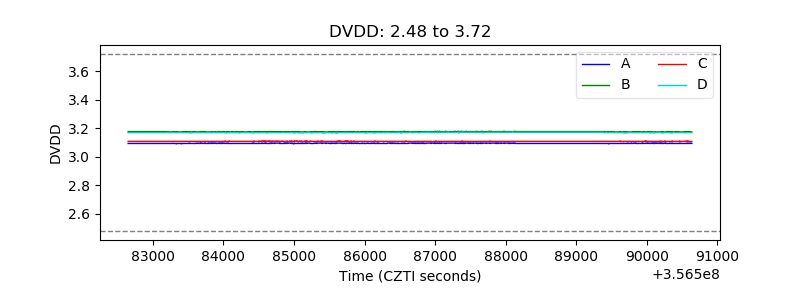 |
| Temperature 1 | 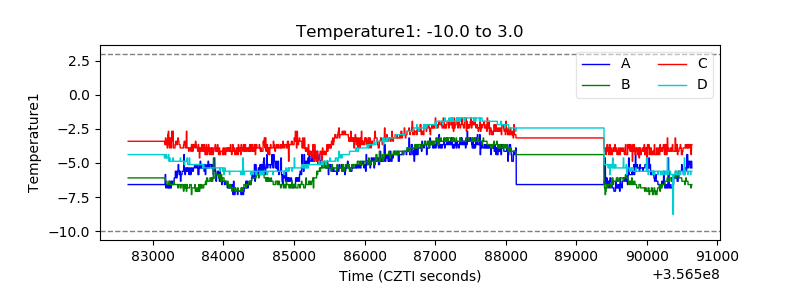 |
| Veto HV Monitor | 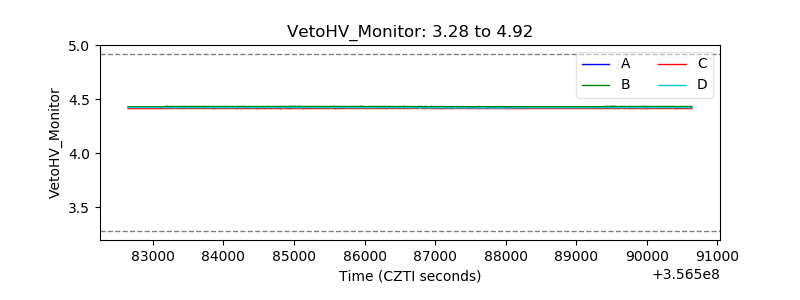 |
| Veto LLD | 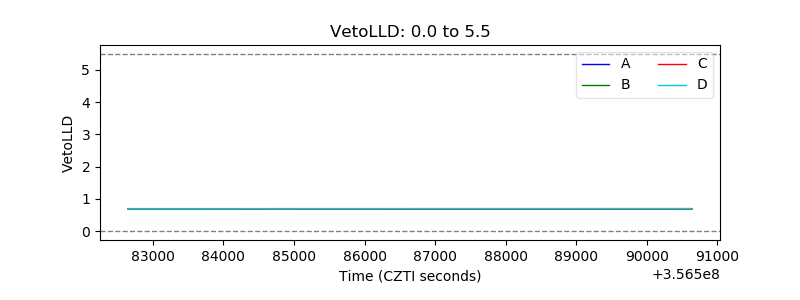 |
| Alpha Counter | 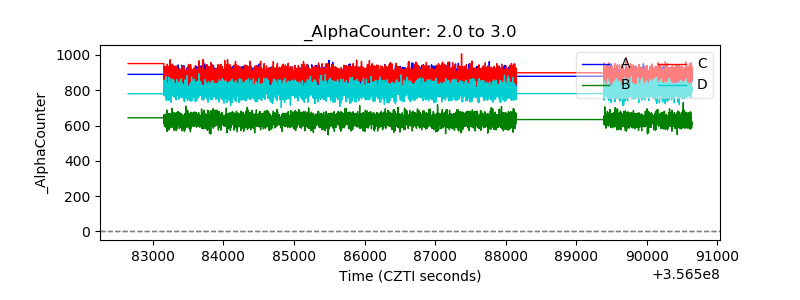 |
| _CPM_Rate | 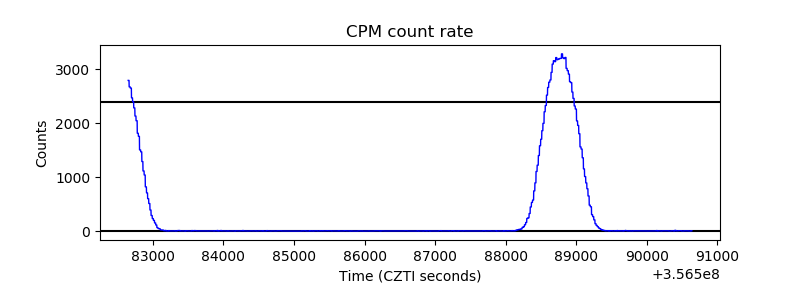 |
| CZT Counter | 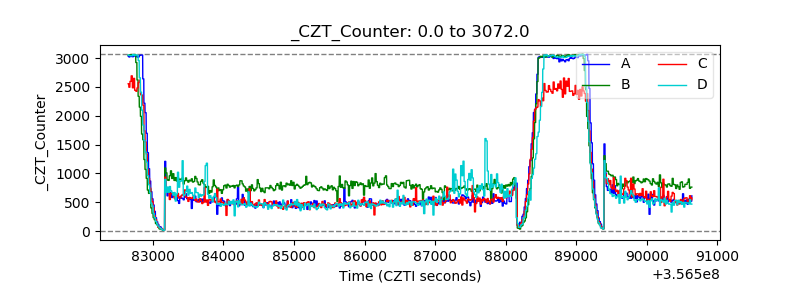 |
| +2.5 Volts monitor |  |
| +5 Volts monitor |  |
| _ROLL_ROT |  |
| _Roll_DEC | 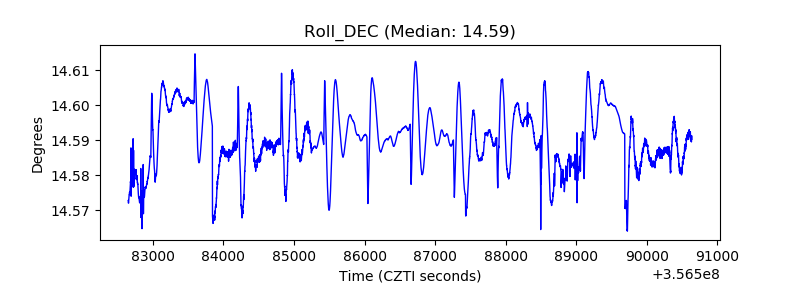 |
| _Roll_RA | 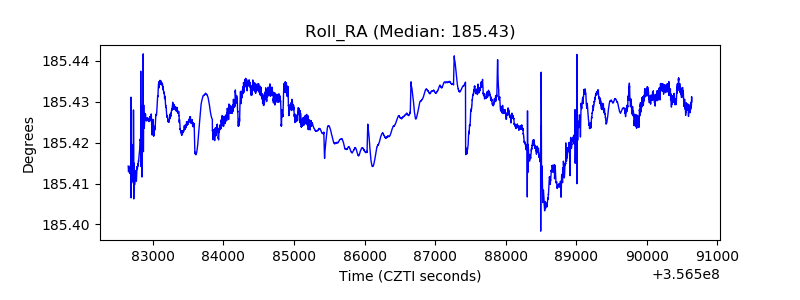 |
| Veto Counter | 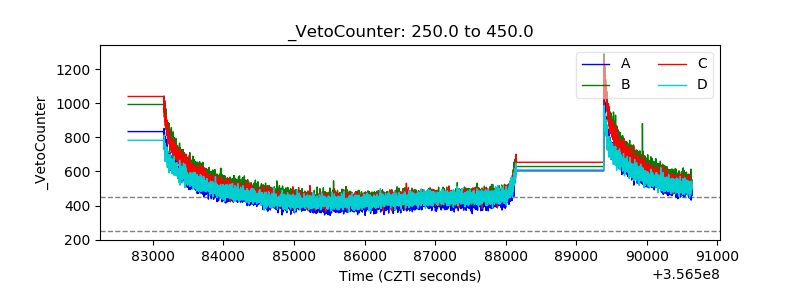 |