| Param | Original file | Final file |
|---|---|---|
| Filename | modeM0/AS1A10_071T07_9000004322_30064cztM0_level2.evt | modeM0/AS1A10_071T07_9000004322_30064cztM0_level2_quad_clean.evt |
| Size (bytes) | 568,405,440 | 69,897,600 |
| Size | 542.1 MB | 66.7 MB |
| Events in quadrant A | 3,420,403 | 447,755 |
| Events in quadrant B | 5,127,664 | 453,789 |
| Events in quadrant C | 3,926,401 | 376,811 |
| Events in quadrant D | 4,314,015 | 399,247 |
| Mode M0 | |||
|---|---|---|---|
| Quadrant | BADHDUFLAG | Total packets | Discarded packets |
| A | 0 | 13707 | 2 |
| B | 0 | 19279 | 2 |
| C | 0 | 15679 | 2 |
| D | 0 | 16657 | 2 |
| Mode SS | |||
|---|---|---|---|
| Quadrant | BADHDUFLAG | Total packets | Discarded packets |
| A | 0 | 126 | 0 |
| B | 0 | 126 | 0 |
| C | 0 | 126 | 0 |
| D | 0 | 126 | 0 |
| Mode M9 | |||
|---|---|---|---|
| Quadrant | BADHDUFLAG | Total packets | Discarded packets |
| A | 0 | 17 | 0 |
| B | 0 | 18 | 0 |
| C | 0 | 18 | 0 |
| D | 0 | 18 | 0 |
| Quadrant | Total seconds | Saturated seconds | Saturation percentage |
|---|---|---|---|
| A | 6288 | 40 | 0.636132% |
| B | 6288 | 92 | 1.463104% |
| C | 6287 | 883 | 14.044854% |
| D | 6287 | 348 | 5.535231% |
Noise dominated data is calculated using 1-second bins in cleaned event files. If a bin has >2000 counts, and if more than 50% of those come from <1% of pixels, then it is considered to be noise-dominated and hence unusable.
| Quadrant | # 1 sec bins | Bins with >0 counts | Bins with >2000 counts | High rate bins dominated by noise | Noise dominated (total time) | Noise dominated (detector-on time) | Marked lightcurve |
|---|---|---|---|---|---|---|---|
| A | 7633 | 6289 | 3 | 3 | 0.04% | 0.05% | 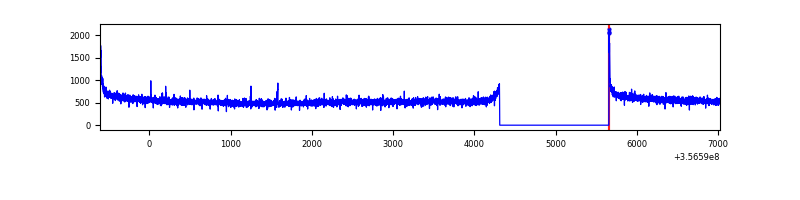 |
| B | 7633 | 6289 | 3 | 3 | 0.04% | 0.05% | 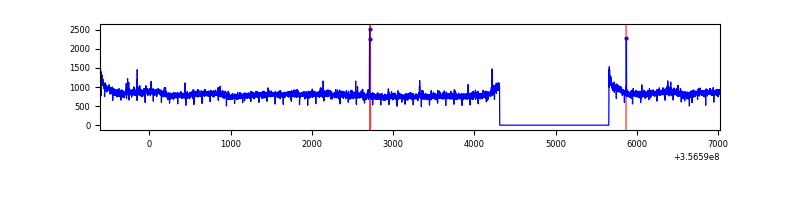 |
| C | 7632 | 6288 | 1 | 1 | 0.01% | 0.02% | 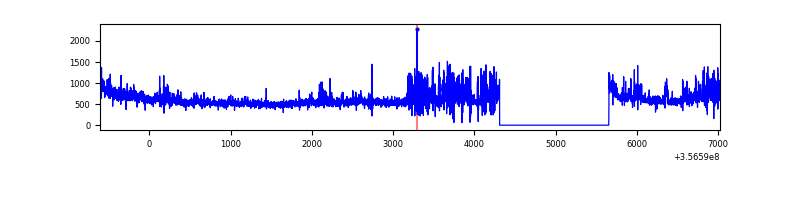 |
| D | 7632 | 6288 | 273 | 273 | 3.58% | 4.34% | 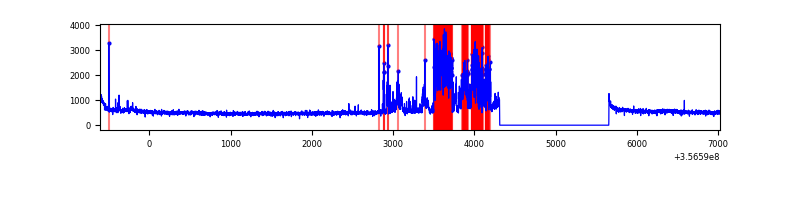 |
Top three noisy pixels from each quadrant. If the there are fewer than three noisy pixels in the level2.evt file, extra rows are filled as -1
| Pixel properties | Quadrant properties | ||||||
|---|---|---|---|---|---|---|---|
| Quadrant | DetID | PixID | Counts | Sigma | Mean | Median | Sigma |
| A | 8 | 192 | 25097 | 139.42 | 879 | 866 | 173.8 |
| A | 13 | 254 | 10377 | 54.72 | 879 | 866 | 173.8 |
| A | 3 | 137 | 8176 | 42.06 | 879 | 866 | 173.8 |
| B | 6 | 159 | 1679338 | 10279.1 | 872 | 852 | 163.3 |
| B | 12 | 111 | 19851 | 116.35 | 872 | 852 | 163.3 |
| B | 11 | 111 | 18095 | 105.6 | 872 | 852 | 163.3 |
| C | 14 | 238 | 379148 | 2097.28 | 776 | 781 | 180.4 |
| C | 14 | 254 | 342276 | 1892.89 | 776 | 781 | 180.4 |
| C | 3 | 233 | 165207 | 911.41 | 776 | 781 | 180.4 |
| D | 13 | 104 | 1040039 | 5446.63 | 813 | 796 | 190.8 |
| D | 8 | 195 | 130954 | 682.15 | 813 | 796 | 190.8 |
| D | 7 | 223 | 36371 | 186.45 | 813 | 796 | 190.8 |
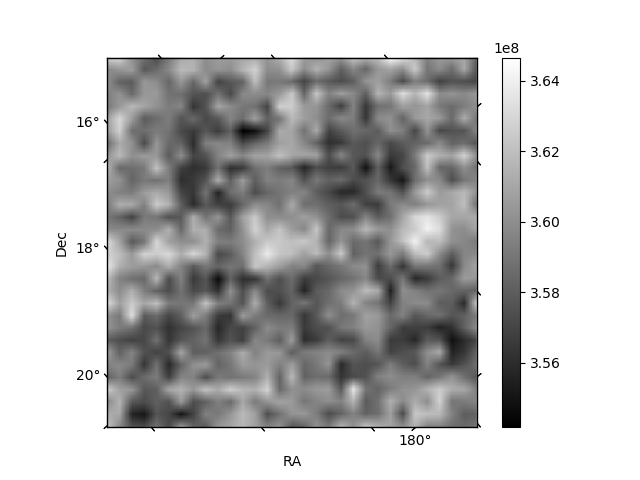
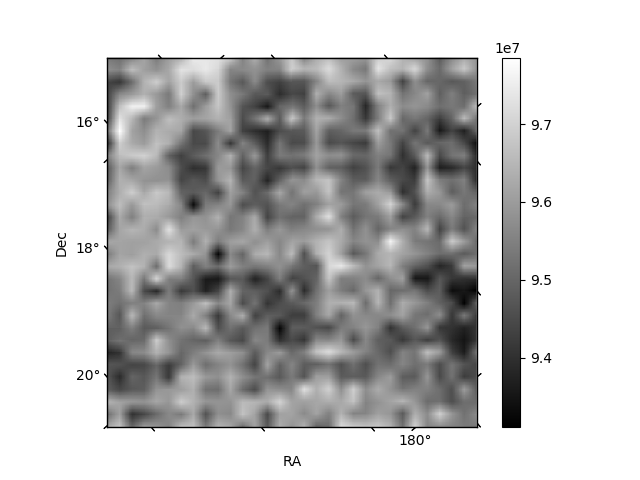
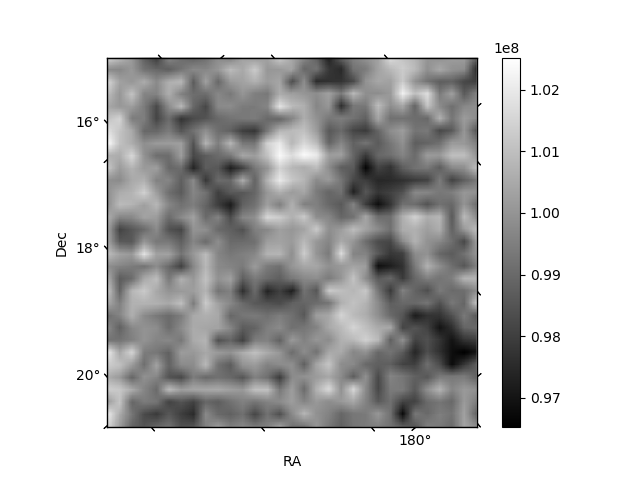
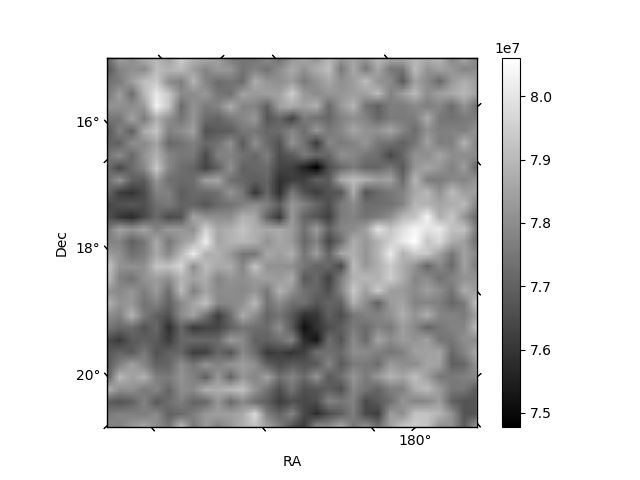
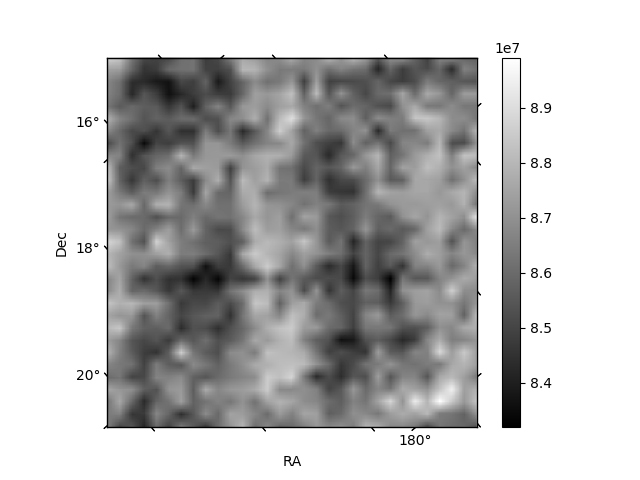
Histogram calculated using DETX and DETY for each event in the final _common_clean file
| Quadrant A | 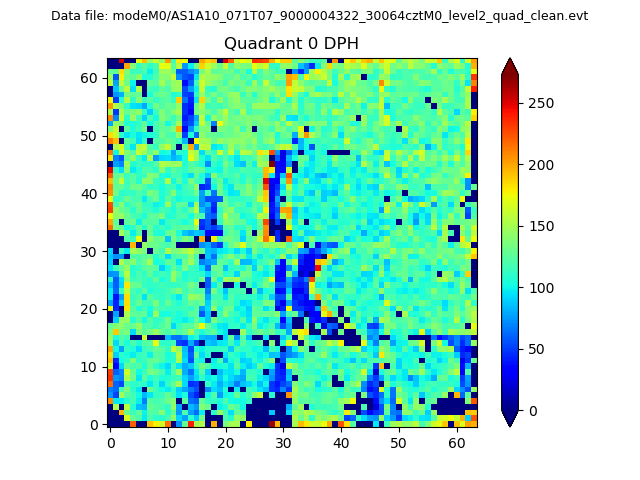 |
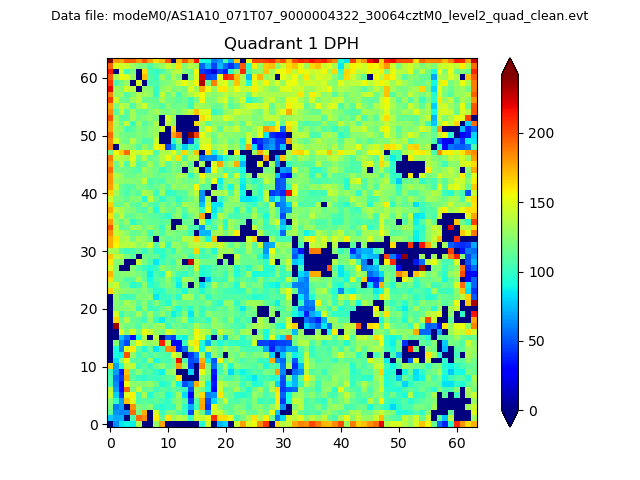 |
Quadrant B |
|---|---|---|---|
| Quadrant D | 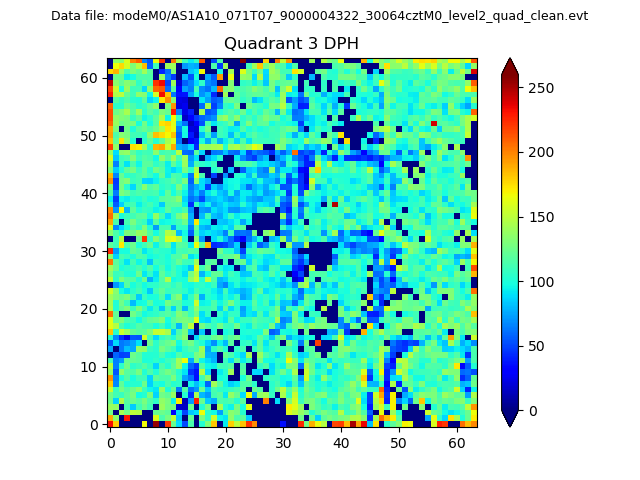 |
 |
Quadrant C |
| Plot type | Count rate plots | Images |
|---|---|---|
| Comparison with Poisson distribution Blue bars denote a histogram of data divided into 1 sec bins. Red curve is a Poisson curve with rate = median count rate of data. |
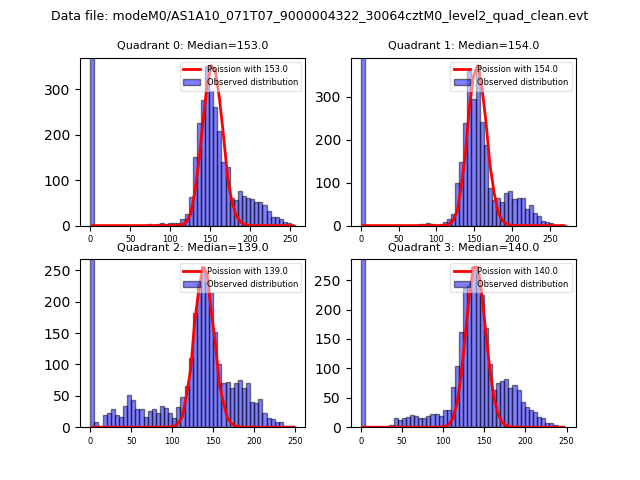 |
 |
| Quadrant-wise count rates Data is divided into 100 sec bins |
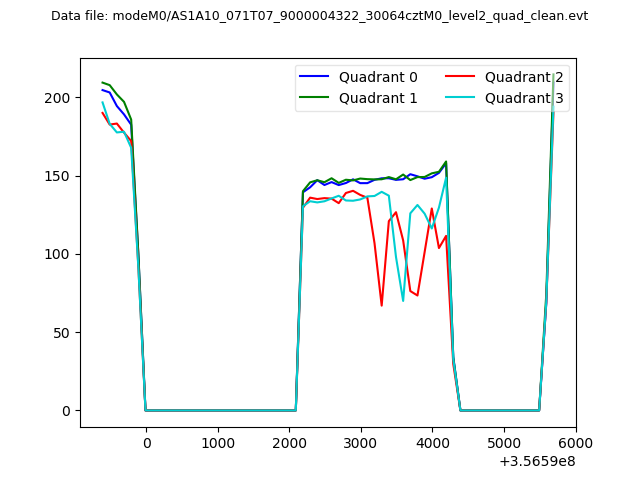 |
|
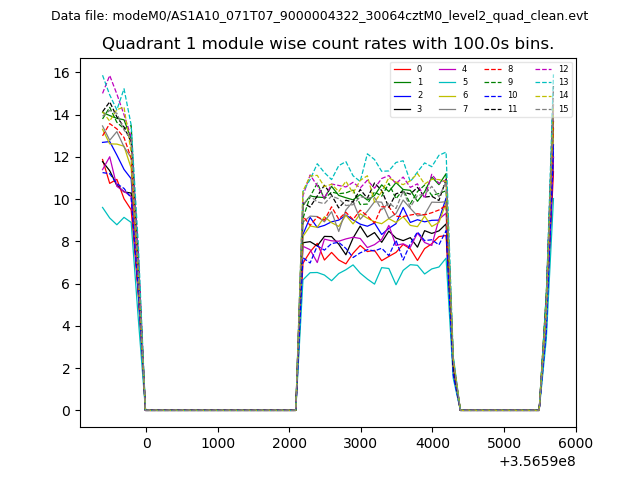
| Module-wise count rates for Quadrant A Data is divided into 100 sec bins |
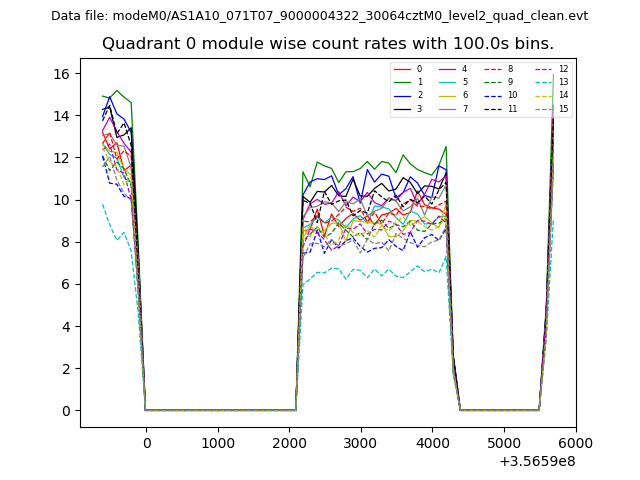 |
 |
| Module-wise count rates for Quadrant B Data is divided into 100 sec bins |
 |
 |
| Module-wise count rates for Quadrant C Data is divided into 100 sec bins |
 |
 |
| Module-wise count rates for Quadrant D Data is divided into 100 sec bins |
 |
 |
| Parameter | Plot |
|---|---|
| CZT HV Monitor |  |
| D_VDD | 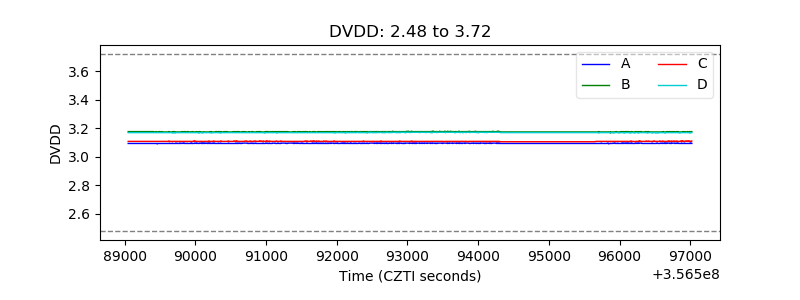 |
| Temperature 1 | 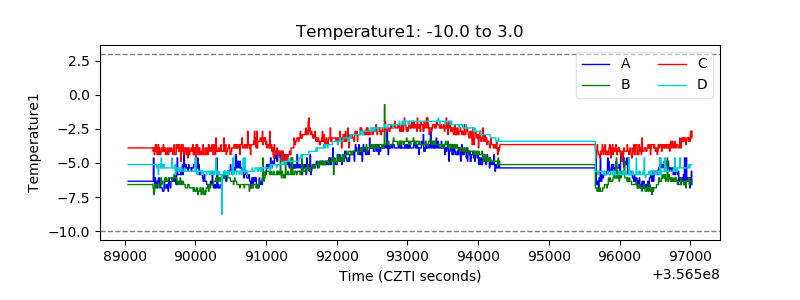 |
| Veto HV Monitor | 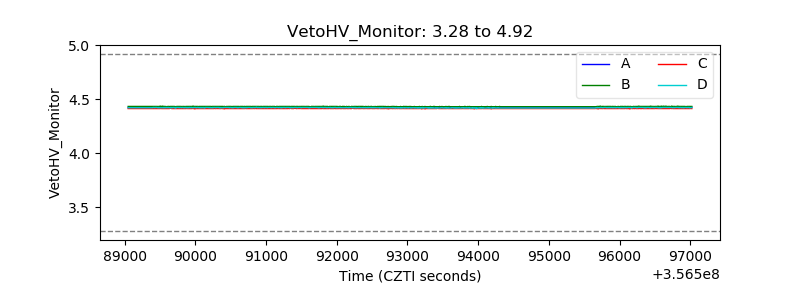 |
| Veto LLD | 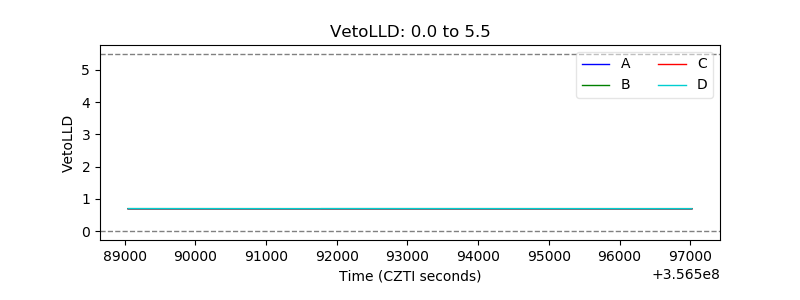 |
| Alpha Counter | 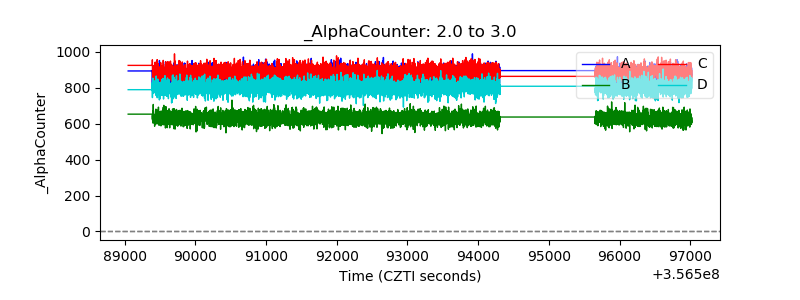 |
| _CPM_Rate | 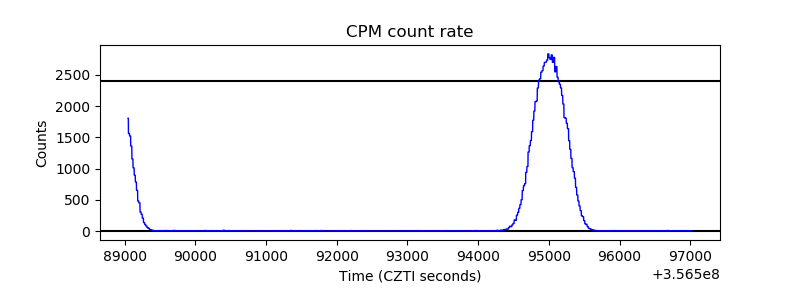 |
| CZT Counter | 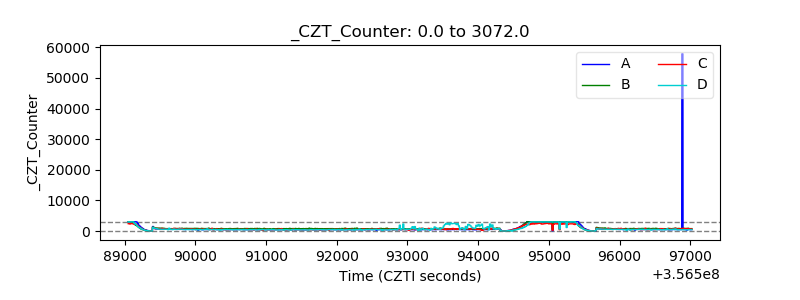 |
| +2.5 Volts monitor | 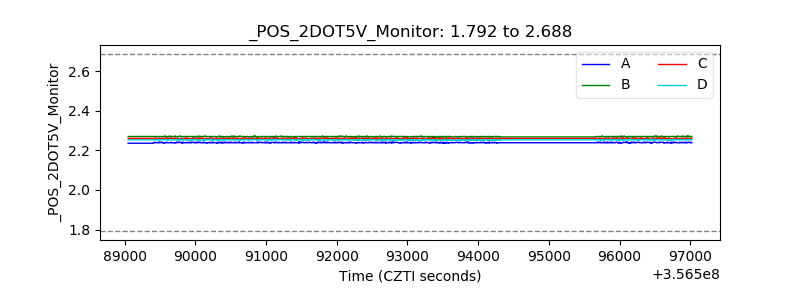 |
| +5 Volts monitor | 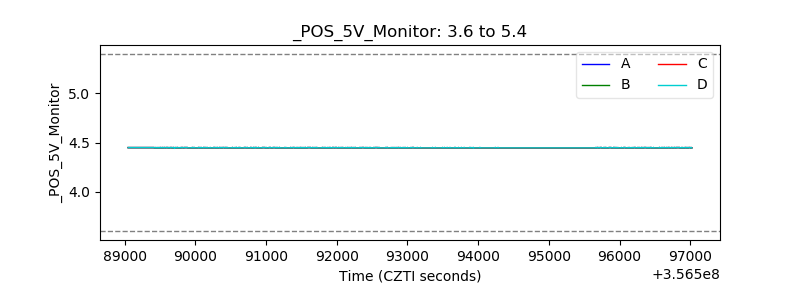 |
| _ROLL_ROT | 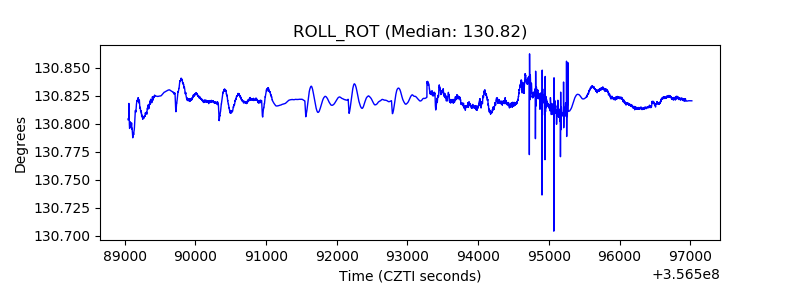 |
| _Roll_DEC | 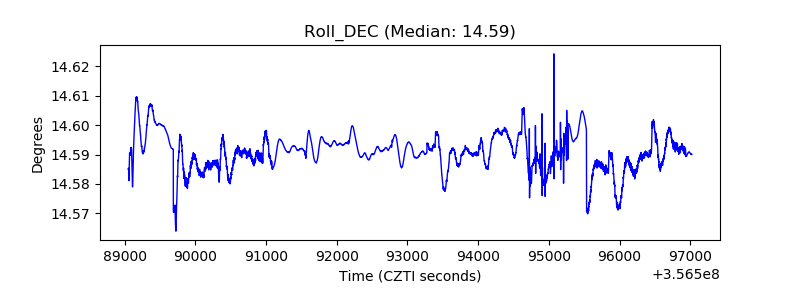 |
| _Roll_RA | 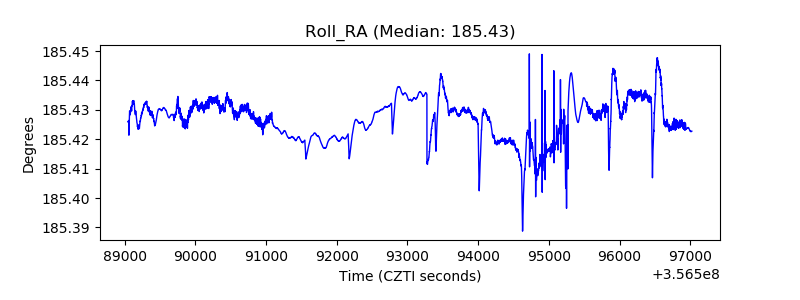 |
| Veto Counter | 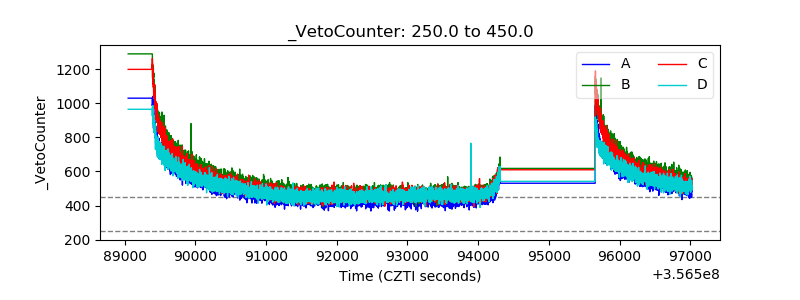 |